Bitcoin exited from the triangle ┆ HolderStatBINANCE:BTCUSDT is dipping to retest $112,000, the last breakout level. The price remains inside a large ascending triangle and may soon resume its uptrend. If this support holds, targets above $125,000 come back into play.
Btcusdsignal
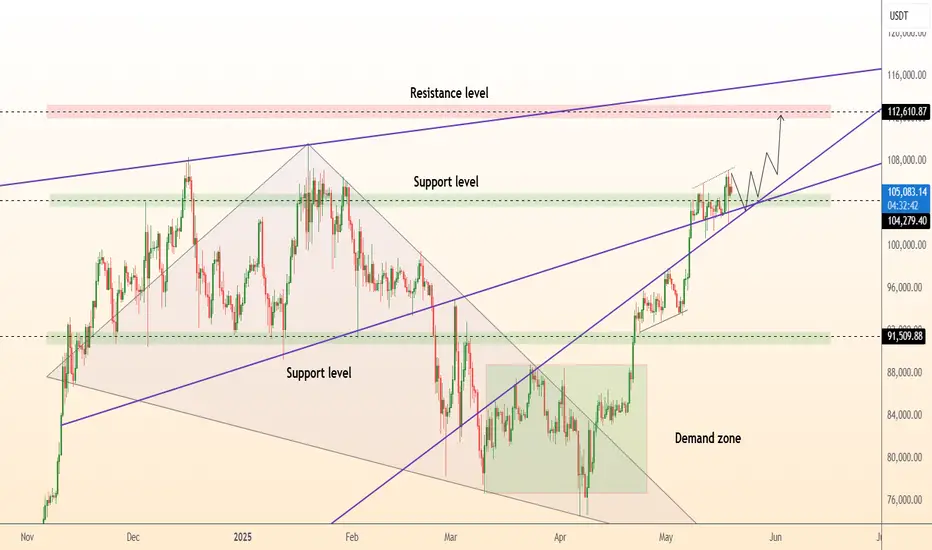
BTCUSD IdeaWe are waiting for our asset to reach our action zone, and based on the reaction, we’ll decide on our next moves.ALWAYS WAIT FOR A CONFIRMATION TO SEE IF THE PRICE VALIDATES THE ZONE.and you what is your vision of the EURUSD its interests me! i wait you in the commentary
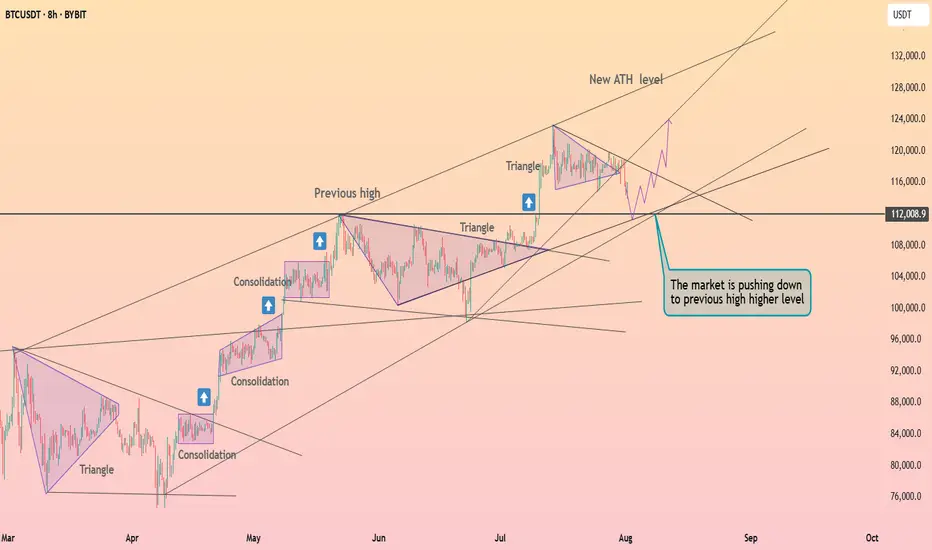
Bitcoin - The cycles are playing out!⚔️Bitcoin ( CRYPTO:BTCUSD ) just repeats another cycle:
🔎Analysis summary:
Following all of the previous all time high breakouts, Bitcoin will now further extend the rally. After some simple calculation, we can see that Bitcoin will rally another +50% in order to reach the overall price target. However there will be volatility along the way so make sure to remain calm.
📝Levels to watch:
$200.000
SwingTraderPhil
SwingTrading.Simplified. | Investing.Simplified. | #LONGTERMVISION

BTCUSD BULLYING Bitcoin is still respecting price and is buying can expect some nice moves (New Highs)
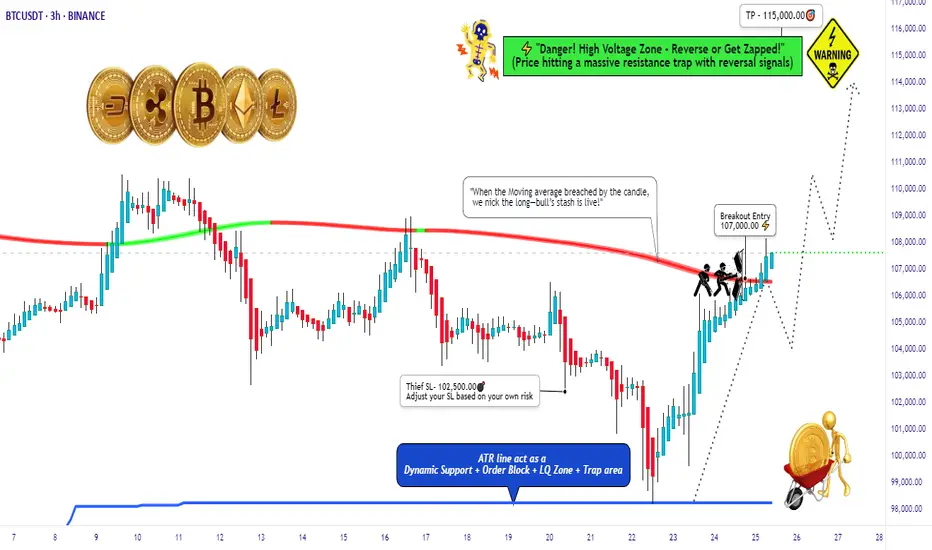
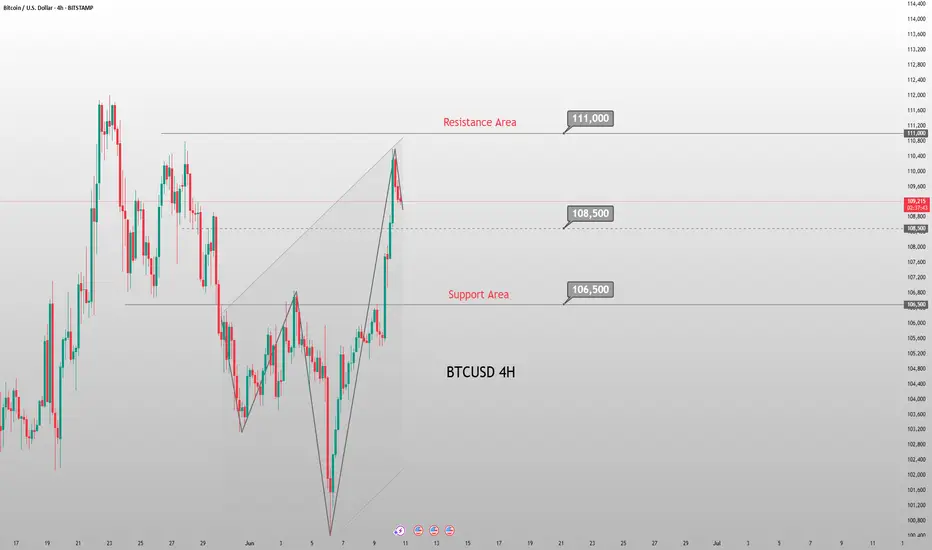
BTC/USD Thief Breakout at $107K – Eyeing $115K!🚨 Thief Entry Setup: BTC/USD Breakout Play 🚨
Overview:
Jump in after the $107 000 breakout—aiming for $115 000 with a tight “Thief SL” at $102 500. Adjust the stop‑loss to match your personal risk tolerance.
🧠 Setup Summary
Pair: BTC/USD
Entry trigger: Breakout above $107 000
Stop‑Loss: “Thief SL” at $102 500 (use your own risk‑based SL)
Target: $115 000
🎯 Why This Setup?
Clear breakout level at $107 000 = fresh momentum
Tight SL cushion (≈‑4.3%) = defined risk
Target ≈ +7.5% potential = strong reward-to-risk (~1.75:1)
📏 Risk Management Tips:
Only risk a small % of your capital—never exceed your comfort zone.
Move your SL to breakeven once mid‑target is hit to lock in profits.
Trailing your stop‑loss could secure bigger gains if BTC surges toward $115 000.
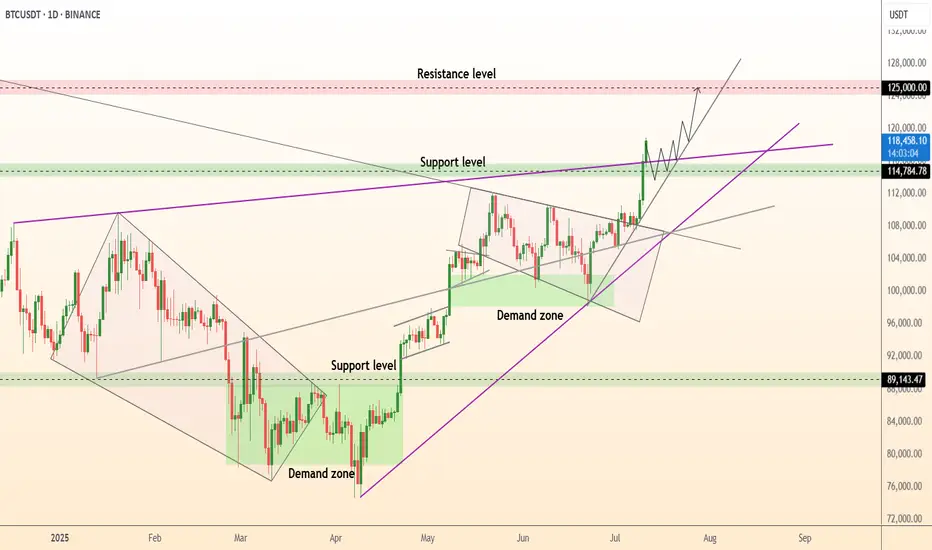
DeGRAM | BTCUSD ATH📊 Technical Analysis
● Daily close above the purple 2-month trend-cap and 114.8 k horizontal flips both into support, confirming the grey ascending triangle break.
● Measured move and channel geometry aim at the 125 k supply band; higher-lows keep bulls in control while risk is contained by the 107 k–109 k demand shelf (confluence of mid-line and former wedge top).
💡 Fundamental Analysis
● Spot-ETF net inflows (>10 k BTC since 8 Jul) and stable miner balances signal shrinking sell pressure, while softer US CPI has pushed real yields to 3-week lows—reviving crypto bid.
✨ Summary
Long 109–112 k; hold above 114.8 k targets 120 k → 125 k. Invalidate on a daily close below 107 k.
-------------------
Share your opinion in the comments and support the idea with a like. Thanks for your support!
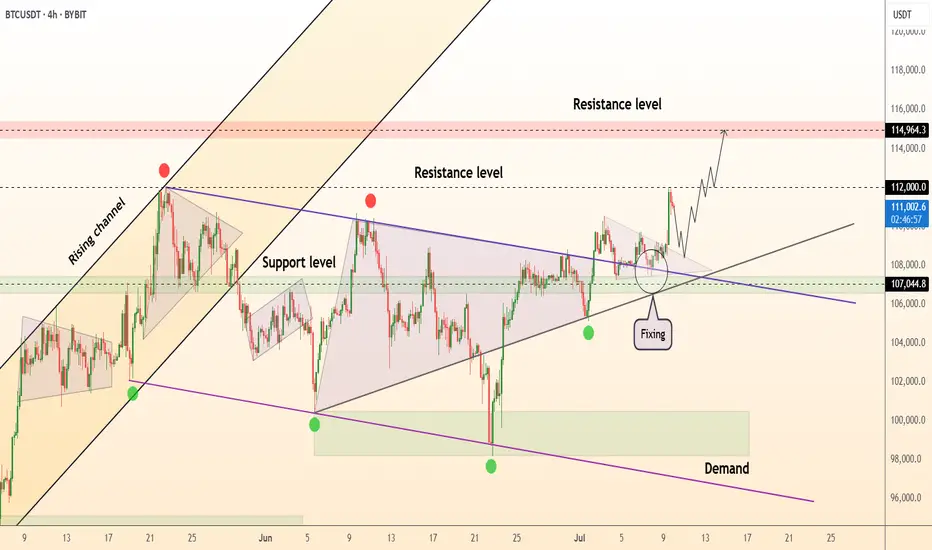
DeGRAM | BTCUSD got out from the triangle📊 Technical Analysis
● Price reclaimed the purple 2-month trend cap and has “fixed” above the 107 k former supply, turning it into support; this validates the grey ascending triangle whose base lies on the channel mid-line.
● Triangle height and prior swing grid point to 112 k first, then the 114.9 k May high just beneath the channel ceiling. Invalid if candles sink back below 107 k.
💡 Fundamental Analysis
● Spot-ETF desks added >9 800 BTC since Friday while on-chain miner reserves stabilised, suggesting dwindling sell pressure just as U.S. CPI relief is lifting real-yield headwinds.
✨ Summary
Long 107–108 k; breakout >112 k opens 114.9 k. Bull view void on 4 h close <107 k.
-------------------
Share your opinion in the comments and support the idea with a like. Thanks for your support!
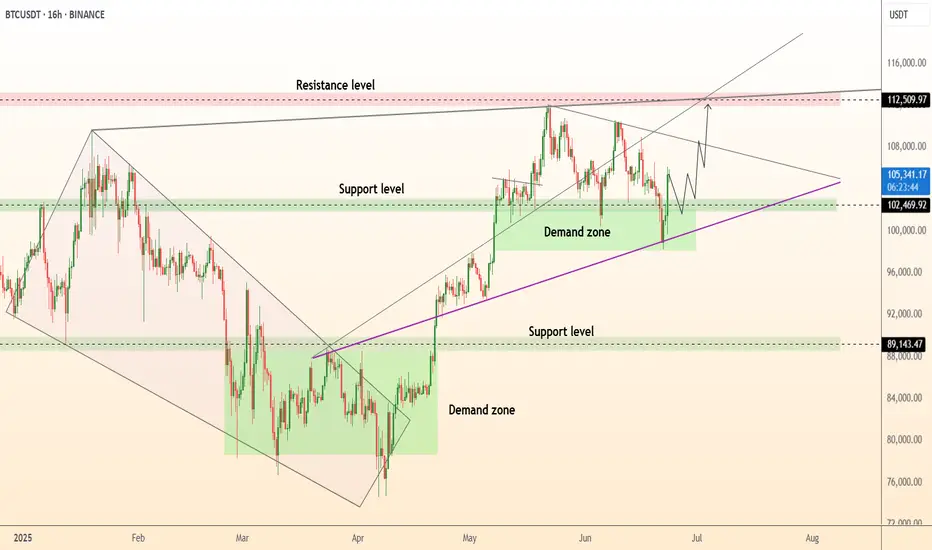
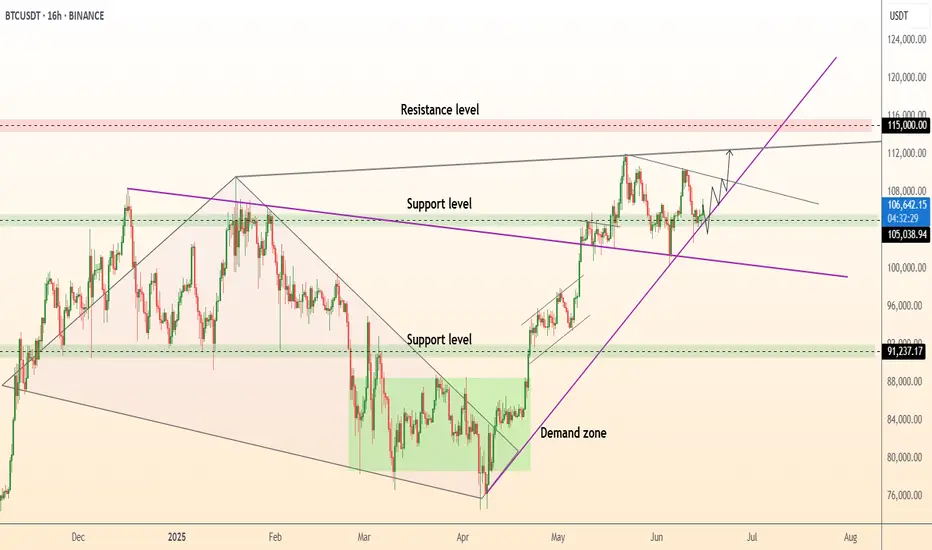
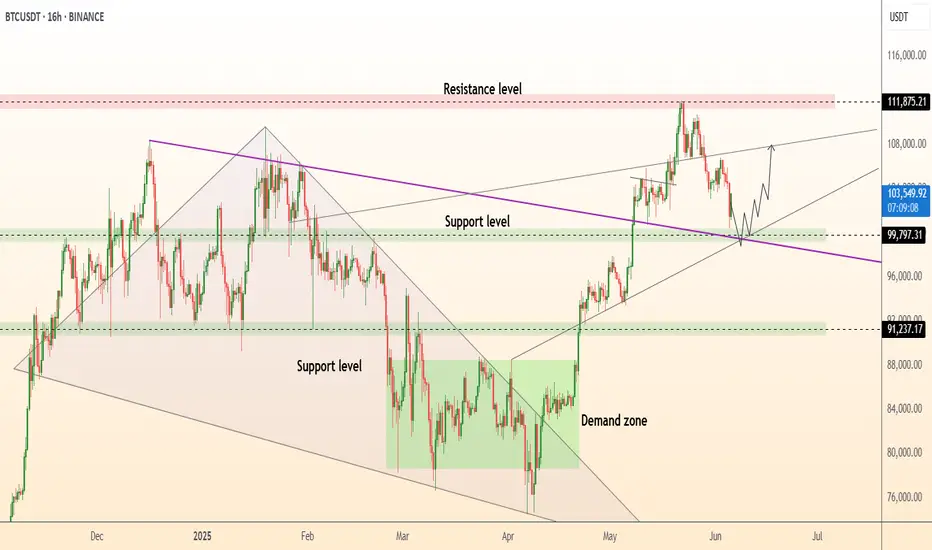
DeGRAM | BTCUSD once again trading above $105k📊 Technical Analysis
● Fresh bounce off the confluence of the 8-month up-sloping purple trend-line and 102-103 k green demand box prints a higher-low inside the rising wedge, keeping bulls in control despite June’s pull-back.
● Price is reclaiming the minor down-trend line from the 12 Jun high; a daily close above 106 k confirms a bear-trap and unlocks the 111.8-112.5 k supply at the wedge cap.
💡 Fundamental Analysis
● Spot-ETF desks absorbed >5 400 BTC in the last three sessions while exchange reserves fell to a four-year low, signalling supply drain.
● Cooling US PCE expectations trimmed real yields, and Mt Gox repayment delays ease overhang fears—both supportive for risk assets.
✨ Summary
Long 102–104 k; hold above 106 k targets 111.8 k → 115 k. Bull thesis void on a 16 h close below 99 k.
-------------------
Share your opinion in the comments and support the idea with a like. Thanks for your support!
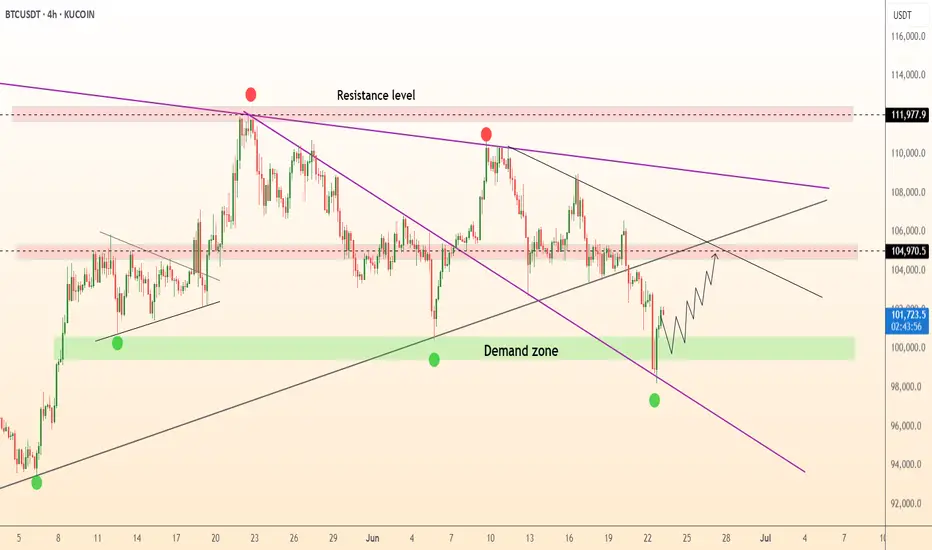
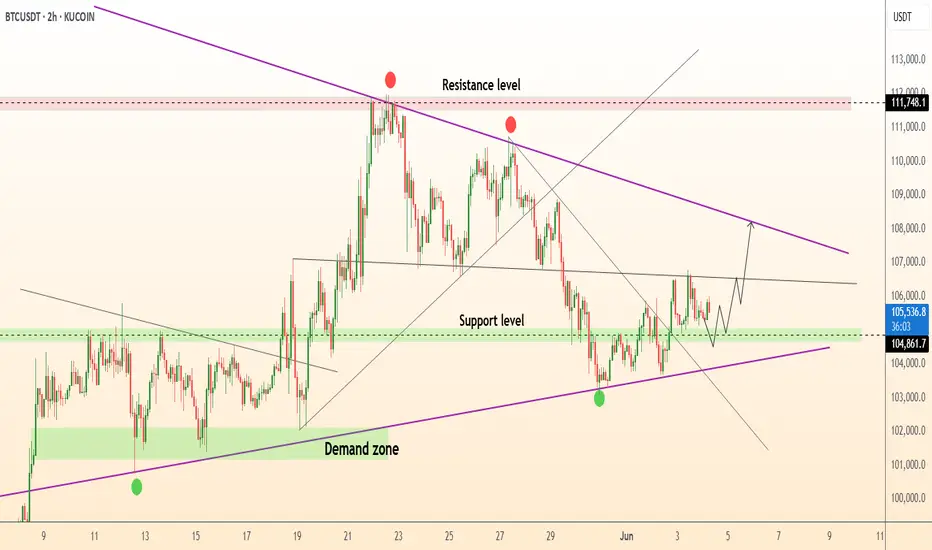
DeGRAM | BTCUSD rebound from the demand zone📊 Technical Analysis
● The BTCUSDT 4-hour chart on KUCOIN highlights a pronounced descending channel, with price action recently rebounding from a well-defined demand zone between 98,000 and 100,000. This green-shaded area has repeatedly acted as a springboard for bullish reversals, as evidenced by the strong wick and immediate recovery after the latest test. The chart also marks a series of lower highs and lower lows, but the most recent price action shows a break in bearish momentum, with a projected zigzag path indicating a potential move toward the 104,970 resistance. The confluence of the lower channel boundary and the demand zone suggests that buyers are stepping in aggressively at these levels, aiming for a retest of the upper resistance band.
● The technical setup is further reinforced by the presence of a major resistance level at 111,977, which has capped previous rallies. The chart’s structure, with its clear trendlines and highlighted resistance and support zones, points to a tactical opportunity for bulls to capitalize on the oversold conditions. The anticipated path, as drawn on the chart, suggests a gradual recovery with intermittent pullbacks, targeting the 104,970 area as the next significant hurdle. The overall pattern indicates that while the broader trend remains bearish, the immediate outlook favors a corrective rally from the current demand zone.
💡 Fundamental Analysis
● Recent fundamentals support the technical case for a short-term recovery. Over the past two days, Bitcoin has experienced heightened volatility due to escalating geopolitical tensions, notably US military action in the Middle East, which triggered a sharp sell-off and flushed out leveraged positions. Despite this, institutional accumulation remains robust, with over $1.2 billion in Bitcoin added to corporate treasuries in the last week, and Texas officially establishing a state-managed Bitcoin reserve. On-chain data shows sustained negative netflows from exchanges, indicating that large holders are moving coins to cold storage, a historically bullish signal. Meanwhile, derivatives data reveals a cautious market, with open interest skewed toward protective puts, but spot ETF inflows and long-term adoption trends continue to underpin the market.
✨ Summary
● BTCUSDT is rebounding from a key demand zone, with technicals pointing to a corrective move toward 104,970. The bullish scenario is supported by strong institutional accumulation and strategic adoption, even as short-term volatility persists. A sustained close above 104,970 would open the path to the 111,977 resistance, while a drop below 98,000 would invalidate the recovery thesis.
-------------------
Share your opinion in the comments and support the idea with a like. Thanks for your support!
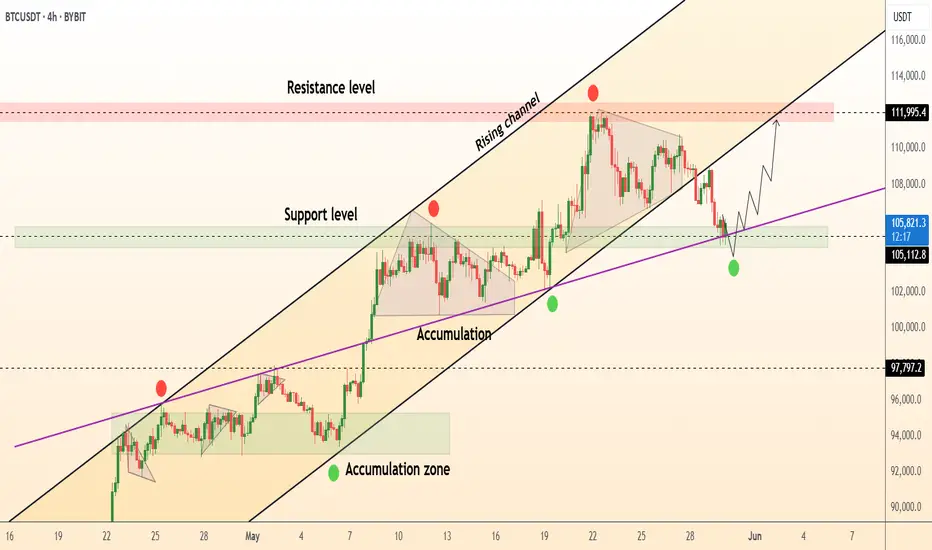
DeGRAM | BTCUSD formed the rising bottom📊 Technical Analysis
● BTC rebounded exactly at the purple long-term trend-line and green 102.5-104 k demand, reclaiming the 105-106 k support band; the old wedge cap is now acting as a floor.
● Price is coiling in a 16-h bull flag beneath 108 k; its 1.618 projection intersects the channel roof/ red supply at 111.6-115 k, while rising lows keep momentum pointed up.
💡 Fundamental Analysis
● U.S. spot-BTC ETFs attracted about $240 m of net subscriptions on 14 Jun, ending the outflow streak and signalling renewed institutional demand as exchange reserves slide to multi-year lows.
● Benchmark 10-yr Treasury yields are back under 4.45 %, easing dollar pressure and helping risk assets rebuild after the FOMC spike.
✨ Summary
Buy 105-106 k; flag breakout above 108 k targets 111.6 k → 115 k. Invalidate on a close below 101.8 k.
-------------------
Share your opinion in the comments and support the idea with a like. Thanks for your support!
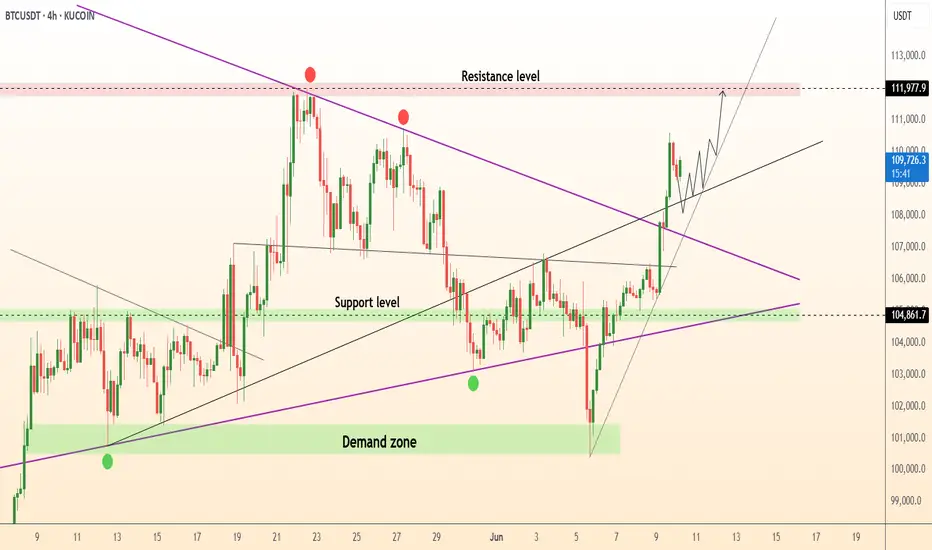
DeGRAM | BTCUSD correction from the 110k level📊 Technical Analysis
● Price has reclaimed the rising-channel median at ≈106.8 k and immediately made a higher-high on expanding volume; hourly RSI also pierced its two-week bear trend, flagging fresh upside energy.
● An ascending triangle is forming between 107 k support and a 109.5 k ceiling; its measured move coincides with the red supply/upper rail at 111.6-112 k.
💡 Fundamental Analysis
● Softer US PPI (-0.1 % m/m) dragged real 2-yr yields to one-month lows, easing dollar pressure, while spot-ETF desks soaked up another ≈4 600 BTC this week, signalling renewed institutional demand.
✨ Summary
Stay long above 107 k; triangle break over 109.5 k unlocks 111.6 k then 115 k. Long view invalidated on a 4 h close beneath 103 k.
-------------------
Share your opinion in the comments and support the idea with a like. Thanks for your support!

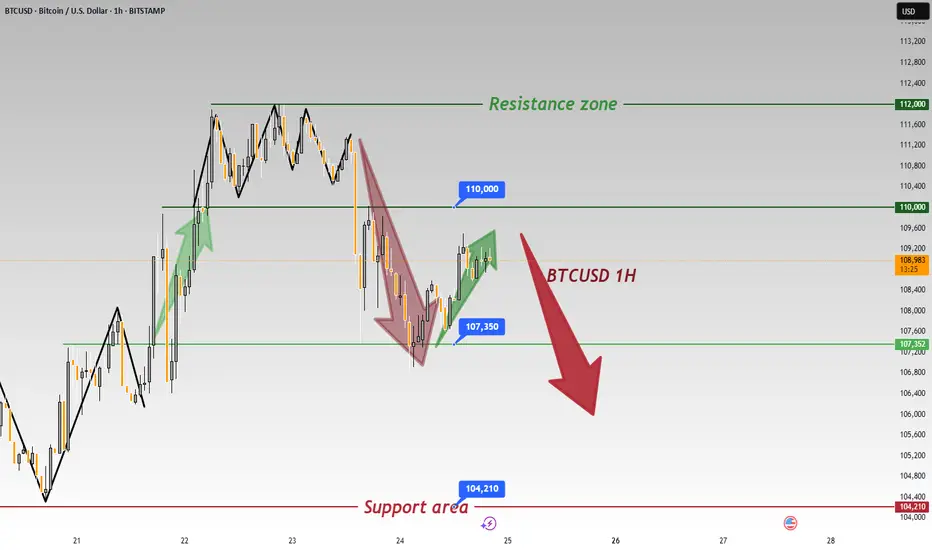
Analysis of the Current BTCUSD Trend and Trading RecommendationsFrom a technical perspective, the bearish trend in BTC is temporarily dominant. On the four-hour chart, the price has trended downward with consecutive negative candles after being pressured, clearly indicating a bearish trend. Although small lower shadows suggest that bulls and bears are still locked in a tug-of-war, the RSI indicator is near the overbought zone at 70, and while the MACD remains positive, its momentum continues to weaken—both signals imply insufficient upward momentum and lingering adjustment pressure.
On the hourly chart, BTC has entered a consolidation phase with alternating positive and negative candles after a unilateral downward move. Currently, the Bollinger Bands are narrowing and moving sideways, indicating that future volatility may be limited. The price is now hovering near the upper band of the range, facing technical resistance.
In terms of the afternoon trading strategy, given the bearish dominance and fading upward momentum, the focus should remain on shorting at highs. Aggressive traders can lightly position for short-term rebounds but must use small positions and set strict stop-losses; prudent traders should wait patiently for higher levels to initiate short positions.
BTCUSD
sell@109800-110300
tp:108500-107500
Investment itself is not the source of risk; it is only when investment behavior escapes rational control that risks lie in wait. In the trading process, always bear in mind that restraining impulsiveness is the primary criterion for success. I share trading signals daily, and all signals have been accurate without error for a full month. Regardless of your past profits or losses, with my assistance, you have the hope to achieve a breakthrough in your investment.
DeGRAM | BTCUSD fixed above the downtrend line📊 Technical Analysis
● Bulls pierced the descending purple trend-line and closed two candles above the 106 k pivot, confirming a pennant breakout and resetting higher-lows along the black mid-channel.
● Re-test of 104.8 k demand (green band) held as support; the new up-sloping flag projects to the 111.8 k-112 k red supply at the channel roof, with dynamic backup now rising to 103.8 k.
💡 Fundamental Analysis
● U.S. CPI whispers point to a softer June headline while spot-ETF cohort added another 3 200 BTC in two sessions and exchange reserves keep declining, underscoring supply squeeze amid easing rate fears.
✨ Summary
Long 104.8-106 k; sustained trade >107 k targets 111.8 k → 115 k. Bull thesis void on a 4 h close below 99 k.
-------------------
Share your opinion in the comments and support the idea with a like. Thanks for your support!
DeGRAM | BTCUSD held the $100k level📊 Technical Analysis
● Bounce from 99.8-100 k confluence (violet trend-line + former wedge top + horizontal demand) confirms the zone as fresh support.
● Price coils in a tight pennant under 106 k; 1.618 target of the pattern meets the rising-channel roof and red supply at 111-112 k, while RSI prints higher lows, flagging hidden bullish momentum.
💡 Fundamental Analysis
● CME futures basis widened above 10 % annualised as softer US claims cooled dollar bids, boosting carry appetite; meanwhile, on-chain reserves keep shrinking, hinting at supply squeeze.
✨ Summary
Buy 100-103 k; pennant break >106 k aims 111 k → 115 k. Bull view void on an H16 close below 99 k.
-------------------
Share your opinion in the comments and support the idea with a like. Thanks for your support!
DeGRAM | BTCUSD retesting the $105k📊 Technical Analysis
● Triple bounce at 104.8 k-105 k and the violet trend-line created fresh higher-lows while keeping price above the May demand block.
● A two-week falling trend-line has just been cleared and retested, unlocking the next pivot at 108 k; flag depth from 105 k projects to the 111.7 k supply/upper channel rail.
💡 Fundamental Analysis
● FXStreet highlights US job openings at a 3-yr low, pressuring yields, while CoinShares tracks another $450 m spot-ETF inflow and exchange balances at a 4-yr trough, signalling a tightening float.
✨ Summary
Buy 104.8-106 k; clearance of 107 k aims for 111 k, stretch 115 k. Long thesis void on a 2 h close < 103 k.
-------------------
Share your opinion in the comments and support the idea with a like. Thanks for your support!
DeGRAM | BTCUSD fixed above the $104,000 level📊 Technical Analysis
● Bulls twice defended the 103-105 k demand and purple trend-line, turning the zone into a springboard; price also reclaimed the inner grey trend-median, preserving higher-lows in the 7-week rising channel.
● A fresh ascending triangle is coiling under 111 k; pattern height projects to the red 112-115 k supply/channel roof once 111 k gives way, while invalidation rises with the trend-line at 103 k.
💡 Fundamental Analysis
● CoinShares reports a third straight week of spot-ETF inflows (+US$1 bn) and the BTC exchange reserve just printed a new 3-year low, signalling supply squeeze. Meanwhile, ISM manufacturing slipped back below 50, cooling U.S. yields and the DXY and reviving crypto appetite.
✨ Summary
Long 104-106 k; triangle break >111 k targets 112 k → 115 k. Bull view void on a 16 h close beneath 103 k.

DeGRAM | BTCUSD reached the strong trend line📊 Technical Analysis
● Bulls defended 105 k again: a bullish inside-bar formed on the green demand band and purple trend-line, keeping price glued to the rising-channel median.
● 4 h RSI reset to mid-40s while OBV held flat, signalling dip absorption; pattern projects a swing back to the channel roof/-red supply near 112-115 k if 111 k neckline is cleared.
💡 Fundamental Analysis
● The Coinbase premium flipped positive for the first time in two weeks, reflecting fresh US spot buying just as soft Chicago PMI dragged the DXY lower, easing macro head-winds.
✨ Summary
Buy 105-108 k dips; break above 111 k eyes 112 k then 115 k. Trend intact while price closes above 104 k.
-------------------
Share your opinion in the comments and support the idea with a like. Thanks for your support!
DeGRAM | BTCUSD continues to move in the channel📊 Technical Analysis
● 108.7-109 k has held for the fourth time, flipping the purple retest line into solid support; each bounce prints a higher low, sketching a rising triangle inside the medium-term channel.
● A 6 h close above the triangle cap at 111.2 k should unleash a measured 13 k thrust toward the channel’s roof / red supply at ≈122 k.
💡 Fundamental Analysis
● Glassnode shows another 24 k BTC left exchanges in May while US spot ETFs recorded five consecutive inflow days, tightening tradable supply even as macro volatility fades.
✨ Summary
Buy 108-110 k; breakout >111.2 k targets 115 k → 122 k. Invalidate on a 6 h close below 105 k.
-------------------
Share your opinion in the comments and support the idea with a like. Thanks for your support!

DeGRAM | BTCUSD held the $ 107k level📊 Technical Analysis
● After clearing the Feb-Apr supply (105.7 k-108 k), price has twice retested it as support, printing successive higher-low wicks and locking the purple trend-line as a launch pad.
● The advance is tracking the mid-line of a rising channel; the swing structure sketches a fresh ascending triangle whose projection aligns with the red 114–115 k ceiling at the channel roof.
💡 Fundamental Analysis
● BTC spot ETFs absorbed another ≈4 600 BTC this week while CME open-interest hit a 6-week high, signalling renewed institutional accumulation despite softer US data and a retreating DXY.
✨ Summary
Buy 106-109 k on pull-backs; triangle break above 111.5 k targets 114 k then 115 k. Bull view invalidated on a daily close beneath 105 k.
-------------------
Share your opinion in the comments and support the idea with a like. Thanks for your support!

Gold Surges, Euro Plunges, BTC at RiskOn May 23rd's U.S. session, Trump's EU/Apple tariff plans sparked market chaos:
Gold surged 💥 as a safe haven.
The euro plunged on EU tariff fears.
If tariffs persist, capital may flood into gold/forex, likely triggering a BTC crash.
⚡⚡⚡ BTCUSD ⚡⚡⚡
🚀 Sell@109500 - 108500
🚀 T P 106500 - 104500
👇Accurate signals are updated every day 📈 If you encounter any problems during trading, these signals can serve as your reliable guide 🧭 Feel free to refer to them! I sincerely hope they'll be of great help to you 👇
DeGRAM | BTCUSD new ATH📊 Technical Analysis
● Daily candle has closed above 108 250 $ – the February swing cap – completing an 8-week ascending triangle inside the rising channel and confirming fresh trend-acceleration.
● Momentum push has opened clear air to the red 112 000 $ supply / channel roof; former breakout line at 105 400 $ now acts as layered support together with the purple guideline.
💡 Fundamental Analysis
● Spot-ETF cohort (IBIT, FBTC, ARKB) logged a three-day net inflow >5 000 BTC while exchange reserves printed a new 3-year low (CryptoQuant), pointing to tightening tradable supply.
● DXY pulled back after FOMC minutes showed no appetite for further hikes, tempering real-yield gains and reviving crypto bid.
✨ Summary
Buy dips 106-108 k; upside window targets 112 k, stretch 115 k. Bull bias void only on a daily close beneath 100.7 k.
-------------------
Share your opinion in the comments and support the idea with a like. Thanks for your support!

DeGRAM | BTCUSD holding $104K📊 Technical Analysis
● BTC again defended the 104 k-104.3 k flip-zone and long-term purple trend-line, printing a fourth higher-low inside the 7-month rising channel.
● Price is coiling in a tight bullish pennant beneath April’s high; a breakout aligns with the channel ceiling and projects toward the 112.5 k supply band.
💡 Fundamental Analysis
● CME BTC-futures open-interest hit a record this week, while Glassnode shows exchange reserves at a 6-year low—evidence of both leveraged and spot accumulation supporting upside continuation.
✨ Summary
Higher-low + record OI favour longs: accumulate 104-105 k, objectives 108 k ➜ 112.5 k, risk controlled on a close below 100.6 k.
-------------------
Share your opinion in the comments and support the idea with a like. Thanks for your support!
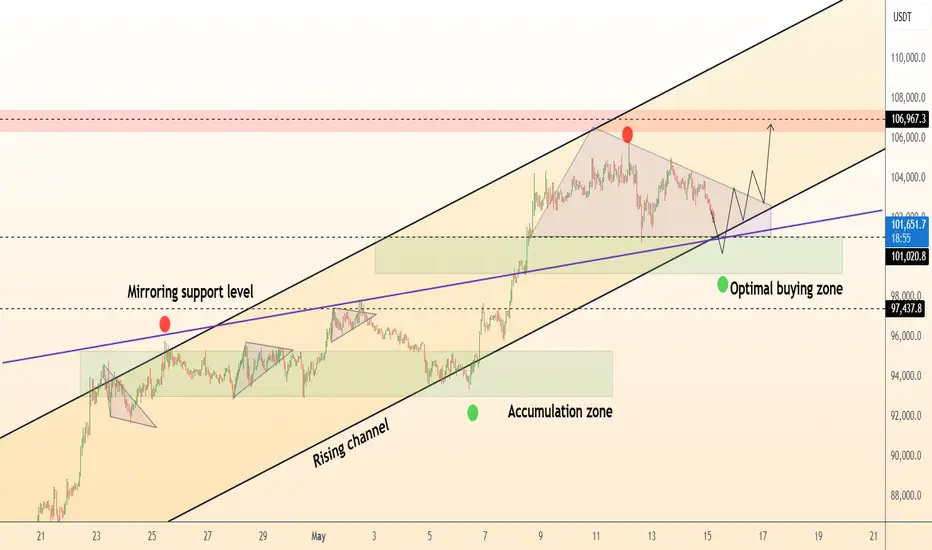
DeGRAM | BTCUSD formed the triangle📊 Technical Analysis
● Pullback has tagged the purple mirroring-support / channel median (≈101 K) and printed a hammer inside the green “optimal-buy” box, preserving the sequence of higher lows since 25 Apr.
● Price is coiling in a bull-flag beneath the inner resistance band 104 K; a 1 h close above it activates a measured move to the red 106.9-109 K supply at the channel roof.
💡 Fundamental Analysis
● BlackRock’s IBIT added a net ≈2 900 BTC in two sessions while exchange balances hit a 3-year low (CryptoQuant), signalling renewed spot absorption.
● US 2-yr yield slipped back under 4.70 % after softer Philly-Fed survey, tempering the dollar bid and easing funding costs for crypto leverage.
✨ Summary
Buy dips 101-102 K; confirmation > 104 K targets 106.9 K → 109 K. Invalidate on a sustained break below 97.5 K.
-------------------
Share your opinion in the comments and support the idea with a like. Thanks for your support!