BTCUSD ShortBitcoin (BTC) is recognised as the world’s first truly digitalised digital currency (also known as a cryptocurrency). The Bitcoin price is prone to volatile swings; making it historically popular for traders to speculate on. Follow the live Bitcoin price using the real-time chart, and read the latest Bitcoin news and forecasts to plan your trades using fundamental and technical analysis
Bitcoin Price (BTC) Real-Time Live Price
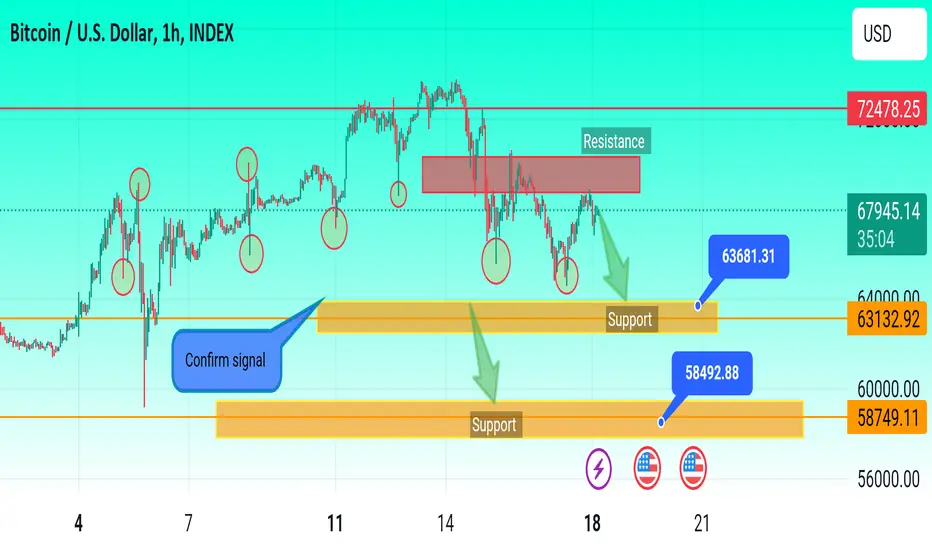
Bitcoin continues to press higher, making fresh all-time highs in the process. The largest cryptocurrency by market capitalization is up just over 92% since the January 23 swing low ($38.55k), with the move higher driven by ongoing spot ETF buying. Blackrock, the world’s largest asset manager, now holds approximately 204k Bitcoin – current value $14.97 billion – despite their spot ETF being less than two months old. This holding is just behind MicroStrategy’s Michael Saylor who currently holds 205k BTC at an average cost price of around $33.7k. confirm chart
Btcusdsignal

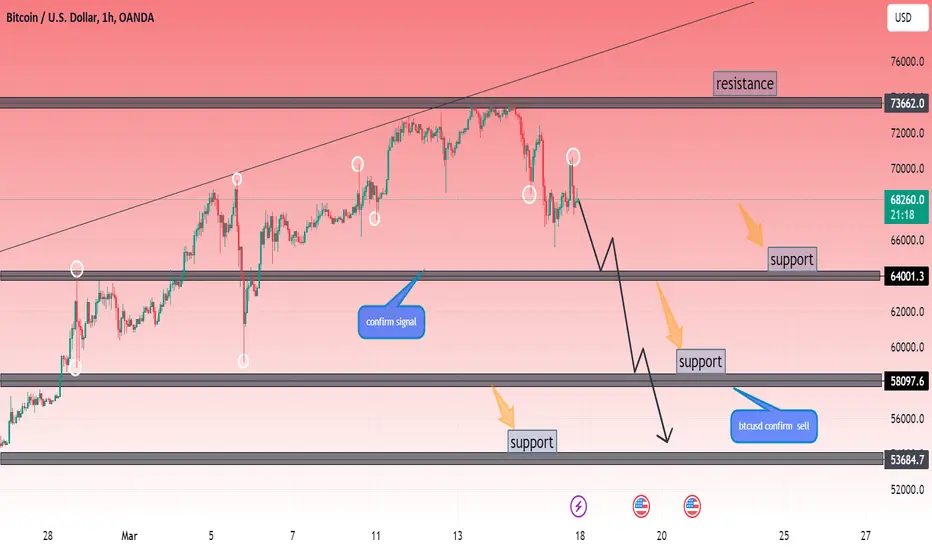
Btcusd sell confirm signal Bitcoin Price (BTC) Real-Time Live Price
Bitcoin (BTC) is recognised as the world’s first truly digitalised digital currency (also known as a cryptocurrency). The Bitcoin price is prone to volatile swings; making it historically popular for traders to speculate on. Follow the live Bitcoin price using the real-time chart, and read the latest Bitcoin news and forecasts to plan your trades using fundamental and technical analysis.
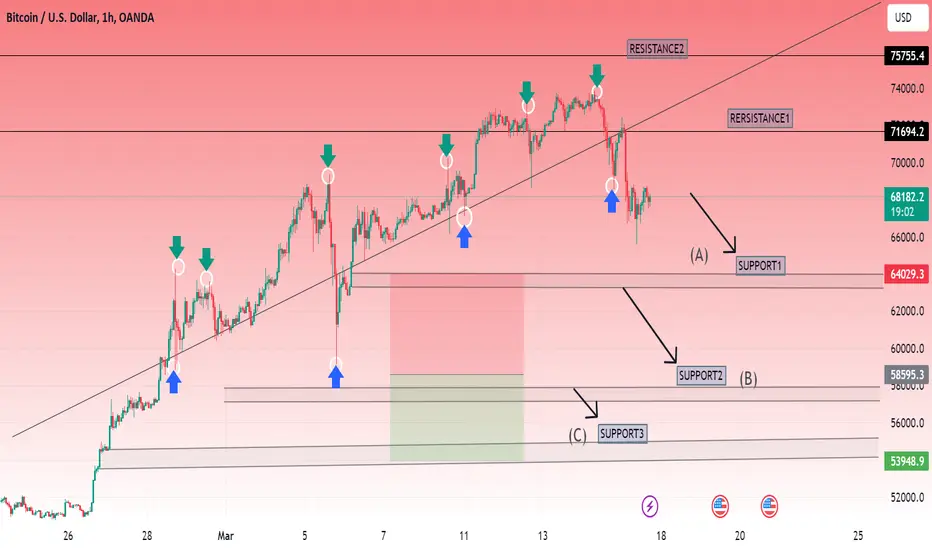
Confirm btcusd sell signal
btcusd sell shortBitcoin (BTC) is recognised as the world’s first truly digitalised digital currency (also known as a cryptocurrency). The Bitcoin price is prone to volatile swings; making it historically popular for traders to speculate on. Follow the live Bitcoin price using the real-time chart, and read the latest Bitcoin news and forecasts to plan your trades using fundamental and technical analysis.
Bitcoin (BTC) price shows a slowdown in momentum as it set up a new all-time high of $73,949 on March 13. Considering the massive uptrend that BTC has been experiencing, a short-term correction is nothing to be concerned about.
BTCUSD LONG Bitcoin (BTC) is recognised as the world’s first truly digitalised digital currency (also known as a cryptocurrency). The Bitcoin price is prone to volatile swings; making it historically popular for traders to speculate on. Follow the live Bitcoin price using the real-time chart, and read the latest Bitcoin news and forecasts to plan your trades using fundamental and technical analysis.
confirm btcusd signal SELL
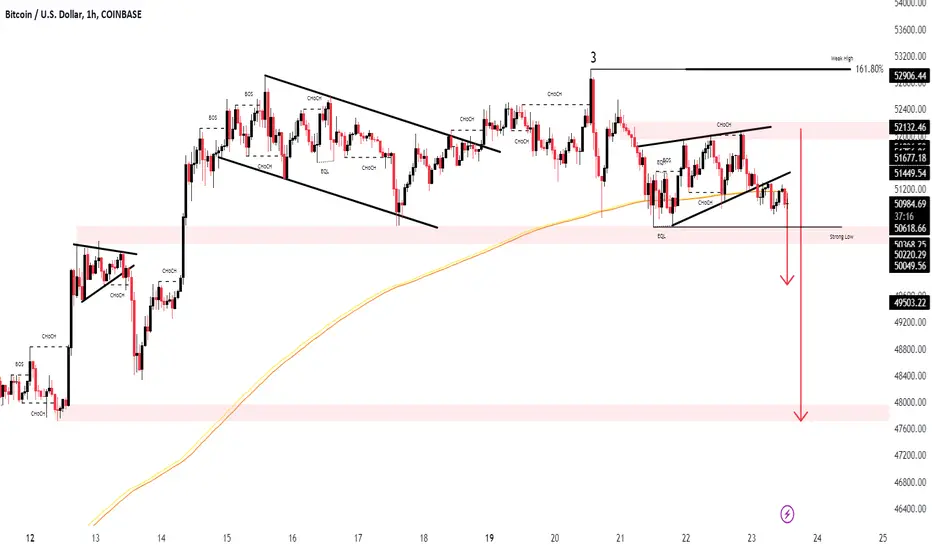
BTCUSDPair : BTCUSD ( Bitcoin / U.S Dollar )
Description :
Completed " 123 " Impulsive Waves
Rejection from Fibonacci Level - 161.8% and Daily Resistance Level
Break of Structure
Rising Wedge as an Corrective Pattern in Short Time Frame with the Breakout of Lower Trend Line and Retracement
BTC/USDT - Take a breath, correct to $37.500 and continue !?We are looking at the allmighty king.
- Pretty strong runup
- RSI overbought
- Hanging man Candle on the 8D (!)
- Support as resistance on $ 37.500
Permabears will shout $ 31.000 and Permabulls will aim for $ 48.000.
Me? Eh, not very sure to be honest. But looking at the chart right now, I would be careful.
I would not enter a BTC position here. Too risky.
Hanging man printed. I hope I am wrong, but I expect a "take breath" moment for BTC.
Hopefully BTC.D will drop harder, giving some room for alts to pump and increase the alt coin dominance.

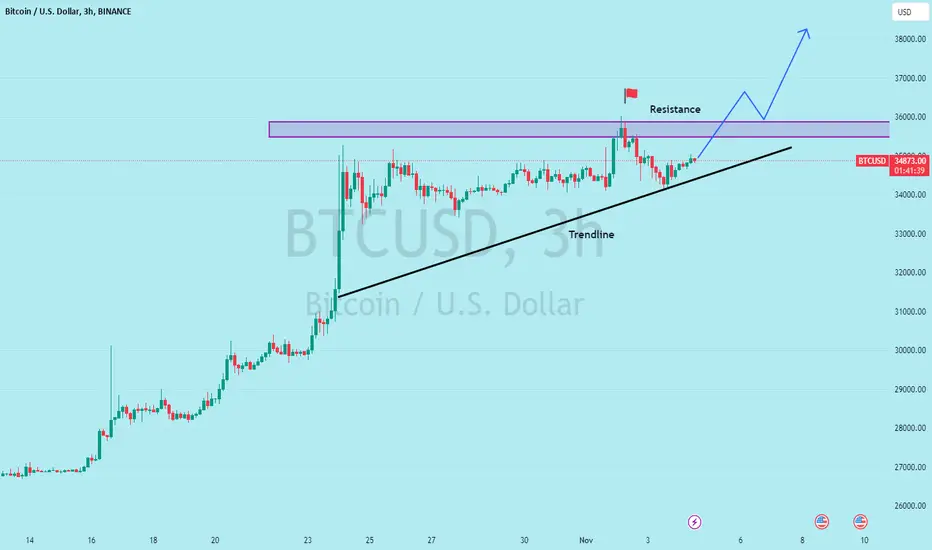
BTCUSD Possible further upside!The electronics market is persistently declining, currently at approximately $34,400. Based on the 3-hour chart analysis, the trend line is seen as a strong support level that could drive prices upward in the near future. The immediate hurdle lies at $35,382, and surpassing this resistance is anticipated to bolster Bitcoin (BTC) for further valuation increases.
What are your opinions regarding this analysis? Do you concur?
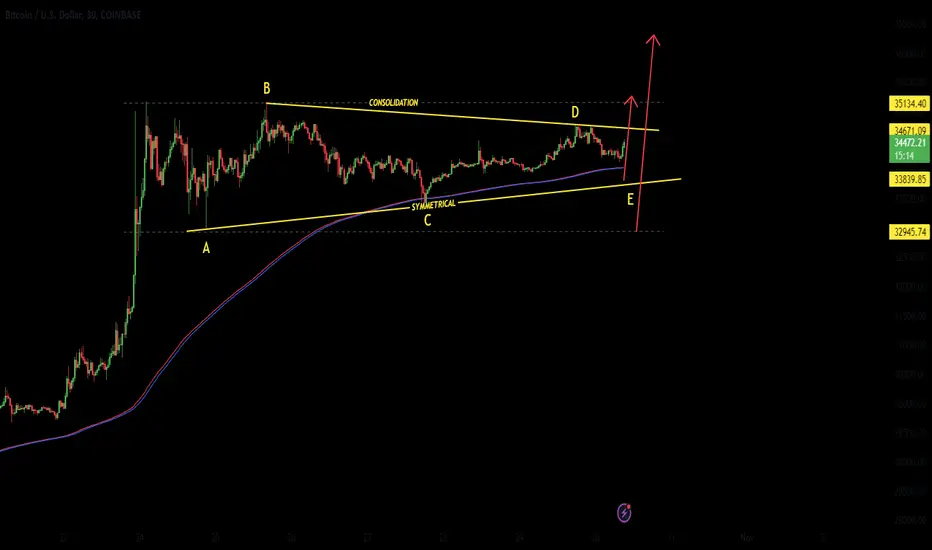
BTCUSD 30/10 Pair : BTCUSD ( Bitcoin / U.S Dollar )
Description :
Consolidation Phase as an Corrective Pattern in Long Time Frame. Completed " ABCD " Corrective Waves. It will Reject from the Lower Trend Line of the Corrective Pattern " Symmetrical Triangle " in Short Time Frame or from LTL of Consolidation
Entry Precaution :
Wait until it gives Strong Bullish Price Action Rejection
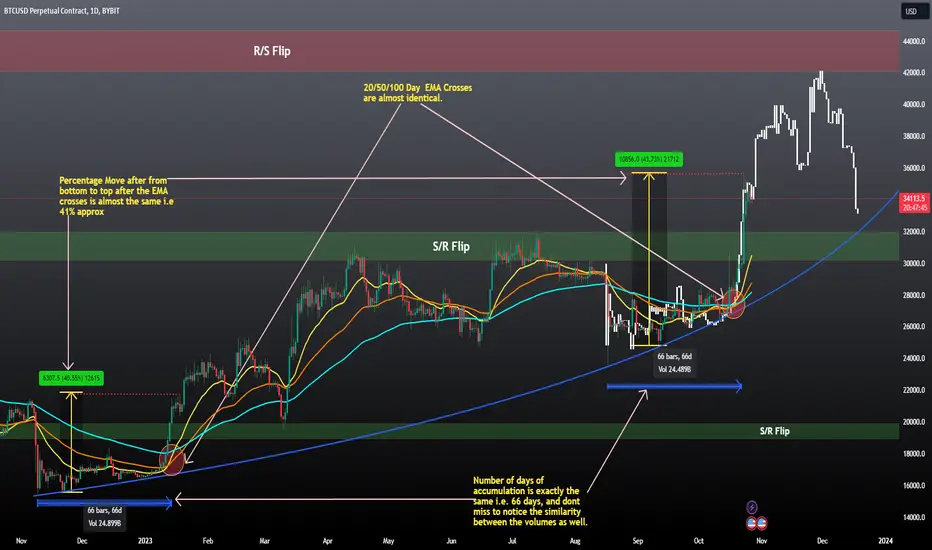
Macro BTC pattern shows path to 42-44K then 32KThe chart is self-explanatory. All I have done is taken the Bar Patterns at the 15K lows and matched them with the lows at 25K, there are astonishing similarities. Go ahead and have a look at all the similarities I have highlighted.
This pattern suggests, we should soon have a pump to 39K region, then a dump to 34K region followed by a pump to 42 to 44K region and then a large dump to 32K region.
The dump to 32K would be akin to dump at 19.5K from 25K and then 32K region could act a strong S/R flip to push the btc price to new highs.
It's possible that this may not repeat exactly like before, but when there are so many similarities, we should pay attention.
This is not at all surprising to me, Infact I have been targeting 40K from past 8 to 9 months while most traders were bearish and calling for severe downside.
I also call the 15K bottom Macro bottom when others were expecting more downside.
I am again saying 25K is a major bottom in the BTC cycle.
I have added links to those posts where you can find details about the above claims.
Note: Even though patterns tend to repeat on macro timeframes, there is no guarantee that they will, all these similarities can go out the window. I personally will start taking this pattern seriously if we Pump to 39K region withing next 5 to 7 days, which is what we can see from the BAR feed copied from 15K region.
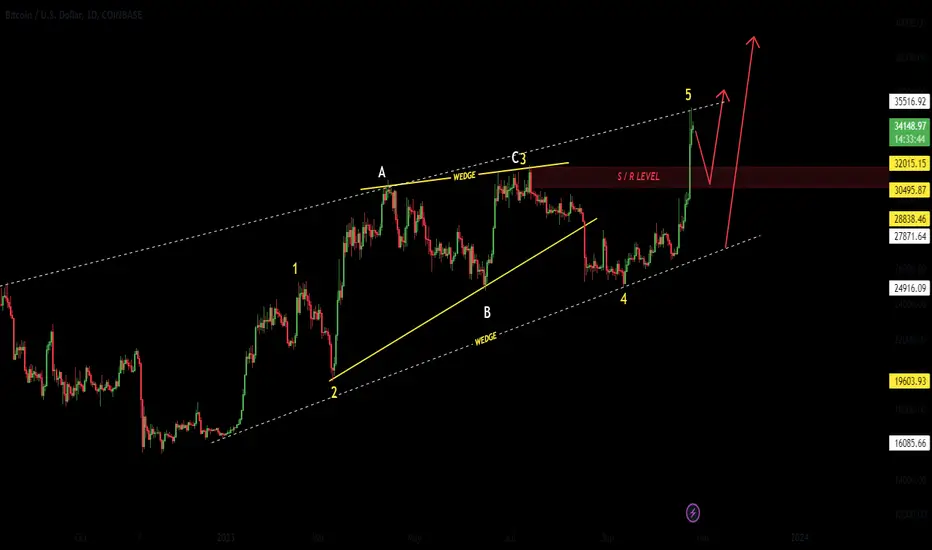
Bitcoin 25/10 MovePair : BTCUSD ( Bitcoin / U.S Dollar )
Description :
Completed " 12345 " Impulsive Waves. If it Rejects from the Upper Trend Line of the Corrective Pattern " Rising Wedge " in Long Time Frame then It will Completed the Retracement for the Break of Structure and " A " Corrective Wave
Entry Precaution :
Wait for the Proper Trend Reversal / Rejected Price Actions
BTCUSD 13/10 MovePair : BTCUSD ( Bitcoin / U.S Dollar )
Description :
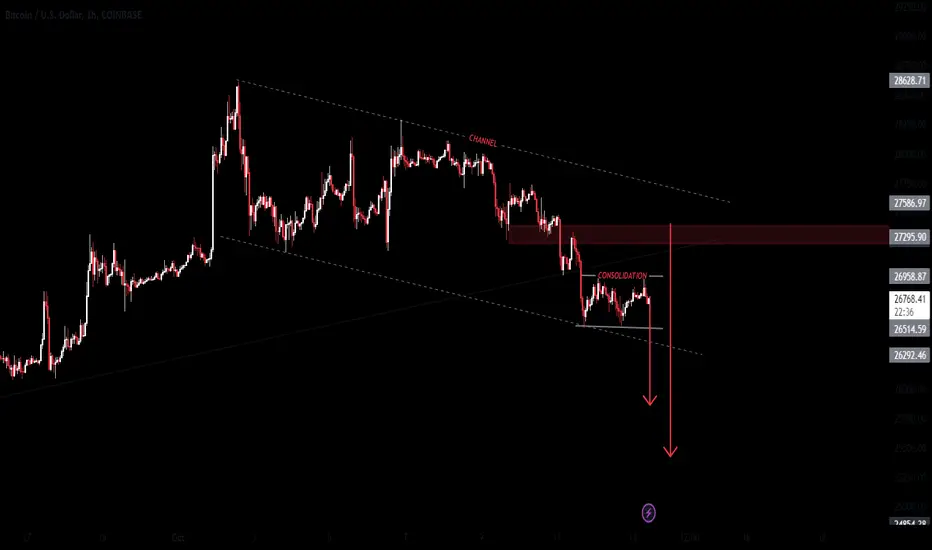
Bearish Channel in Long Time Frame and Rejection from the Lower Trend Line and making Consolidation Phase in Short Time Frame if it Breaks Upper Trend Line then it can Reach its Previous Support or Upper Trend Line of Channel
Entry Precautions :
Wait until it Breaks UTL or LTL
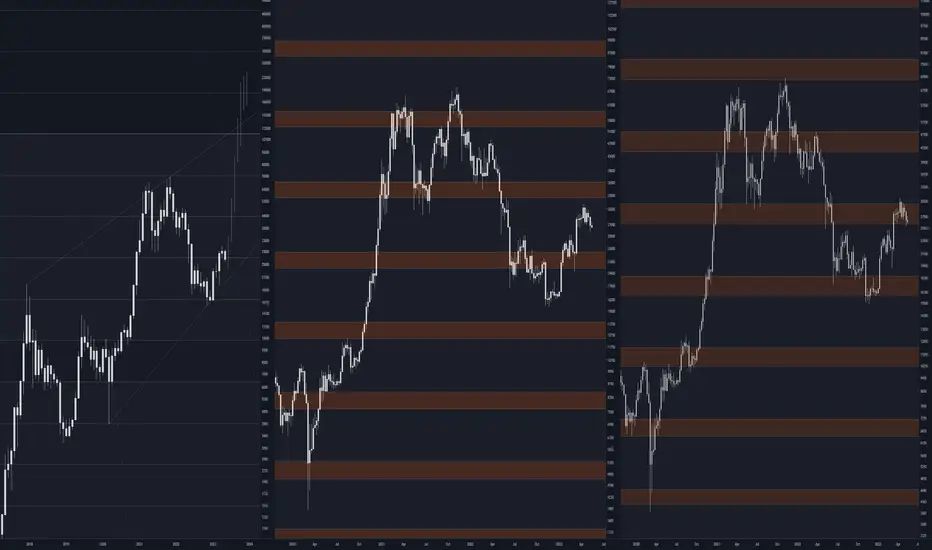
Bitcoin's Climb to $250K: Fib Clusters and Halving MathematicsThis investment strategy spotlights an ambitious yet plausible pathway for Bitcoin to reach $250K - a staggering 733% rise from its current standing at $30K . The core elements are Fibonacci clustering and halving mathematics . By taking a grounded, data-driven approach, we aim to obtain comprehensive insights into Bitcoin's potential for substantial growth.
The space between all boxes is (0.618) percent.
BTCUSD 16-08 Next MovePair : BTCUSD ( Bitcoin / U.S Dollar )
Description :
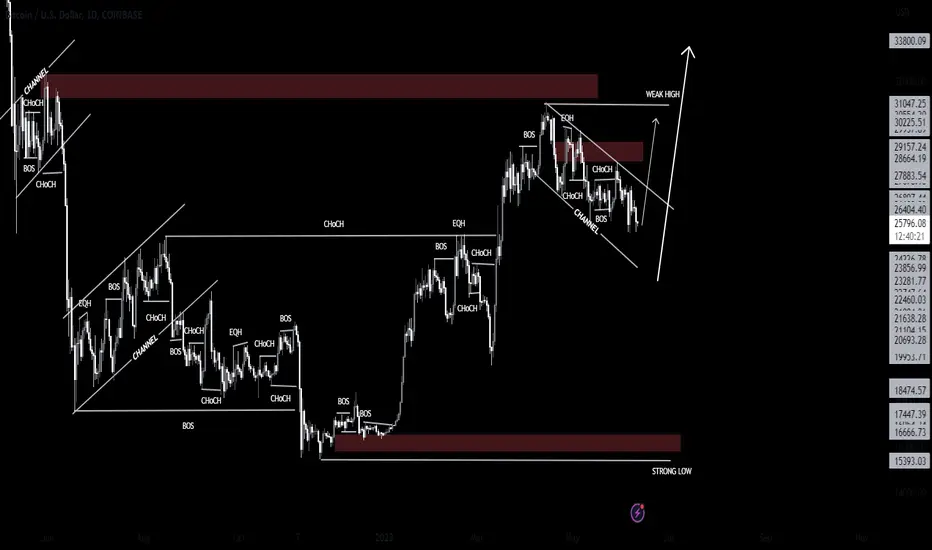
Bullish Channel in STF as an Corrective Pattern
Support Level
Impulse Correction
Break of Structure
Consolidation Phase

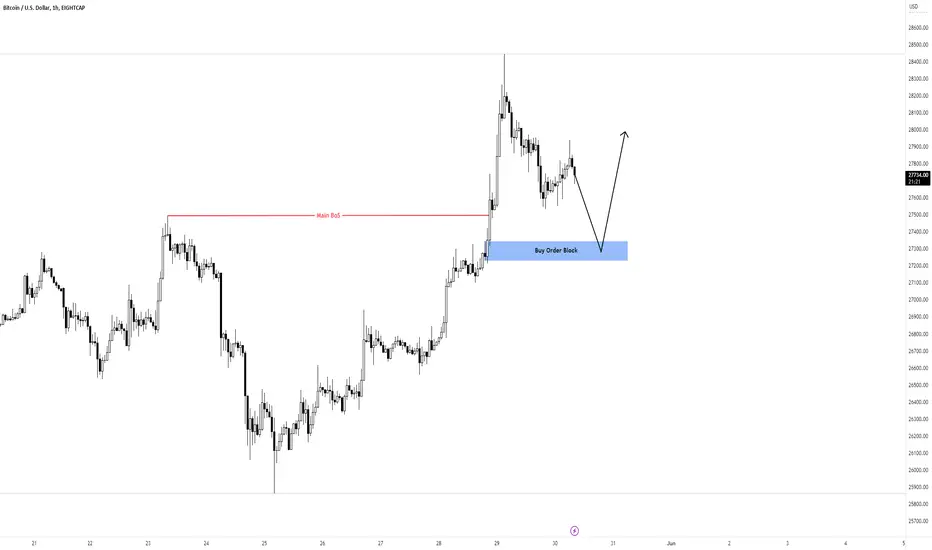
Bitcoin Analysis H1Here is my analysis for BTCUSD on H1 using Order Block. The price could go bullish, you can put a pending order on the Order block or find an entry on LTF within OB Zone. Trade Safe!

BTCUSD Bitcoin Next Possible MovePair : BTCUSD ( Bitcoin / U.S Dollar )
Description :
Consolidation Phase with the Breakout of LTL
Divergence
S / R Level
Symmetrical
Fibonacci level - 38.20%

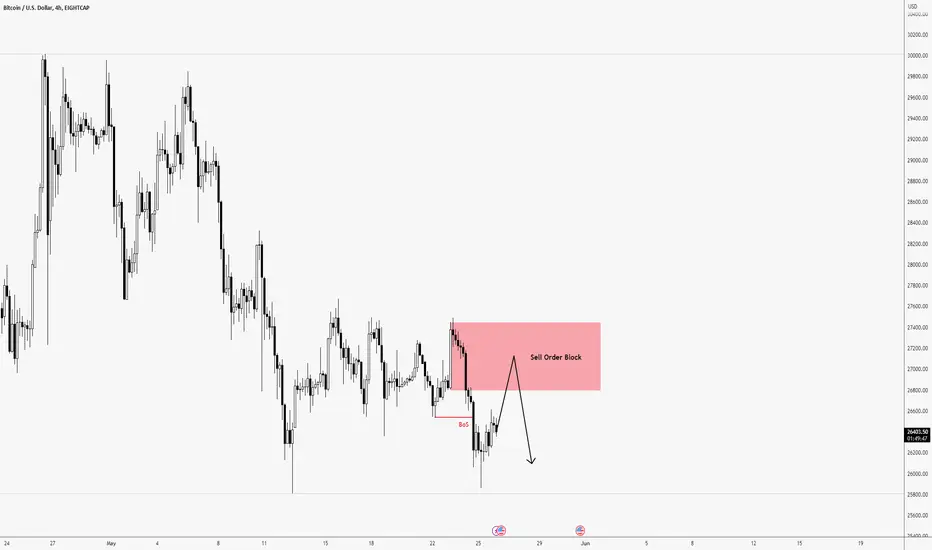
BTCUSD Analysis H4Here is my analysis for BTCUSD on H4 by Order Block. The price could go bearish, you can put a pending order on the Order block or find an entry on LTF within OB Zone. Trade Safe!

Bitcoin Next Possible MovePair : BTCUSD ( Bitcoin / U.S Dollar )
Description :
Bearish Channel in STF as an Corrective Pattern
Divergence - RSI
Completed " ABC " Corrective Wave
Consolidation Phase
Break of Structure
Fibonacci Levels
S / R Level
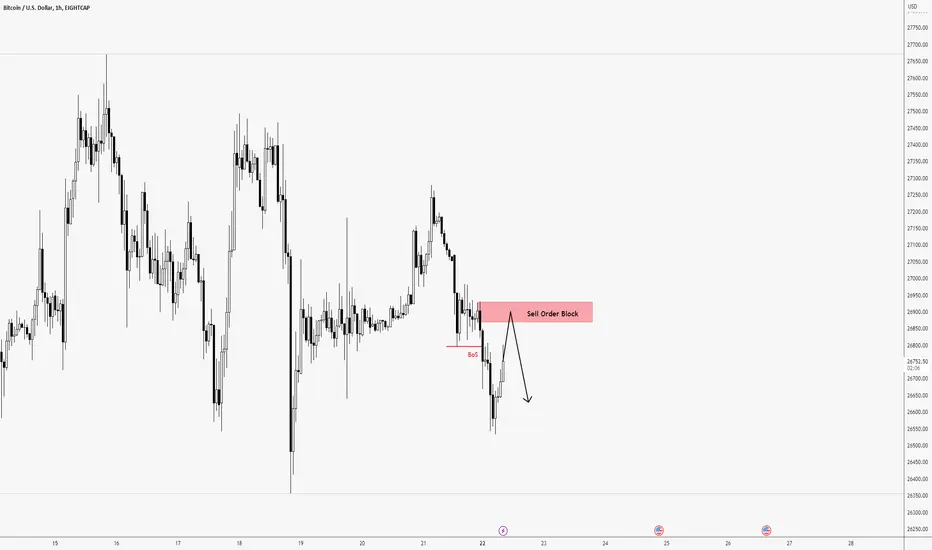
BTCUSD Live Chart H1Here is my view for BTCUSD on H1. The price could go bearish, you can put a pending order on the Order block or find an entry on LTF within OB Zone. Trade Safe!
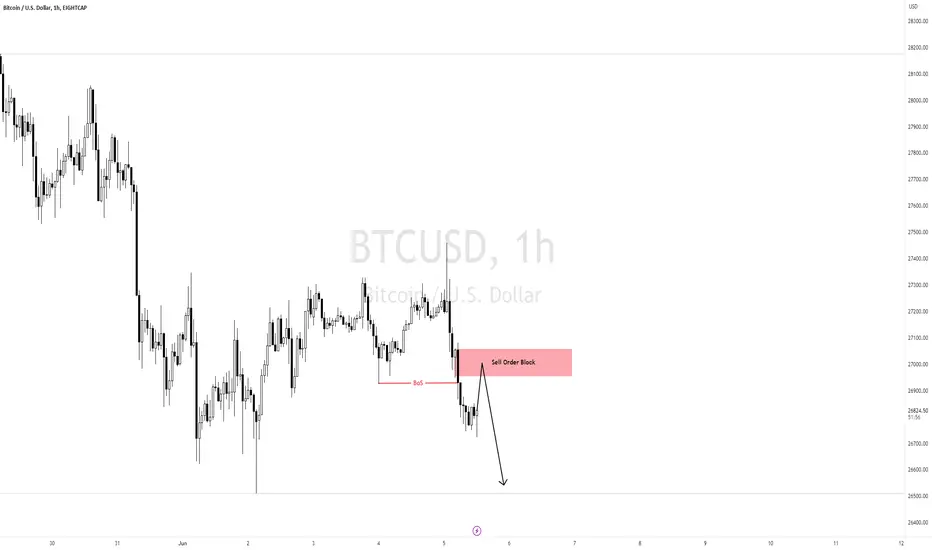
BTCUSD Live Chart H1Here is myv iew for BTCUSD on H1. The price could go bearish, you can put a pending order on the Order block or find an entry on LTF within OB Zone. Trade Safe!

BTCUSD Live Chart H1Here is my view for BTCUSD on H1. The price could go bullish, you can put a pending order on the Order block or find an entry on LTF within OB Zone. Trade Safe!
BTCUSD Live Chart H4Here is my view for BTCUSD on H4. The price could go bearish, you can put a pending order on the Order block or find an entry on LTF within OB Zone. Trade Safe!
BTCUSD Live Chart H1Here is my view for BTCUSD on H1. The price could go bearish, you can put a pending order on the Order block or find an entry on LTF within OB Zone. Trade Safe!
Bitcoin Next Week Possible MovePair : BTCUSD ( Bitcoin / U.S Dollar )
Description :
Completed " ABC " Correction
Impulse Correction Impulse
Symmetrical Triangle
SMC - CHOCH
Break of Structure
Bearish Channel as an Corrective Pattern in Long Time Frame and Rejection from the Lower Trend Line
Impulsive " wxyx " Wave will Completed its " z " at Daily S / R Level
