Bitcoin- rise to at least 85kBitcoin's price action has been pretty boring in recent days. In fact, for the past three months, BTC/USD has been stuck in a range.
However, as I mentioned in my previous analysis, bulls have held very well above the important 67k support level.
At the time of writing, the price is 71k, once more facing the established resistance.
A break of this level is expected, and a rise of at least 20% should follow afterward.
I remain bullish as long as the price stays above 67k.
Btcusdsignals
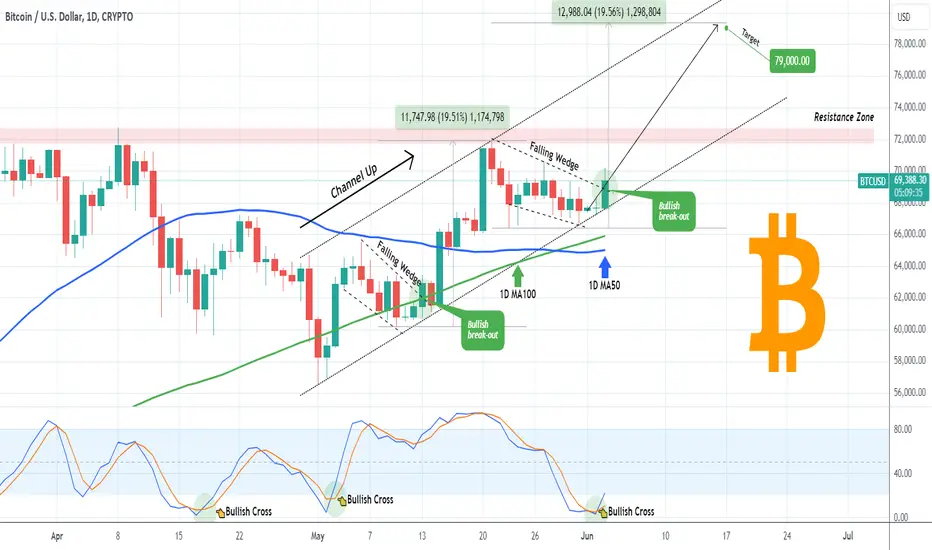
BITCOIN You might not be ready for such June!Bitcoin (BTCUSD) is doing it and yet again it is going under the radar for some. The price broke out yesterday from its short-term Falling Wedge and as we showed you is extending the Bullish Leg of the Channel Up.
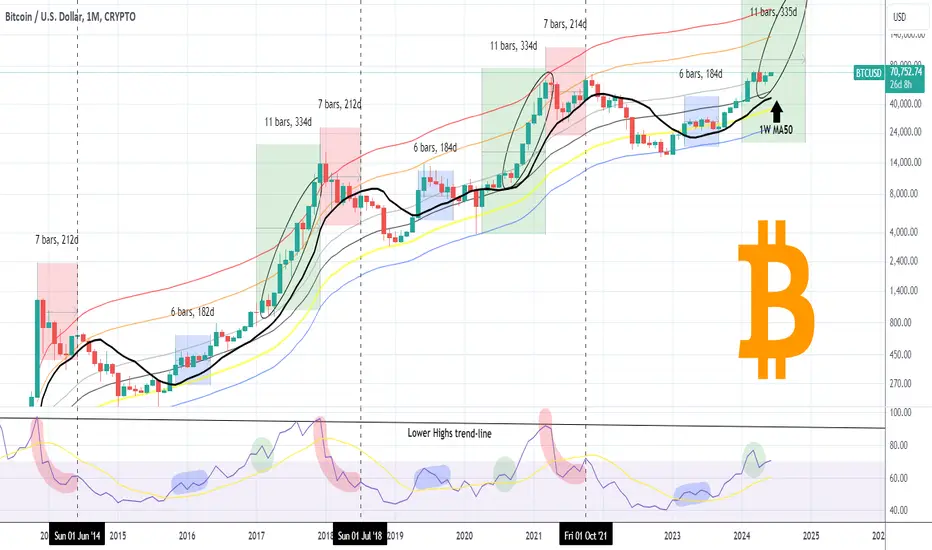
Zooming out to the 1M time-frame, we can see that May closed in gains (green) and since August 2023, there has only been one month of losses (red 1M candle) and that was April. Even though that injected some uncertainty to market participants, we clearly see on this long-term chart that sporadic 1 month losses are very common in Bull Cycles, especially during parabolic rallies.
In fact they are essential as they create the right shake-out conditions to keep fueling the rally. The symmetry among BTC's Cycles is remarkable and right now with the 1W MA50 (black trend-line) in deep support, it is attempting to get detached from the Mayer Multiple (MM) 1 SD above (grey trend-line), much like it did on October 2020 and April 2017.
Based on that, we are looking for the rally to extend to at least the end of the year and reach a Target Zone within $150k - $200k within MM 2 and 3 SD above (orange the red trend-lines respectively). Last but not least, take a look at the 1M RSI, which is also on a symmetry with the previous Cycles and once it touches the Lower Highs trend-line, we should consider to start taking profits regardless of whether of the range the price might be at the time.
But what do you think? Are you prepared for a 'hot' June and if yes, how high do you think BTC will go? Feel free to let us know in the comments section below!
-------------------------------------------------------------------------------
** Please LIKE 👍, FOLLOW ✅, SHARE 🙌 and COMMENT ✍ if you enjoy this idea! Also share your ideas and charts in the comments section below! This is best way to keep it relevant, support us, keep the content here free and allow the idea to reach as many people as possible. **
-------------------------------------------------------------------------------
💸💸💸💸💸💸
👇 👇 👇 👇 👇 👇
BTCUSD 1DBTC ~ Updated
#BTC The bulls continue to maintain their dominance. it's just a matter of time. The highest price will soon be formed. Our short term target is $80,000
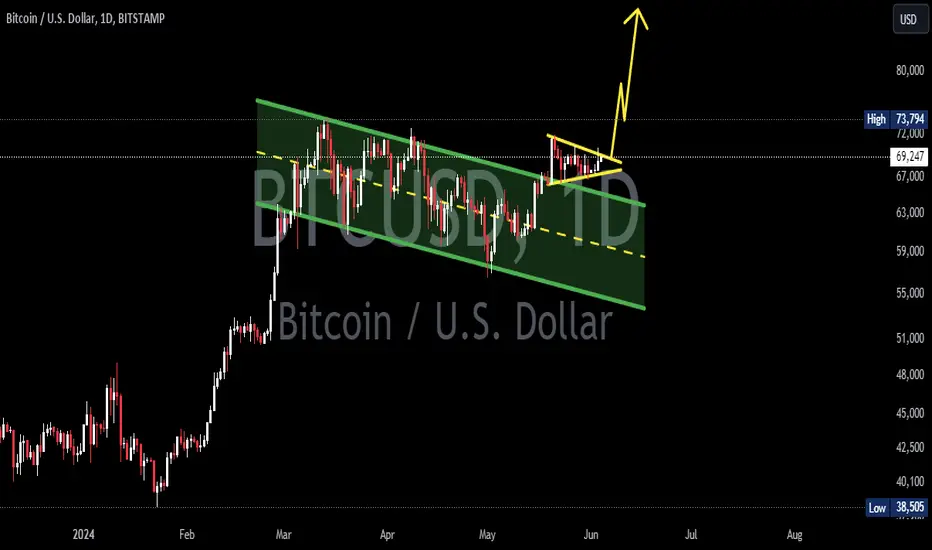
BITCOIN Major Bullish Break-out taking place.Bitcoin (BTCUSD) broke today above the top of the Falling Wedge pattern, which is technically the Bearish Leg of May's Channel Up. If the days closes above it, we will have a repeat of the May 13 Bullish break-out but this time even stronger as the 1D Stoch RSI has formed a Bullish Cross on oversold territory.
As mentioned on our previous analysis, the last Bullish Leg of the Channel Up peaked at +19.50%, so we expect BTC to replicate this. Our Target is 79000.
Feel free to let us know in the comments section below!
-------------------------------------------------------------------------------
** Please LIKE 👍, FOLLOW ✅, SHARE 🙌 and COMMENT ✍ if you enjoy this idea! Also share your ideas and charts in the comments section below! This is best way to keep it relevant, support us, keep the content here free and allow the idea to reach as many people as possible. **
-------------------------------------------------------------------------------
💸💸💸💸💸💸
👇 👇 👇 👇 👇 👇
BTCUSDT Forms Bullish Flag Pattern, Eyeing $80000 Target.BTCUSDT has recently formed a bullish flag pattern, indicating potential for a substantial price increase. The immediate target is set at $75,000 following three months of consolidation. However, traders are advised to maintain a stop-loss strategy to manage risks.
BTCUSDT (1D Chart) Technical analysis
BTCUSDT (1D Chart) Currently trading at $69600
Buy level: Above $69500
Stop loss: Below $65900
TP1: $72000
TP2: $75000
TP3: $80000
TP4: $90000
Max Leverage 5x
Always keep Stop loss
Follow Our Tradingview Account for More Technical Analysis Updates, | Like, Share and Comment Your thoughts

BTCUSD 1MBTC ~ 1M
#BTC on Monthly Time Frame BITSTAMP:BTCUSD Looks very good. The retest of the support line has been successful.
Our short term target is $80,000
Our long term target is +$100,000
BITCOIN Inverse Head and Shoulders targeting $79500Bitcoin (BTCUSD) is technically about to complete the Right Shoulder of the Inverse Head and Shoulders pattern (IH&S) that followed the All Time High (ATH) of March 14. The driving vessel behind it is a (dotted) Channel Up whose Bullish Leg peaked at +19.50% and its two Bearish Legs so far have been around -8.00%.
As you may realize, there is a high degree of structural symmetry on these patterns as even the IH&S has distinct Support and Resistance Zones, with Sour interest currently being on Support Zone 1, which has already held twice since May 23.
As a result, as long as it holds along with the 1D MA50 (blue trend-line), the trend remains bullish and the IH&S technical dynamics target the 2.0 Fibonacci extension at $89000. However we keep at the moment a shorter term perspective and before 89k, we will aim at $79500, which would be a +19.50% rise, similar to the Channel's previous Bullish Leg.
Feel free to let us know in the comments section below!
-------------------------------------------------------------------------------
** Please LIKE 👍, FOLLOW ✅, SHARE 🙌 and COMMENT ✍ if you enjoy this idea! Also share your ideas and charts in the comments section below! This is best way to keep it relevant, support us, keep the content here free and allow the idea to reach as many people as possible. **
-------------------------------------------------------------------------------
💸💸💸💸💸💸
👇 👇 👇 👇 👇 👇

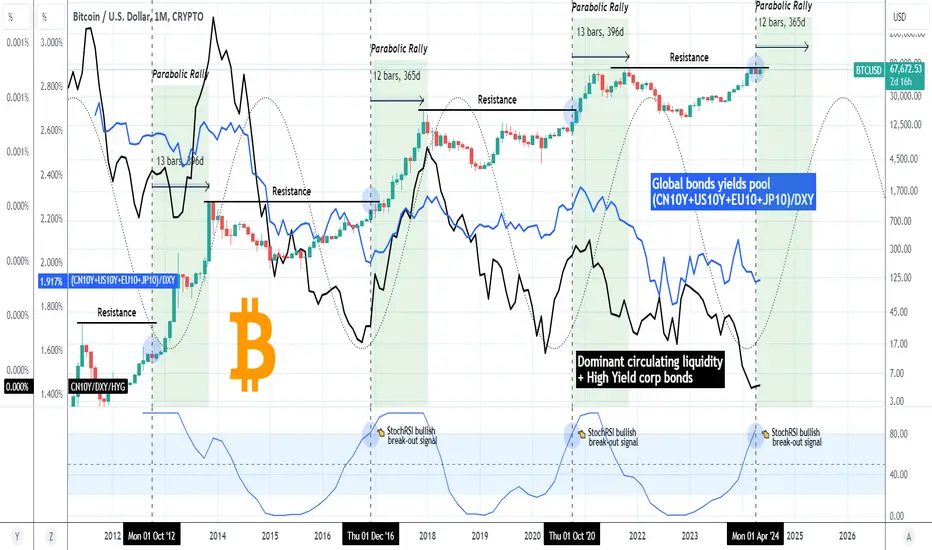
BITCOIN Massive liquidity signal triggered.Bitcoin (BTCUSD) is starting the final and most aggressive part of the current Bull Cycle: the Parabolic Rally. The latest and perhaps the strongest signal to confirm that comes from the well known liquidity combo indicators that we have developed these past few years.
The Global bonds yields pool (blue trend-line) is reversing upwards again, the first time it does so this year, while the Dominant circulating liquidity + High Yield corporate bonds indicator (black trend-line) is also reversing upwards after seemingly hitting a bottom similar to April 2020, October 2016 and July 2012.
The trigger signal is given by the Stoch RSI (2M time-frame), which just broke above the overbought 80.00 barrier. Every time it has done so historically, it has coincided with a massive bullish reversal on those Liquidity Indicators (LI) and Bitcoin made a Cycle top within 12 - 13 months later.
As a result, we are expecting BTC to peak a year from now, around May 2025. Brace yourself for a wild ride ahead!
But what do you think? Is liquidity about to kick in and cause a massive rally? Feel free to let us know in the comments section below!
-------------------------------------------------------------------------------
** Please LIKE 👍, FOLLOW ✅, SHARE 🙌 and COMMENT ✍ if you enjoy this idea! Also share your ideas and charts in the comments section below! This is best way to keep it relevant, support us, keep the content here free and allow the idea to reach as many people as possible. **
-------------------------------------------------------------------------------
💸💸💸💸💸💸
👇 👇 👇 👇 👇 👇
BTCUSD 1MBTC ~ 1M
#BTC We look at the history of BITSTAMP:BTCUSD as a whole as recorded on the chart.
It looks like #BTCUSD is ready to continue its upward trajectory.
This is marked by a 3 month accumulation phase.
but the bad news is, the increase will not be more than $150,000. Even if it is more, it's probably not much and it's just a bonus.
BTCUSDT Parallel Channel BreakoutBTC break the upper side of the channel, now on retesting of channel support we can take entry of Buy.
It's a long term trade(daily timeframe) so manage your risk accordingly.

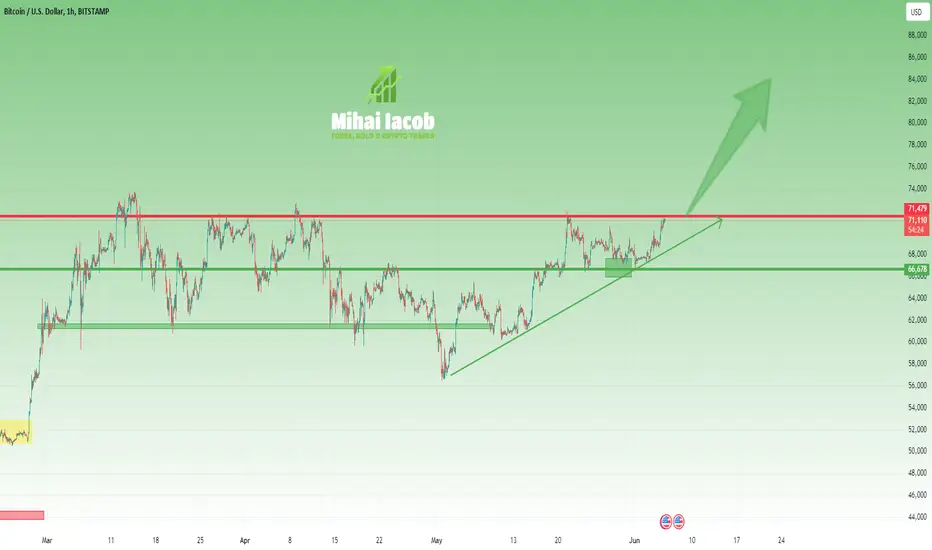
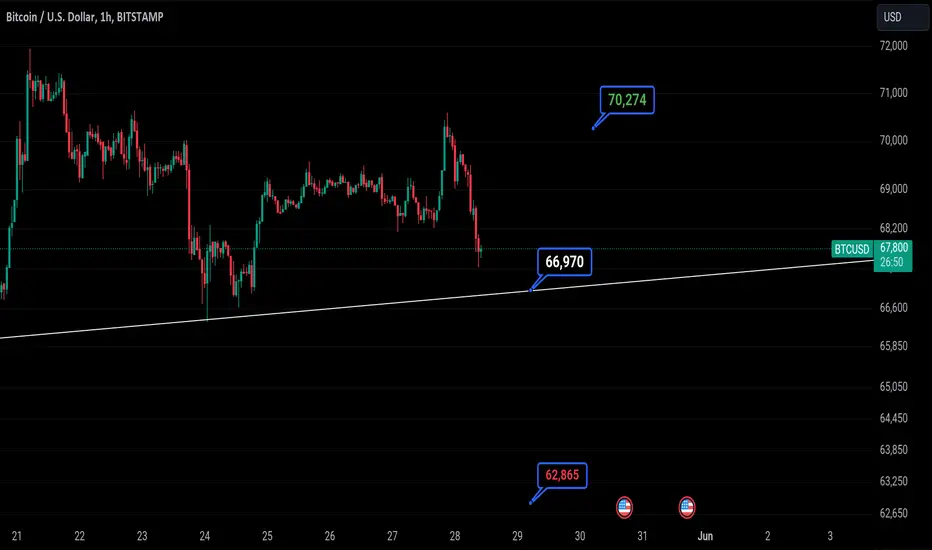
BTCUSD If any hourly closing sustains below that white line then could 📉 📉 to 62865
If it sustains above white line and a daily closing above 66970 then 📈 📈 to 70274
Any daily closing above 70274 is bullish to 📈 📈 to 77559 marked on the chart
Disclaimer:
Its a personal view not a financial advice and I assume no responsibility and liability whatever outcome arises.
BITCOIN There is no turning back from this.Bitcoin (BTCUSD) has started the 5th Bullish Wave of the current Bull Cycle, following the consolidation of the past 2 months. Since the November 2022 bottom we have had 4 such waves with consolidations ranging from 1 month to 6 months (blue Channel of April 10 - October 10 2023). The current wave can technically take Bitcoin up to $100k alone.
What is even more bullish than that though is the fact that the whole (ellipse) structure since the October 2023 Low, resembles the sequences of April 2020 - March 2021 and May - December 2017. As you can see, both were Bullish Legs of the 7-year Channel Up. Symmetrically, it appears that we are past its 2nd consolidation (blue circle) and starting the final rally to the Top of the Channel Up.
That means that the Cycle Top can even be marginally higher than $200k until the 1W MA50 (blue trend-line) is breached again (note that we are past a 1W Bullish Cross also) which can make us start considering a Bull Cycle again.
But what do you think? Is this rise just the start of a wave that will take BTC to 100000 even 200000 if history repeats itself? Feel free to let us know in the comments section below!
-------------------------------------------------------------------------------
** Please LIKE 👍, FOLLOW ✅, SHARE 🙌 and COMMENT ✍ if you enjoy this idea! Also share your ideas and charts in the comments section below! This is best way to keep it relevant, support us, keep the content here free and allow the idea to reach as many people as possible. **
-------------------------------------------------------------------------------
💸💸💸💸💸💸
👇 👇 👇 👇 👇 👇
BTCUSD 1DBTC ~ 1D Updated
#BTC It seems #Bitcoin Retesting the Support Line in this pattern.
Bulls still dominate as long as the price remains above this pattern.

BTCUSDPair : BTCUSD ( Bitcoin / U.S Dollar )
Description :
Head and Shoulder
RSI - Divergence
Completed " 12345 " Impulsive Waves
Break of Structure
S / R Level


BITCOIN is going to 'attack' $150k next. Confirmed!Bitcoin (BTCUSD) is starting the next rally phase after the pre and post-Halving 2-month consolidation, a development that is consistent with both of its previous Cycles.
In fact, if traded around and above the Mayer Multiple Band (MMB) of 1 Standard Deviation (SD) above (gray trend-line), which is the exact same consolidation phase it had (blue ellipse) after every time the Bollinger Bands Width (BBW) bottomed (blue trend-line).
The astonishing symmetry among BTC's Cycles is evident also when using the Vortex Indicator (VI)- and the CCI both on the 2M time-frame. As you can see, every timr the VI- topped was when the CCI made hits 1st Higher Low following its own bottom. The distance between that point in time (vertical orange line) and the bottom of the BBW (vertical green line) has been around 180 days on each of the past 3 Cycles.
On the last two, Bitcoin topped within 560 - 595 days from the vertical orange line. As a result, we can expect the price to top by the week of March 17 2025 the earliest.
The most important part perhaps is that after each consolidation after the BBW bottom (blue ellipse), Bitcoin's immediate target was the MMB 3SD, which is the orange trend-line. That is currently at $125k but by the time the rally reaches it, it could be closer to $150k.
But what do you think? Do you feel that BTC is about to 'attack' $150k as its next target? Feel free to let us know in the comments section below!
-------------------------------------------------------------------------------
** Please LIKE 👍, FOLLOW ✅, SHARE 🙌 and COMMENT ✍ if you enjoy this idea! Also share your ideas and charts in the comments section below! This is best way to keep it relevant, support us, keep the content here free and allow the idea to reach as many people as possible. **
-------------------------------------------------------------------------------
💸💸💸💸💸💸
👇 👇 👇 👇 👇 👇

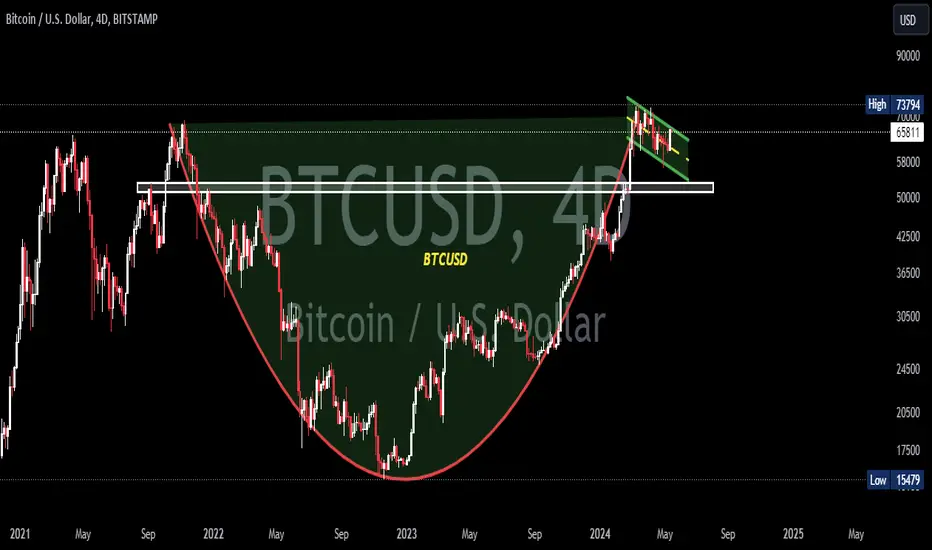
BTCUSD 4D BTC ~ Updated
#BTC Successfully broke through the resistance line of this bull flag pattern.
It looks like a new ATH will form again soon.
We are targeting $80,000 for the new ATH.
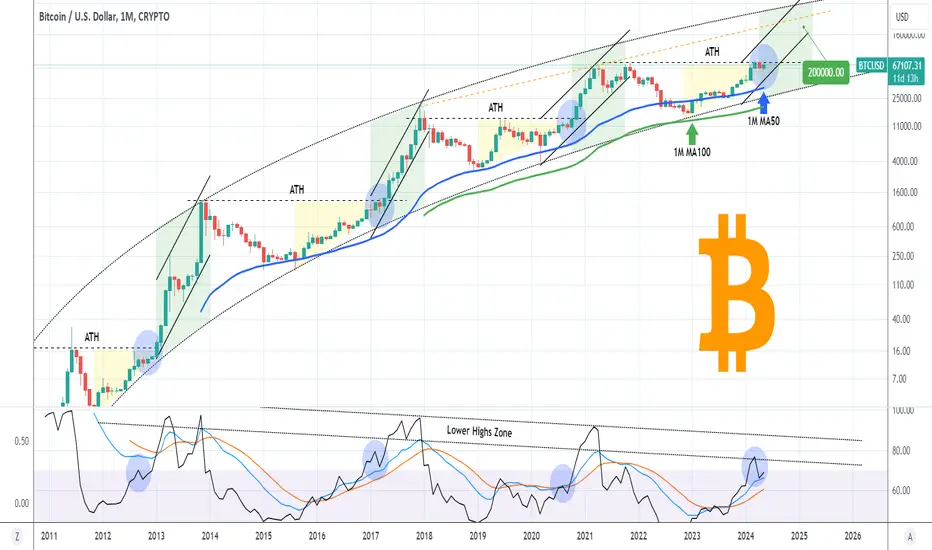
BITCOIN Can it reach $200k?Bitcoin (BTCUSD) is on yet another green 1M (monthly) candle and if it closes that way it will be the 8th in the last 9, a natural Bull Cycle rally. This is taking place around the former All Time High (ATH) level for the 3rd month in a row.
A similar consolidation (blue circle) took place during each and every past Cycle and every time a very strong rally (green zone) started after it. Parallel to that, the 1M RSI printed a short-term pull-back. When the 1M MACD hit its Lower Highs Zone, it was time to start taking profits as the Cycle Top was priced.
Based on this past Cycles model, $200k is a very plausible Target that would even be much lower than the top of the Parabolic Channel.
So what do you think? Will BTC go that high during this Cycle? Feel free to let us know in the comments section below!
-------------------------------------------------------------------------------
** Please LIKE 👍, FOLLOW ✅, SHARE 🙌 and COMMENT ✍ if you enjoy this idea! Also share your ideas and charts in the comments section below! This is best way to keep it relevant, support us, keep the content here free and allow the idea to reach as many people as possible. **
-------------------------------------------------------------------------------
💸💸💸💸💸💸
👇 👇 👇 👇 👇 👇
BITCOIN Inverse H&S in full motion. Next stop = $100k.We have been expecting the Inverse Head and Shoulders (IH&S) to break-out above the Lower Highs trend-line since May 06 (see chart below) and Bitcoin (BTCUSD) dully delivered:
In fact, what we will do on this idea is simply update the Bullish Megaphone of May 02 and chart it inside a more fitting Channel Up:
The previous two IH&S bottom formations delivered a rise of around +95%. With the 1D MACD on the same Bullish Cross that was present on both of those bottoms, we are expecting the $100000 psychological target to be reached after July, which will even be a rise below +90%.
What is your take on this? Feel free to let us know in the comments section below!
-------------------------------------------------------------------------------
** Please LIKE 👍, FOLLOW ✅, SHARE 🙌 and COMMENT ✍ if you enjoy this idea! Also share your ideas and charts in the comments section below! This is best way to keep it relevant, support us, keep the content here free and allow the idea to reach as many people as possible. **
-------------------------------------------------------------------------------
💸💸💸💸💸💸
👇 👇 👇 👇 👇 👇

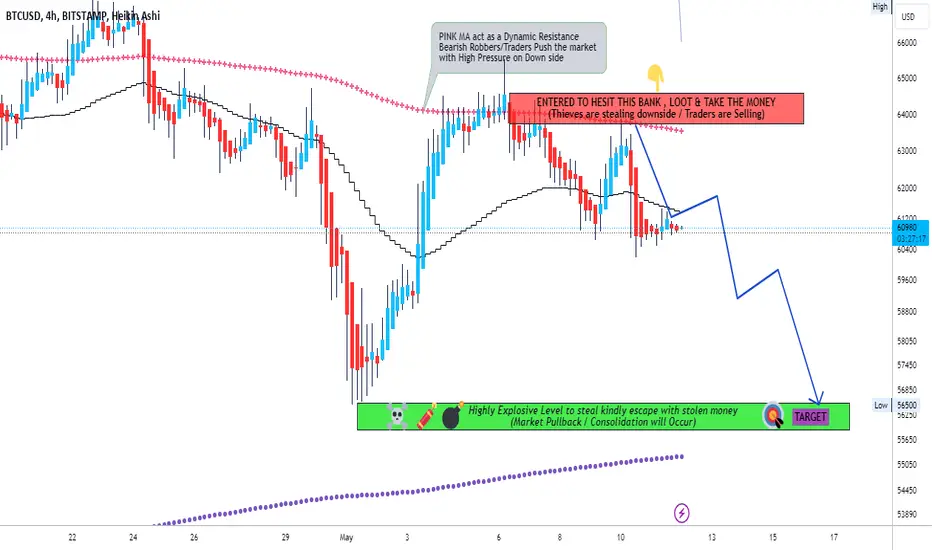
BTCUSD Bearish Money Heist Plan to make and take moneyMy Dear Robbers / Traders,
This is our master plan to Heist Bearish side of BTCUSD Market based on Thief Trading style Technical Analysis.. kindly please follow the plan I have mentioned with target in the chart focus on Short entry, Our target is Green Zone that is High risk Dangerous area market is overbought / Consolidation / Trend Reversal at the level Bearish Robbers / Traders gain the strength. Be safe and be careful and Be rich.
Loot and escape on the target 🎯 Swing Traders Plz Book the partial sum of money and wait for next breakout of dynamic resistance level, Once it is cleared we can continue our heist plan to next target.
support our robbery plan we can make money & take money 💰💵 Join your hands with US. Loot Everything in this market everyday.
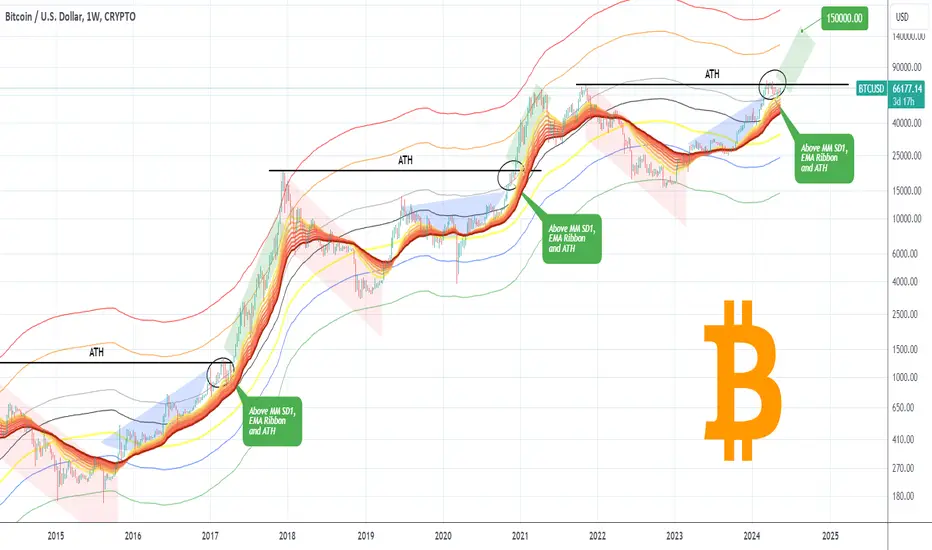
BITCOIN Is 150k by August realistic?Bitcoin (BTCUSD) started to rise again, which is very natural as it almost completed a -25% correction (normal during Bull Cycles) and closed yesterday above the 1D MA50 after two straight rejections.
The situation couldn't look better on the long-term charts as well, namely on 1W where it is at a cyclical stage (ellipse on the chart) where during past Cycles it started its most aggressive rally.
As you can see, BTC rebounded on the EMA Ribbon, after making a new All Time High (ATH) while also recovering the Mayer Multiple SD1 from above (grey trend-line). When those parameters got met in the past, Bitcoin always touched at least the MMB SD2 from above (orange trend-line).
Based on that, the next Target on this run is $150000. Do you think that would be realistic as early as the end of August? Feel free to let us know in the comments section below!
-------------------------------------------------------------------------------
** Please LIKE 👍, FOLLOW ✅, SHARE 🙌 and COMMENT ✍ if you enjoy this idea! Also share your ideas and charts in the comments section below! This is best way to keep it relevant, support us, keep the content here free and allow the idea to reach as many people as possible. **
-------------------------------------------------------------------------------
💸💸💸💸💸💸
👇 👇 👇 👇 👇 👇
BTCUSD 4DBTC ~ 4D Updated
#BTC On 4D Timeframe, CRYPTOCAP:BTC USD Formed a Bull Flag Pattern. It is very bullish if it breaks the resistance line of this pattern