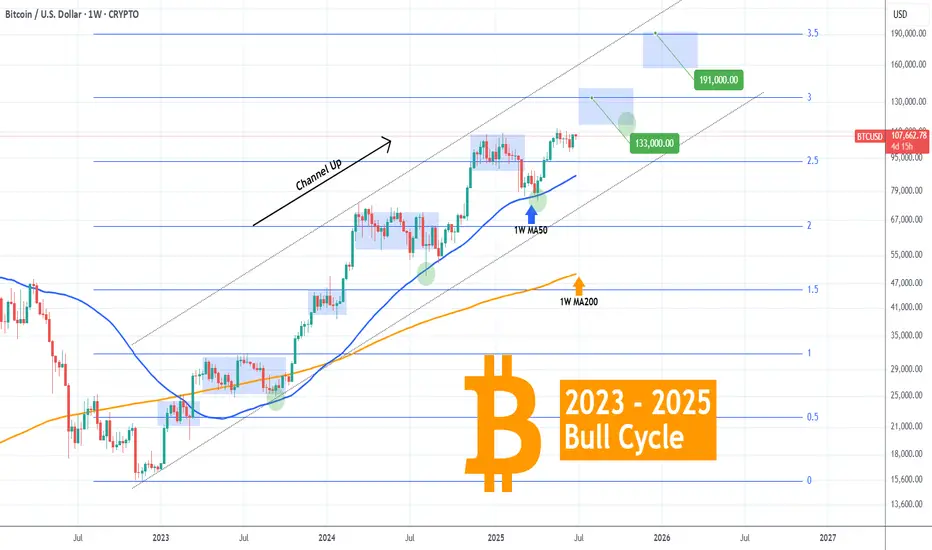
BITCOIN Bull Cycle's next two probable stops..Bitcoin (BTCUSD) has been trading within a 2.5-year Channel Up throughout the entirety of its 2023 - 2025 Bull Cycle, showcasing incredible consistency. This is perhaps BTC's most stable Bull Cycle and that can help us estimate to some degree its next two key levels, before its tops.
As you can see, every major Higher High of this pattern has been either on or marginally above a +0.5 Fibonacci interval:
Fib 0.5 was the February 2023 High and Accumulation Phase.
Fib 1.0 the April - September 2023 Accumulation.
Fib 1.5 December 2023 - January 2024.
Fib 2.0 March - September 2024.
Fib 2.5 December 2024 - February 2025.
Right now the market seems to be attempting a break-out above a Bull Flag, following the massive April 07 2025 rebound on the 1W MA50 (blue trend-line), a level that has been the most optimal buy entry in the past 2 years.
The next stop based on this model is the 3.0 Fibonacci extension level at 133000, where there are high probabilities for the market to consolidate (accumulation phase) in preparation for perhaps the final stop and Cycle peak on the 3.5 Fib ext around 191000. As we've discussed on previous analyses, a final Target between those two around $150000 may be more fitting, carrying less risk into the final months of the Bull Cycle.
So what do you think? Do you believe that's the blueprint to follow until the end of the year/ Cycle? Feel free to let us know in the comments section below!
-------------------------------------------------------------------------------
** Please LIKE 👍, FOLLOW ✅, SHARE 🙌 and COMMENT ✍ if you enjoy this idea! Also share your ideas and charts in the comments section below! This is best way to keep it relevant, support us, keep the content here free and allow the idea to reach as many people as possible. **
-------------------------------------------------------------------------------
💸💸💸💸💸💸
👇 👇 👇 👇 👇 👇
Btcusdsignals
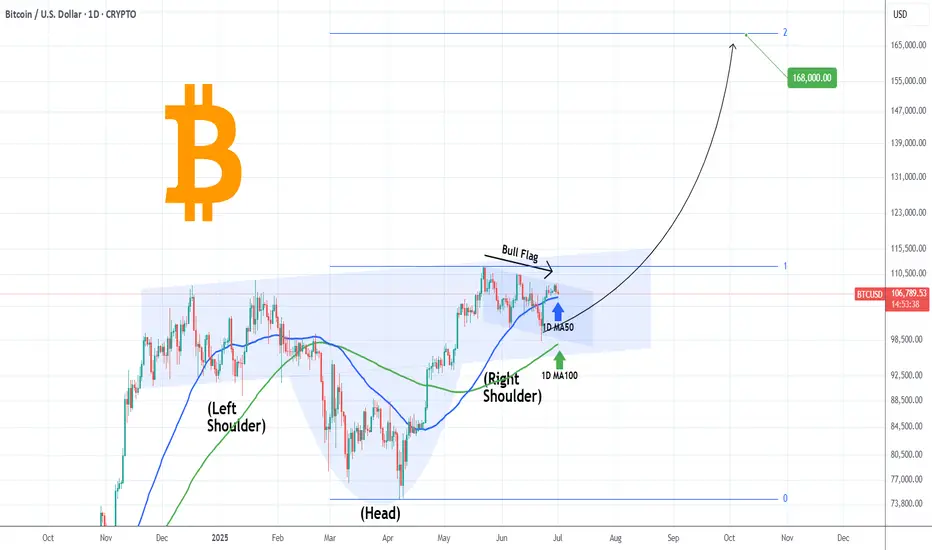
BITCOIN Can this Inverse Head and Shoulders deliver $168000?We saw yesterday how Bitcoin (BTCUSD) has been trading within a short-term Channel Down pattern, which as mentioned was just a Bull Flag on the long-term scale.
Today we examine this on the longer term time-frame and what stands out on 1D is an Inverse Head and Shoulders (IH&S). Such patterns are incredibly bullish but are more often seen on market bottoms initiating strong long-term bullish reversals.
This time it has been formed on a 1W Bull Cycle uptrend (Channel Up), so it technically serves as a (very) long-term Accumulation Phase between the Cycle's previous All Time High (ATH) and the next one, which most likely will be the final (peak) of the Bull Cycle.
As mentioned numerous times in the past, IH&S patterns target their 2.0 Fibonacci extension level once broken. That is now at $168000 and falls well within the broader 150 - 200k range that most studies have as a potential Cycle Top.
So do you think that is realistic to expect? Feel free to let us know in the comments section below!
-------------------------------------------------------------------------------
** Please LIKE 👍, FOLLOW ✅, SHARE 🙌 and COMMENT ✍ if you enjoy this idea! Also share your ideas and charts in the comments section below! This is best way to keep it relevant, support us, keep the content here free and allow the idea to reach as many people as possible. **
-------------------------------------------------------------------------------
💸💸💸💸💸💸
👇 👇 👇 👇 👇 👇
BTCUSDT Trade SetupBTC Still in sideways no major move, wait for the entries. While on weekly tf still expecting a final shakeout, 95-93k then a final leg up towards to 120k. For now wait for the entries to be filled first then must use sl.

Analysis and layout of BTC trend in the third quarter📰 News information:
1. Pay attention to the movement of the cryptocurrency market
2. The impact of DAA, etc.
📈 Technical Analysis:
As demand weakens and supply pressure rises, BTC's network valuation exceeds the speed of activity. Exchange inflows and negative DAA divergences indicate that despite price stability, the risk of selling remains. Currently, BTC is experiencing a retracement after a rebound. In the short term, it is still possible to retrace to 106,500 and then rise after stabilizing.
🎯 Trading Points:
SELL 108000-107500
TP 107000-106500
BUY 106500-106000
TP 107500-108000
In addition to investment, life also includes poetry, distant places, and Allen. Facing the market is actually facing yourself, correcting your shortcomings, confronting your mistakes, and strictly disciplining yourself. I hope my analysis can help you🌐.
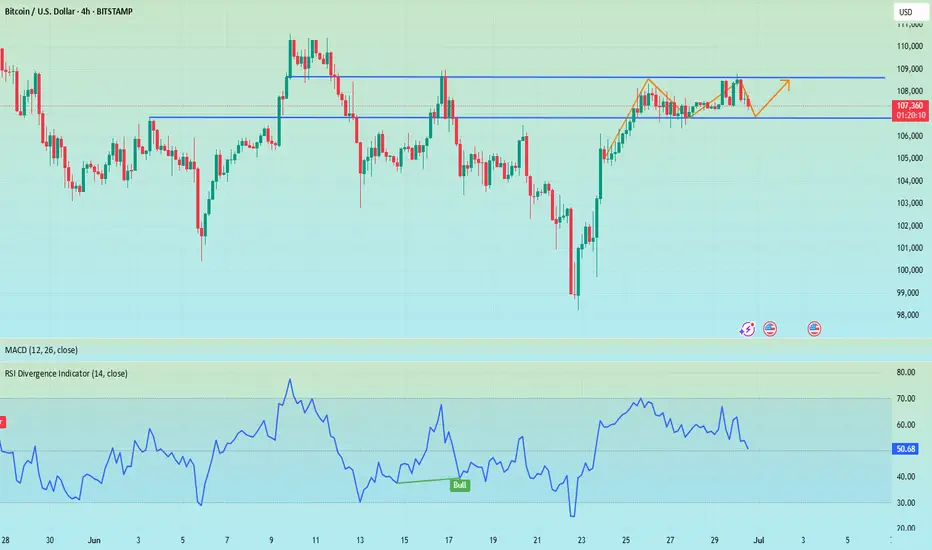
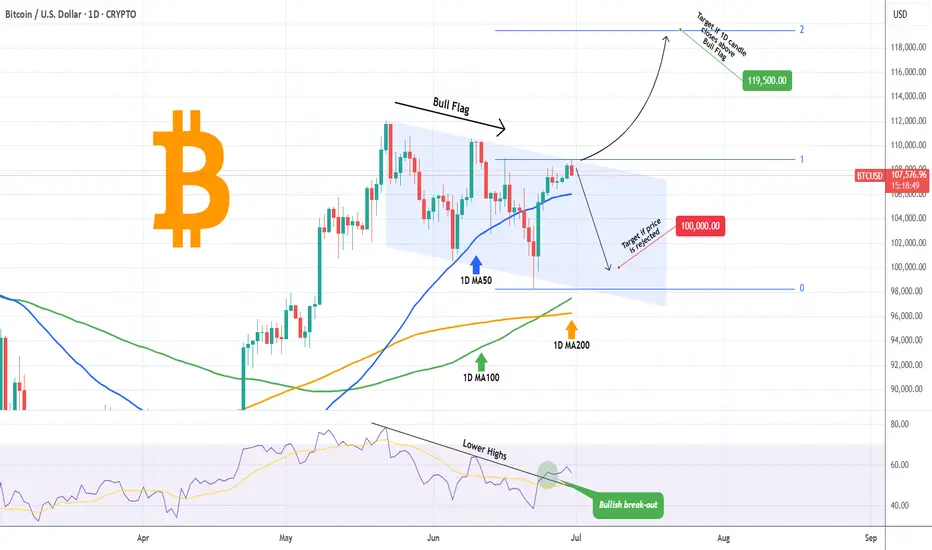
BITCOIN Rejected (so far) where it absolutely SHOULDN'T!!Bitcoin (BTCUSD) hit today the top of the Channel Down pattern, which as we've discussed numerous times, is most likely on the long-term a Bull Flag technically. Still, this early test has so far turned into a rejection.
Early on to tell as the price remains above even the 1D MA50 (blue trend-line) but if it breaks above the closes a 1D candle above the top of the pattern, we expect it to immediately target the 2.0 Fibonacci extension level at 119500. We have analyzed of course why on the long-term the Target is at least $150k, but this is a shorter term analysis. Notice also how the 1D RSI has already broken above its Lower Highs trend-line.
As long as the price remains rejected within the Channel Down, it is possible to look for support on the 100000 level again, where this time it may make contact with the 1D MA100 (green trend-line) in an attempt to 'attract' the last batch of buyers.
Which scenario do you think will prevail? Feel free to let us know in the comments section below!
-------------------------------------------------------------------------------
** Please LIKE 👍, FOLLOW ✅, SHARE 🙌 and COMMENT ✍ if you enjoy this idea! Also share your ideas and charts in the comments section below! This is best way to keep it relevant, support us, keep the content here free and allow the idea to reach as many people as possible. **
-------------------------------------------------------------------------------
💸💸💸💸💸💸
👇 👇 👇 👇 👇 👇
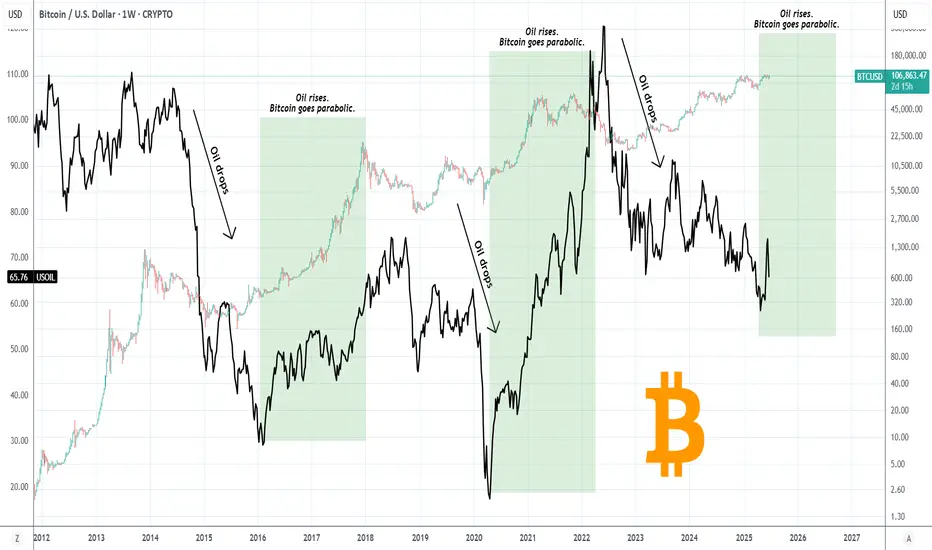
BITCOIN Just wait until OIL turns bullish!Bitcoin (BTCUSD) has a unique long-term relationship/ correlation with WTI Oil (USOIL) and this charts shows why.
In the past 11 years, when Oil started to decline sharply, Bitcoin formed a market bottom before Oil did. When Oil started to rise again, Bitcoin was out of its bottom and has initiated its Parabolic Rally stage (green Rectangle). Then Oil peaked after BTC has already priced its own Cycle Top.
Based on this correlation, we can assume that we haven't yet seen BTC's Parabolic stage as Oil hasn't yet started to rise. If we assume that the late April Low on Oil was its market bottom, then only now it has started its rise, so at best BTC has just started the Cycle's Parabolic Rally. If that turns out o be true, then the upside potential is huge for BTC. Needless to say other key macroeconomic factors have to assist e.g. higher adoption, ETF inflows, FED Rate Cut, but that's what the current chart says!
So do you think that Oil can be the driver behind a new Bitcoin parabolic rally? Feel free to let us know in the comments section below!
-------------------------------------------------------------------------------
** Please LIKE 👍, FOLLOW , SHARE and COMMENT if you enjoy this idea! Also share your ideas and charts in the comments section below! This is best way to keep it relevant, support us, keep the content here free and allow the idea to reach as many people as possible. **
-------------------------------------------------------------------------------
💸💸💸💸💸💸
👇 👇 👇 👇 👇 👇
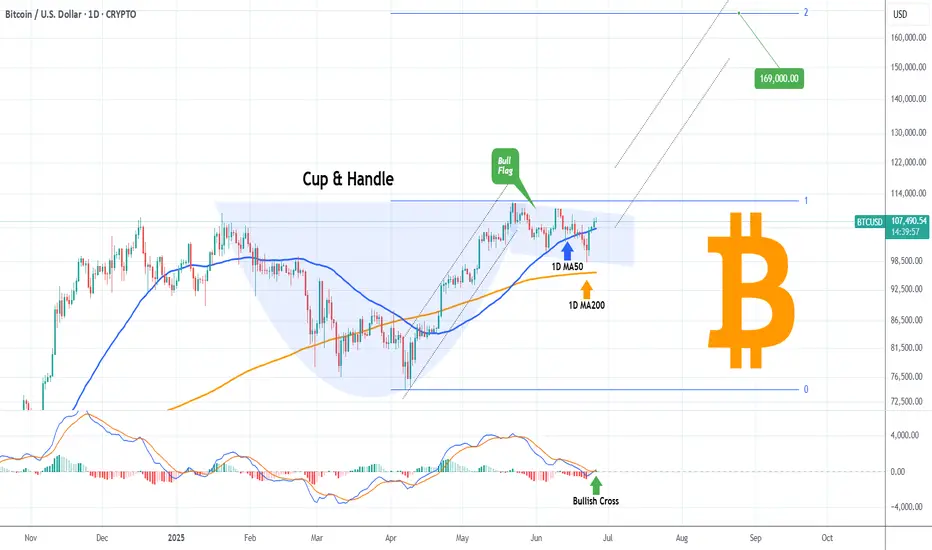
BITCOIN Cup & Handle completed! Technical Target $169k!Bitcoin (BTCUSD) is about to complete the Handle of a Cup and Handle (C&H) pattern. This comes only days after breaking below its 1D MA50 (blue trend-line) buy holding the 1D MA200 (orange trend-line) and rebounding.
Well the 1D MA50 has been recovered and on top of that, the 1D MACD just formed a Bullish Cross. This (isolated) Bull Flag, which is the Handle, technically targets the 2.0 Fibonacci extension at $169000.
Do you think that's realistic or a little excessive within thin time-frame? Feel free to let us know in the comments section below!
-------------------------------------------------------------------------------
** Please LIKE 👍, FOLLOW ✅, SHARE 🙌 and COMMENT ✍ if you enjoy this idea! Also share your ideas and charts in the comments section below! This is best way to keep it relevant, support us, keep the content here free and allow the idea to reach as many people as possible. **
-------------------------------------------------------------------------------
💸💸💸💸💸💸
👇 👇 👇 👇 👇 👇
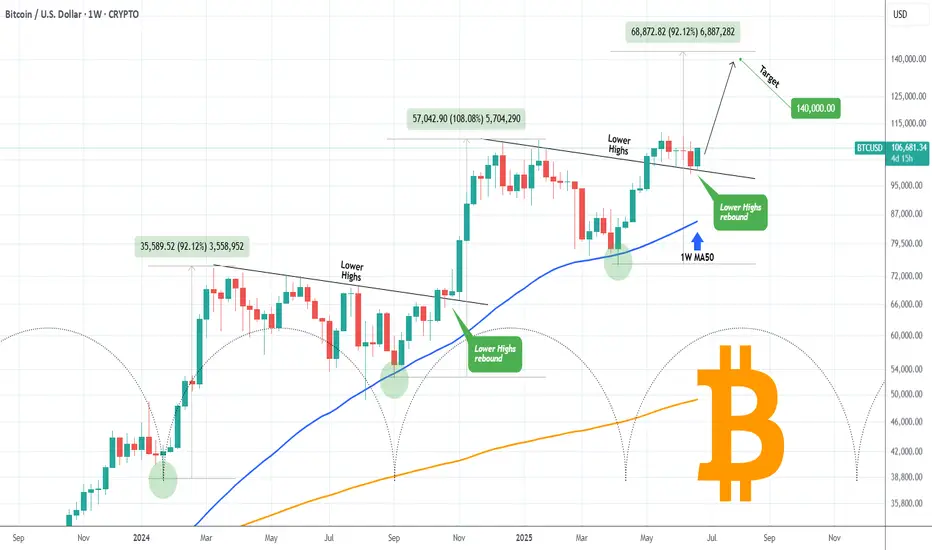
BITCOIN Major Pivot bounce eyes $140000!Bitcoin (BTCUSD) has started off the week with a huge 1W candle bounce on the former Lower Highs trend-line (that started on its All Time High), which has now turned into a Pivot. That trend-line held both last week and 3 weeks ago.
The very same Pivot test took place (October 2024) at the start of the previous Bullish Leg, resulting into a massive rebound that peaked upon a +108.08% rise. That was even higher than the Bullish Leg before it (+92.12%), which also started after a 1.5 month consolidation (Dec 2023 - Jan 2024).
Interestingly enough those Legs show an amazing frequency as the Time Cycles show on their bottoms. Assuming the current Bullish Leg will follow the 'bad case' scenario of +92.12%, we should be expecting to see at least $140000 before the next pull-back/ consolidation.
Do you think such Target is feasible by the end of August? Feel free to let us know in the comments section below!
-------------------------------------------------------------------------------
** Please LIKE 👍, FOLLOW ✅, SHARE 🙌 and COMMENT ✍ if you enjoy this idea! Also share your ideas and charts in the comments section below! This is best way to keep it relevant, support us, keep the content here free and allow the idea to reach as many people as possible. **
-------------------------------------------------------------------------------
💸💸💸💸💸💸
👇 👇 👇 👇 👇 👇
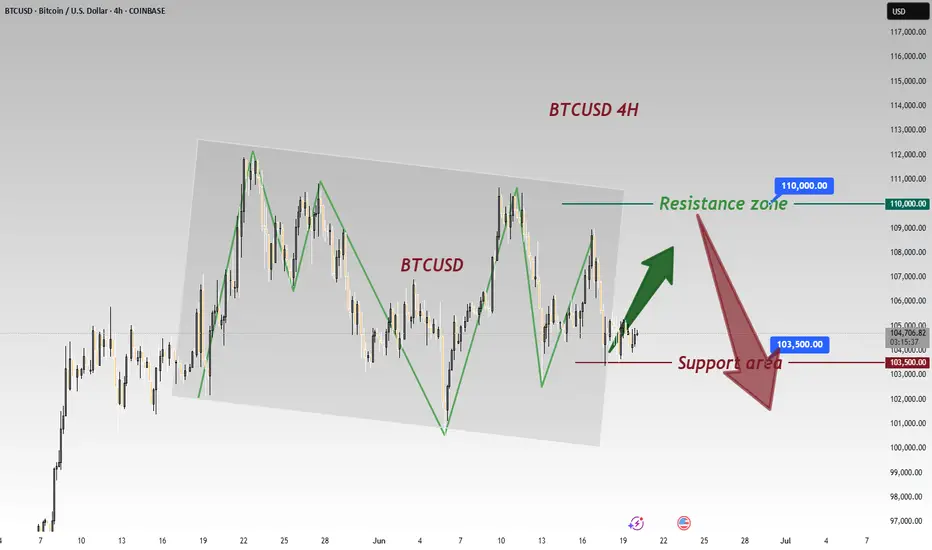
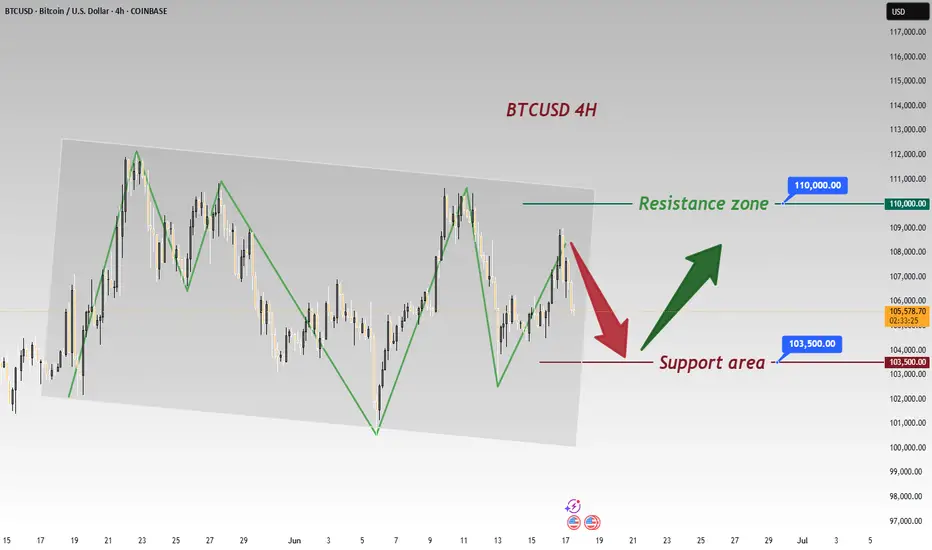
BTCUSD 4-Hour Chart Analysis: Range Bound with Bearish BiasFrom the 4 - hour chart of BTCUSD, the price movement shows obvious range - bound fluctuation characteristics 📊.
Currently, it is necessary to focus on the key resistance and support zones 🎯:
From a technical perspective, BTC is likely to oscillate repeatedly within the range in the near term 🔄, yet the overall trend leans bearish 🐻.
In the short term, opportunities for buying low and selling high within the range can be monitored 📈📉
⚡️⚡️⚡️ BTCUSD ⚡️⚡️⚡️
🚀 Sell@106500 - 105500
🚀 TP 104500 - 103500
🚀 Buy@102500 - 103500
🚀 TP 104500 - 105500
Accurate signals are updated every day 📈 If you encounter any problems during trading, these signals can serve as your reliable guide 🧭 Feel free to refer to them! I sincerely hope they'll be of great help to you 🌟 👇

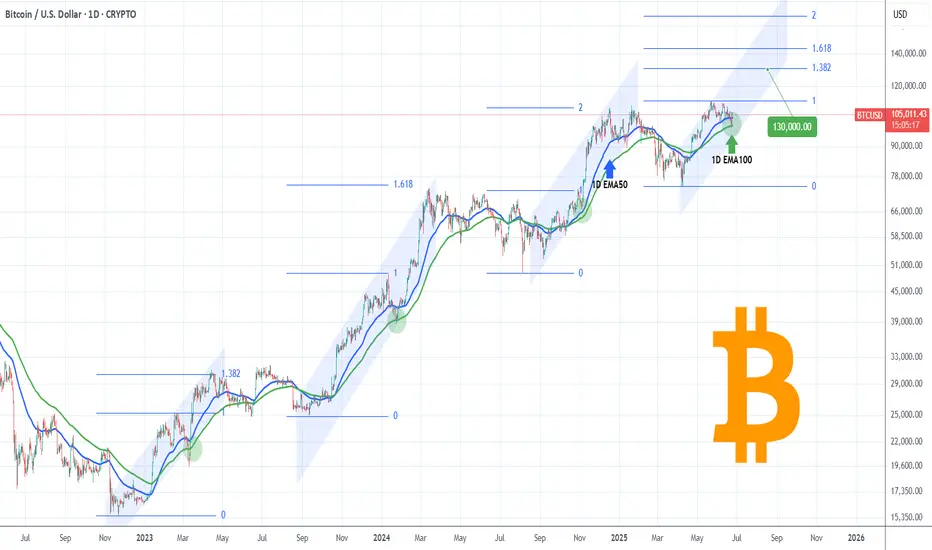
BITCOIN Trump and the 1D EMA100 saved the day!Bitcoin (BTCUSD) rebounded yesterday on its 1D EMA100 (green trend-line) and along with Trump's truce announcement between Israel and Iran, it sent the market into a buying frenzy and back above the $105k mark.
Technically, the 1D EMA100 isn't something to be ignored as since the November 2022 market bottom, each Bullish Leg (Channel Up) that started had a contact (or near) with it that resulted into a considerable bullish extension.
The 1st Channel Up even breached below it, but after rebounding, it reached the 1.382 Fibonacci extension before the next correction. The 2nd Channel Up rebounded exactly on the 1D EMA100, and reached the 1.618 Fibonacci extension. The 3rd Channel Up almost hit the 1D EMA100 and then rebounded to the 2.0 Fibonacci extension.
It is obvious that the pattern follows a progression and each Fib extension peak is higher than on the previous Channel Up. As a result, it is not unlikely to see a High even above the 2.0 Fib ext ($168k) on the current (4th) Channel Up, however on the short-term we would still welcome the 1.382 Fib 'minimum' expectation, targeting $130000.
Do you think we should at least be expecting that? Feel free to let us know in the comments section below!
-------------------------------------------------------------------------------
** Please LIKE 👍, FOLLOW ✅, SHARE 🙌 and COMMENT ✍ if you enjoy this idea! Also share your ideas and charts in the comments section below! This is best way to keep it relevant, support us, keep the content here free and allow the idea to reach as many people as possible. **
-------------------------------------------------------------------------------
💸💸💸💸💸💸
👇 👇 👇 👇 👇 👇
USD Index (DXY) Bullish Reversal & Breakout PotentialThe DXY chart displays a strong bullish reversal structure from the support zone near the 99,800–100,200 area. Here’s a professional breakdown of the technical setup:
🔍 Key Observations:
🟢 Bullish Reversal Formation
The price rebounded aggressively from a strong demand zone (support), marked by a green arrow and orange highlight.
Multiple historical reaction zones confirm this level's validity as a reliable support.
📉 Previous Decline & Correction
After reaching the resistance area near 110.400, the price corrected with a bearish channel.
This pullback formed a classic bull flag, a bullish continuation pattern, eventually leading to the current breakout.
🟦 Current Price Action
The market has broken out of the recent downtrend and is forming higher highs and higher lows.
A strong bullish impulse candle confirms renewed buying interest.
🧱 Support & Resistance Levels:
🔵 Resistance Zone (Target): 110.409 — a historically respected area and target for the bullish move.
🟣 Current Support Zone: 105.061 — previously resistance, now likely to act as support after the breakout.
🎯 Bullish Target Projection
If price retests and holds the support at 105.061, the next potential leg can extend towards 110.409, offering a strong risk-to-reward setup.
⚠️ Caution
Watch for a pullback and retest near the support level.
A failure to hold above 105.061 could invalidate the bullish structure.
🧠 Conclusion
The DXY is showing a bullish trend continuation after a breakout from a corrective structure. A successful retest of support could propel price towards the 110.400 target zone 📊.
Bias: ✅ Bullish above 105.061
Invalidation: ❌ Below 105.000

BITCOIN Is this just a giant Bull Flag??Bitcoin (BTCUSD) saw a strong sell-off yesterday in the aftermath of the U.S. strike in Iran and fears of retaliation, but in later hours recovered some of the lost ground. The recovery is being extended into the Asian and early E.U. hours today and the emerging Channel Down pattern already draws strong similarities with the one in December 17 2024 - January 13 2025.
Both broke below their respective 1D MA50 (blue trend-lines) to form a Lower Low, which in the case of Jan 2025, it initiated a rebound that tested the All Time High (ATH) Resistance. See also how similar their 1D RSI patterns are, testing the same Support level too (41.20).
Given that this time the uptrend has been much shorter since the April 07 2025 Low, this Channel Down may be nothing but a giant Bull Flag in the middle of a standard Bull Cycle Leg. Until confirmed with a 1W candle closing above the ATH Resistance though, the medium-term Target is $111900.
Notice also the formation today of a 1D MA100/200 Bullish Cross, the first since November 13 2024.
So what do you think? Is $111900 your short-term Target? Feel free to let us know in the comments section below!
-------------------------------------------------------------------------------
** Please LIKE 👍, FOLLOW ✅, SHARE 🙌 and COMMENT ✍ if you enjoy this idea! Also share your ideas and charts in the comments section below! This is best way to keep it relevant, support us, keep the content here free and allow the idea to reach as many people as possible. **
-------------------------------------------------------------------------------
💸💸💸💸💸💸
👇 👇 👇 👇 👇 👇

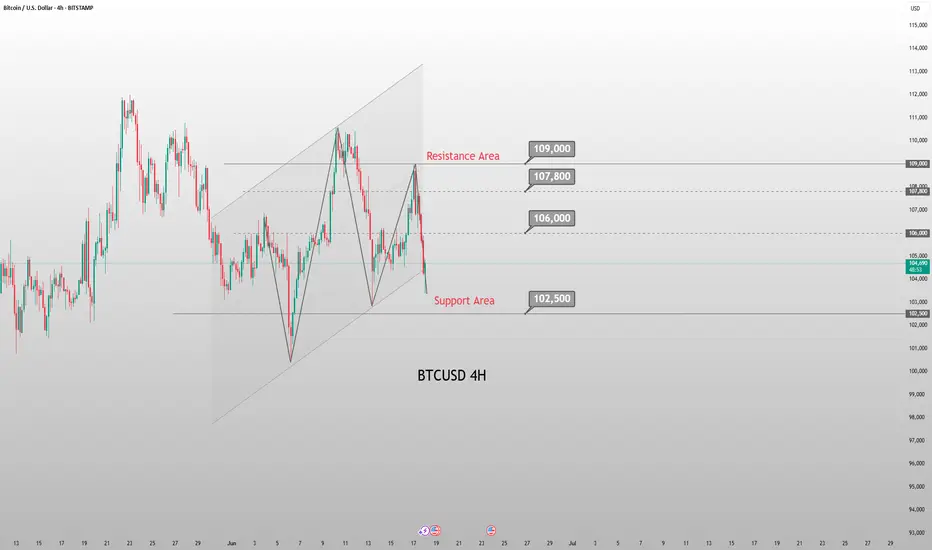
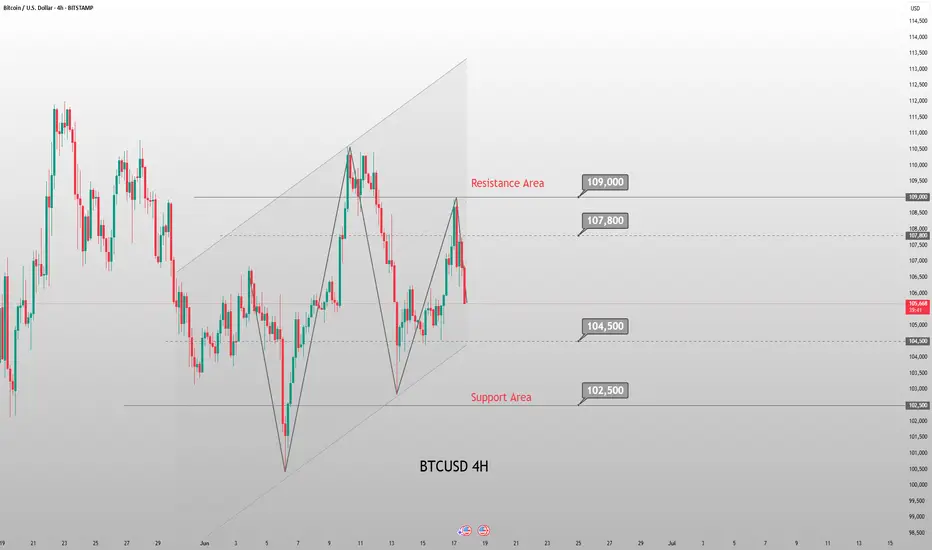
BTC Consolidates 104000-105000: Bearish Breakdown Looming?BTC Technical Update: Bitcoin has been consolidating within the 104000-105000 range for an extended period, with the overall trend showing a downward bias. With the overall trend tilting bearish, traders should watch for a break below 103500 to confirm the next leg down. 📉
⚡️⚡️⚡️ BTCUSD ⚡️⚡️⚡️
🚀 Sell@ 105000 - 104500
🚀 TP 102500 - 101500
Accurate signals are updated every day 📈 If you encounter any problems during trading, these signals can serve as your reliable guide 🧭 Feel free to refer to them! I sincerely hope they'll be of great help to you 🌟 👇
Current BTC Trend Analysis and Trading RecommendationsToday, U.S. markets are closed, leading to light trading activity and relatively limited overall market volatility. From a technical analysis perspective, the 4-hour K-line chart currently shows prices trading below the middle band of the Bollinger Bands, exhibiting a classic range-bound consolidation pattern. Bulls and bears are locked in a tug-of-war between key support and resistance levels, with K-line formations alternating between bullish and bearish patterns.
In terms of chart structure, the lower support zone has demonstrated strong buying conviction, while the upper resistance level has exerted clear restrictive force. Multiple failed upward breakouts have formed a short-term top. This box consolidation—characterized by resistance above and support below—is expected to sustain sideways trading through Friday.
Against the backdrop of no major positive catalysts, bearish momentum may gradually dominate if no substantial bullish triggers emerge. Maintain a trading strategy of selling into strength.
BTCUSD
105000-105500
tp:104000-103000
Investment itself is not the source of risk; it is only when investment behavior escapes rational control that risks lie in wait. In the trading process, always bear in mind that restraining impulsiveness is the primary criterion for success. I share trading signals daily, and all signals have been accurate without error for a full month. Regardless of your past profits or losses, with my assistance, you have the hope to achieve a breakthrough in your investment.

BITCOIN This is the long-term picture. Don't get distracted.Bitcoin (BTCUSD) has been consolidating lately after making a new All Time High (ATH) last month and this is already making part of the market nervous over whether that's the Cycle Top or not.
This is one of those times when it would be best to ignore the short-term noise/ volatility and stick to the long-term picture. And that's exactly what's shown on this chart, with BTC on the 1M time-frame showing the incredible symmetry among its 4-year Cycles, with Bear Markets lasting 12 - 13 months and Bull Markets 35.
Based on that, this Cycle's Top is expected to be priced by October (2025). This also matches the Sine Waves as implied by the 1M RSI, which as been trading within a Channel Down (diminishing returns) since Bitcoin's inception.
So do you also think that we have around 4 months before the market tops? Feel free to let us know in the comments section below!
-------------------------------------------------------------------------------
** Please LIKE 👍, FOLLOW ✅, SHARE 🙌 and COMMENT ✍ if you enjoy this idea! Also share your ideas and charts in the comments section below! This is best way to keep it relevant, support us, keep the content here free and allow the idea to reach as many people as possible. **
-------------------------------------------------------------------------------
💸💸💸💸💸💸
👇 👇 👇 👇 👇 👇

BITCOIN All boxes checked. Couldn't be more bullish than this!Bitcoin (BTCUSD) has filled numerous bullish conditions with the latest being holding the 1D MA50 (blue trend-line) as Support. This is basically the 3rd time testing and holding it since June 05. Even if that doesn't hold, we have the 1D MA200 (orange trend-line) directly below it as the ultimate long-term Support.
This trend-line just so happens to be exactly on the neckline of the Right Shoulder on the long-term Inverse Head and Shoulders (IH&S) pattern that has been in development since December 17 2024.
On top of all these, the market also formed a 1D Golden Cross a month ago, always a strong long-term bullish signal. IH&S patterns typically target their 2.0 Fibonacci extension, which sits at $168000.
Is that another indication that Bitcoin is going after 150k at least on its next run? Feel free to let us know in the comments section below!
-------------------------------------------------------------------------------
** Please LIKE 👍, FOLLOW ✅, SHARE 🙌 and COMMENT ✍ if you enjoy this idea! Also share your ideas and charts in the comments section below! This is best way to keep it relevant, support us, keep the content here free and allow the idea to reach as many people as possible. **
-------------------------------------------------------------------------------
💸💸💸💸💸💸
👇 👇 👇 👇 👇 👇

Current BTC Trend Analysis and Trading RecommendationsThe daily candlestick chart of BTC shows a three - day consecutive bearish retracement, having fallen back to the vicinity of the starting point of the previous pinbar rebound and currently remaining in a recent low - level sideways consolidation zone. However, the 4 - hour trend is pressured by the middle band of the Bollinger Bands, staying within a downward channel and forming a rebound - retracement wave pattern.
For short - term strategies, anticipate a further retracement first. Long positions should be initiated only after the support level is confirmed valid. This retracement represents a necessary consolidation phase before the bullish trend continues, and the current adjustment range does not pose a substantial threat of trend reversal to the overall uptrend. With the core upward trend intact and the direction remaining clear, BTC is expected to resume its upward momentum after a brief consolidation. The operational approach remains to go long on retracements.
BTCUSD
buy@103500-104000
tp:105500-106500
Investment itself is not the source of risk; it is only when investment behavior escapes rational control that risks lie in wait. In the trading process, always bear in mind that restraining impulsiveness is the primary criterion for success. I share trading signals daily, and all signals have been accurate without error for a full month. Regardless of your past profits or losses, with my assistance, you have the hope to achieve a breakthrough in your investment.
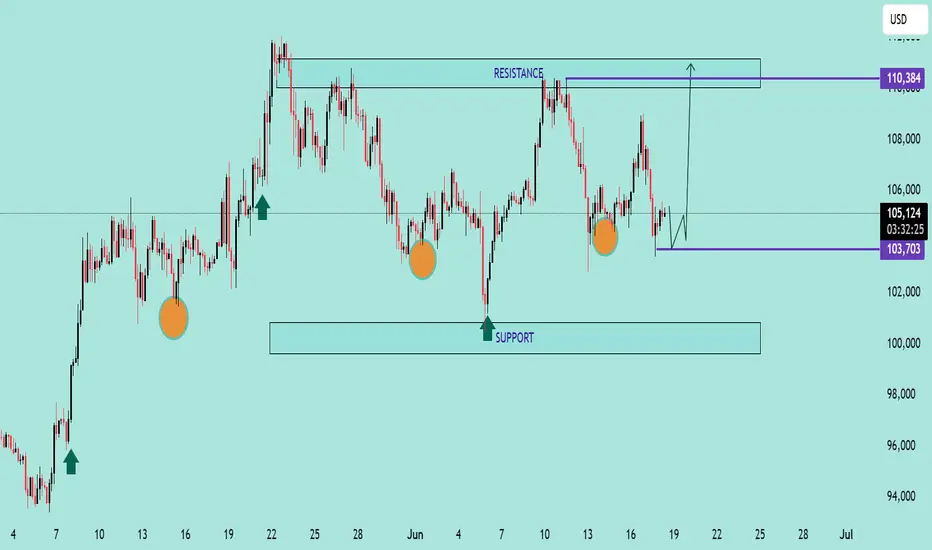
BTC/USD Potential Bullish ReversalBTC/USD Potential Bullish Reversal 🟢📈
🔍 Technical Overview:
The chart shows a potential bullish reversal pattern forming near a key support zone. Price action has consistently bounced from the support range between $100,000 – $103,700, marked by multiple higher lows (🟠 orange circles), suggesting strong buyer interest.
📌 Key Levels:
Support Zone: $100,000 – $103,700 🛡️
Immediate Resistance: $110,384 🔼
Current Price: $105,202 💰
📊 Pattern Observed:
The price structure shows a possible inverted head and shoulders pattern forming, with the right shoulder currently developing. If this structure completes and breaks the $106,000–$107,000 neckline region, we can expect a bullish breakout toward the resistance target of $110,384 or higher.
📈 Bullish Confirmation:
Bullish rejection from support area ✅
Clean structure with repeated higher lows 📈
Potential breakout arrow suggests move toward the top resistance zone
⚠️ Watch For:
Price must hold above $103,700 to maintain bullish bias
Break below this level may invalidate bullish setup and retest the broader support zone near $100,000
📌 Conclusion:
BTC/USD is setting up for a potential upside breakout if the neckline is broken. Traders should monitor for bullish confirmation before entering long positions.
🔔 Strategy Suggestion:
Buy Zone: $103,700 – $104,500 (on bullish confirmation) 🛒
Target Zone: $110,000 – $111,000 🎯
Stop-Loss: Below $103,000 🛑
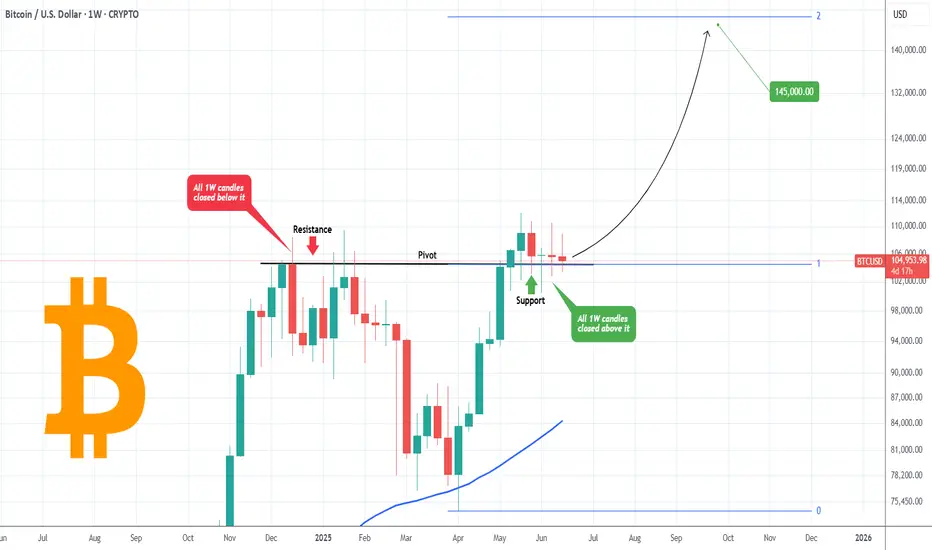
BITCOIN The secret trend-line that no one notices..Bitcoin (BTCUSD) was under heavy selling pressure yesterday and even the 1D time-frame turned marginally bearish. What most seem to ignore however is the larger picture. On the 1W time-frame, BTC has managed to close the last 5 weeks above the Pivot trend-line.
What that trend-line is? It is the level that initially started as a Resistance from December 09 2024 to January 27 2025, closing all 1W candles below it, despite occasional candle wicks breaking above it. That confirmed it's status as a Resistance at the time.
Now we see the opposite, five straight 1W candles closing above that Pivot line. Check in particular, how flat the last two 1W candles closed, showcasing no just the high volatility that the market is under in the past weeks, but also the same amount of sellers and buyers existing in the market (neutral).
This is an indication that this is a consolidation phase, preparing BTC for the next rally. If we place the top Fibonacci level (1.0) on that Pivot, we get the 2.0 Fib extension just above the $145000 mark. That gels perfectly with various other studies we've conducted showing a similar long-term Target.
So do you think the Pivot line will hold and push Bitcoin to $145k? Feel free to let us know in the comments section below!
-------------------------------------------------------------------------------
** Please LIKE 👍, FOLLOW ✅, SHARE 🙌 and COMMENT ✍ if you enjoy this idea! Also share your ideas and charts in the comments section below! This is best way to keep it relevant, support us, keep the content here free and allow the idea to reach as many people as possible. **
-------------------------------------------------------------------------------
💸💸💸💸💸💸
👇 👇 👇 👇 👇 👇
BTCUSD Tests Support—Buy for ReboundBTCUSD opened high and trended lower today 📉, now approaching the support zone—time to buy directly and ride the rebound! 🚀
⚡️⚡️⚡️ BTCUSD ⚡️⚡️⚡️
🚀 Buy@ 105000 - 105500
🚀 TP 106000 - 107500
Accurate signals are updated every day 📈 If you encounter any problems during trading, these signals can serve as your reliable guide 🧭 Feel free to refer to them! I sincerely hope they'll be of great help to you 🌟 👇
BTC Trend Analysis and Trading Recommendations for TodayThe BTC market continues its sideways-down trend, with notably insufficient rebound momentum during the session. Although there were brief signs of stabilization in the early trading, bearish forces continued to exert pressure during the European session, and the index showed a staircase decline.
From the 4-hour chart analysis, the price once fell to touch the middle Bollinger Band support during the Asian session, followed by a technical rebound. However, the rebound strength was obviously weak, encountering strong resistance near the middle band. The current candlestick pattern presents a typical Dark Cloud Cover, the MACD indicator continues to release volume below the zero axis, with fast and slow lines in bearish alignment.
Technically, the price remains significantly pressured near the middle band, and the US session is likely to extend the existing downtrend. Investors are advised to maintain a bearish stance. If the price effectively breaks below the middle band support, the next target is targeted at the lower Bollinger Band. Strategically, fading rallies remains the preferred approach.
BTCUSD
sell@106500-106000
tp:105000-104000
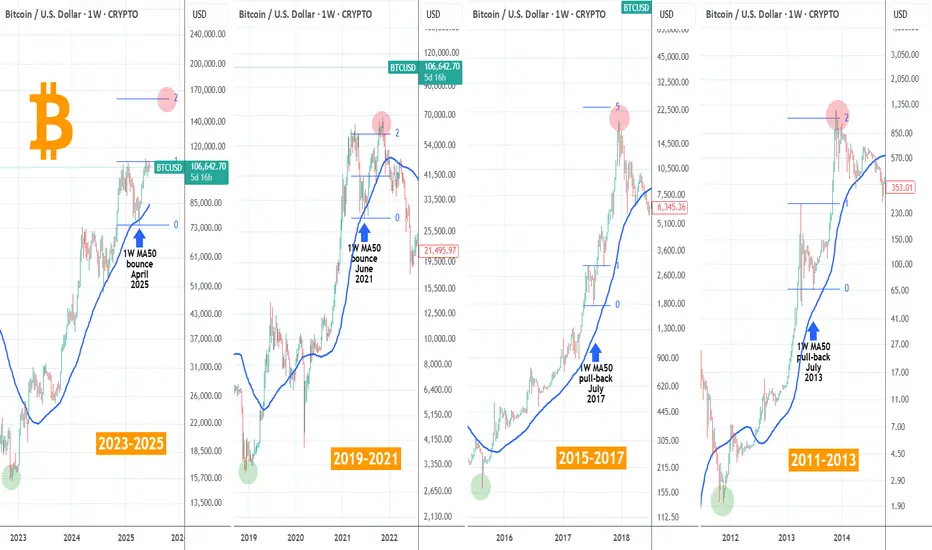
BITCOIN Is exactly where it should be this time on every Cycle!Bitcoin (BTCUSD) has made a new All Time High (ATH) last month, following the April 2025 rebound on the 1W MA50 (blue trend-line). No matter how odd this price action may look to some, BTC is simply replicating the pattern it has during every past Cycle around this time of its final year.
As you can see, besides April 2025, it made 1W MA50 pull-backs and rebounds on June 2021, July 2017 and July 2013. The consistency is remarkable and since we are already now half-way through June, historically Bitcoin only went upwards!
In fact, those pull-backs have been the strongest the market saw before the Cycles peaked on each and every occasion. Two Cycles peaked just above the 2.0 Fibonacci extension while in 2017 it peaked a little below the 5. Fib ext. This indicates that the minimum Cycle Top we can be expecting towards the end of the year is $160000 (marginally below the 2.0 Fib ext).
Many studies point towards the same Target. Do you think it's inevitable? Feel free to let us know in the comments section below!
-------------------------------------------------------------------------------
** Please LIKE 👍, FOLLOW ✅, SHARE 🙌 and COMMENT ✍ if you enjoy this idea! Also share your ideas and charts in the comments section below! This is best way to keep it relevant, support us, keep the content here free and allow the idea to reach as many people as possible. **
-------------------------------------------------------------------------------
💸💸💸💸💸💸
👇 👇 👇 👇 👇 👇
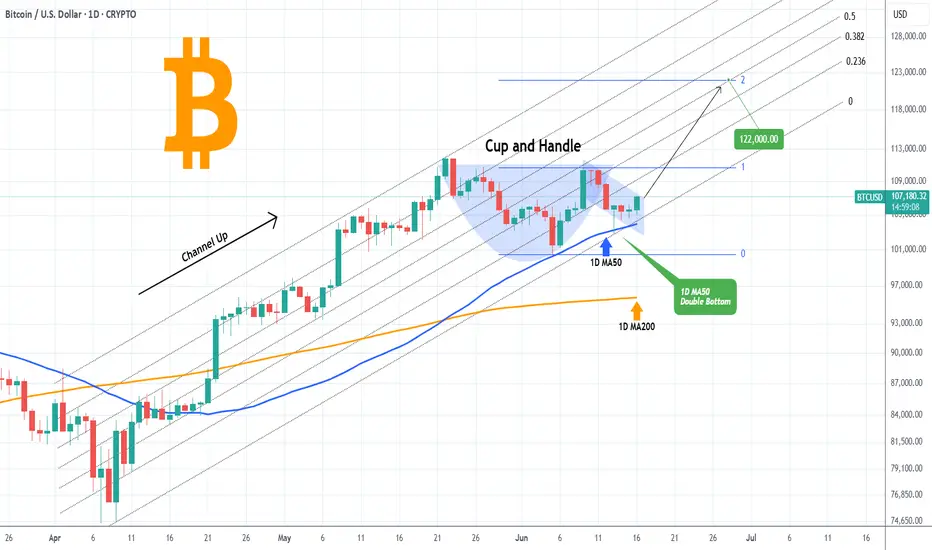
BITCOIN Cup and Handle making double bounce on the 1D MA50.Bitcoin (BTCUSD) is about to complete a Cup and Handle (C&H) formation, having consolidated for almost a month since the May 22 All Time High (ATH). What makes the bullish potential even stronger is that it is rising after making a Double Bottom on the 1D MA50 (blue trend-line) for the first time since October 10 2024.
Given that the long-term pattern is a Channel Up and the 1D MA50 is acting as its natural support trend-line, the Cup and Handle can provide a short-term Target on its 2.0 Fibonacci extension at $122000. On the long-term the Channel Up still has the potential to lead it much higher.
So do you think that 122k is achievable after this Cup and Handle making double bounce on the 1D MA50? Feel free to let us know in the comments section below!
-------------------------------------------------------------------------------
** Please LIKE 👍, FOLLOW ✅, SHARE 🙌 and COMMENT ✍ if you enjoy this idea! Also share your ideas and charts in the comments section below! This is best way to keep it relevant, support us, keep the content here free and allow the idea to reach as many people as possible. **
-------------------------------------------------------------------------------
💸💸💸💸💸💸
👇 👇 👇 👇 👇 👇