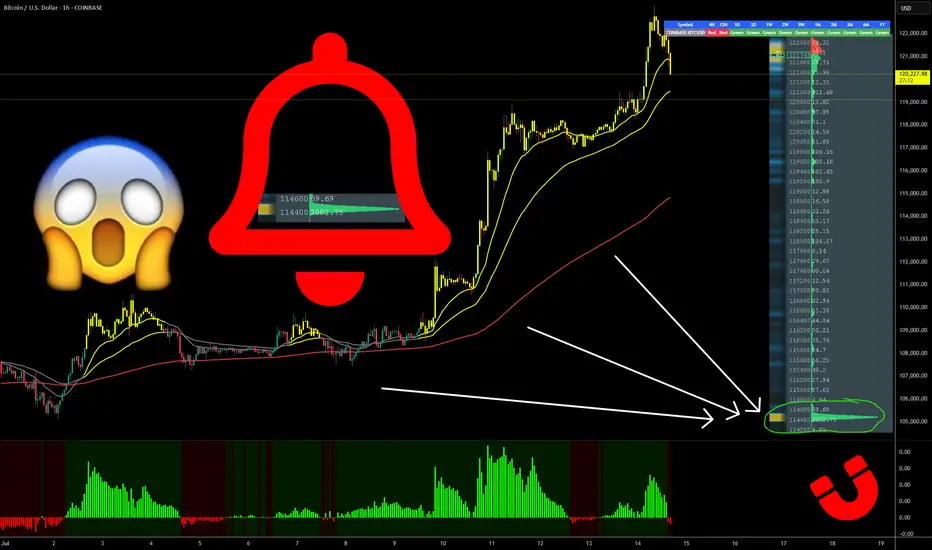
BITCOIN- MONSTER ORDERS IN THE BOOK -> You Know What This Means COINBASE:BTCUSD “Monster orders” are exceptionally large buy-limit orders clustered roughly 7 % beneath the current market price.
Large buy-limit walls can act like a price magnet—deep liquidity attracts algos and traders hunting fills, often pulling price straight toward the level.
Once the wall absorbs the selling pressure, the magnet flips: liquidity dries up, supply thins, and price can rip away from that zone with force.
They create a visible demand wall in the order book, signalling that whales / institutions are ready to absorb a dip and accumulate at that level.
Price will often wick into this zone to fill the wall, then rebound sharply—treat the 7 % band as potential support or entry.
Such walls can act as liquidity traps : market makers may push price down to trigger retail stop-losses before snapping it back up.
Confirm that the wall persists as price approaches and that spot + derivatives volume rises; if the wall disappears, it may have been spoofing.
Always combine order-book context with trend, momentum and higher-time-frame support for higher-probability trades, Just like the extremely powerful indicators on the chart.
🚀 Marty Boots | 17-Year Trader — smash that 👍, hit LIKE & SUBSCRIBE, and share your views in the comments below so we can make better trades & grow together!
BTCUSDT
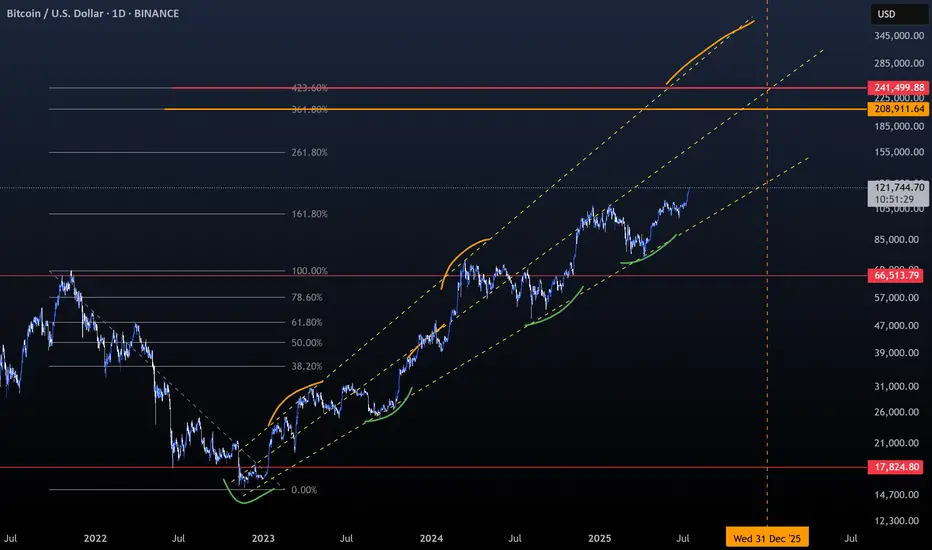
Bitcoin -> The bullrun is not over!📣Bitcoin ( CRYPTO:BTCUSD ) is still totally bullish:
🔎Analysis summary:
A couple of months ago Bitcoin broke above the previous all time high. This was basically just the expected creation of new highs, perfectly following the underlying cycles. With respect to the long term rising channel formation, this bullrun on Bitcoin is just starting.
📝Levels to watch:
$100.000
🙏🏻#LONGTERMVISION
Philip - Swing Trader

BTC/USDT Trade Update – July 16🚨 BTC/USDT Trade Update – As Planned! 🚨
Shared this setup earlier, and it’s unfolding exactly as expected. Hope you’re all locking in solid profits! 💸
🔹 Entry: BUYER STEP‑IN zone at 116.5 K – 118 K
🔹 Confirmation: Strong bullish engulfing from demand + reclaim of 118 K
🔹 Current Price: 119 K+ and climbing
🔹 Targets Ahead: 120.7 K 🔜 122 K 📈
📌 Why it’s working:
• Demand absorption after liquidity sweep
• V‑shaped recovery forming a higher low
• Increasing momentum + follow‑through volume
🔥 Riding the wave—letting profits run!
🔔 For more real‑time setups, follow 👉 @Ali15349323
#BTC #Bitcoin #CryptoTrading #PriceAction #Profits #TradingView

Bitcoin Prediction that will blow your mind (warning for bulls) I am showing you that BTC made new ATH only in the USD pair and not in other pairs like EUR, and why, and what you can anticipate and what to watch out for from #Bitcoin next.

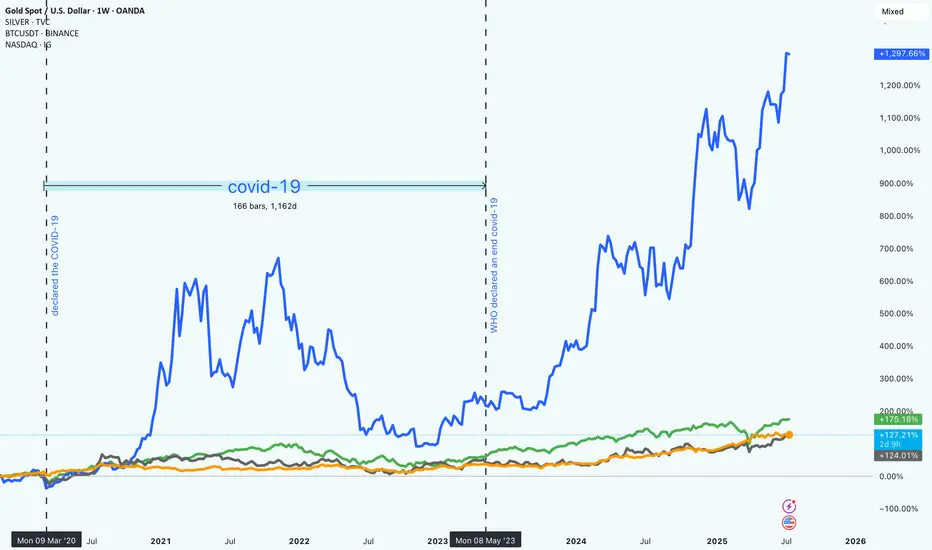
Market Trends from 2020 to 2025How Bitcoin, NASDAQ, Gold, and Silver Really Performed Since 2020
It’s been a wild few years in the markets. From early 2020 to mid-2025, investors have had to navigate uncertainty, changing interest rates, tech booms, and the rise of digital assets. Looking back, it’s clear that some assets took off while others just quietly held their ground.
So, what happened if you had invested in Bitcoin, the NASDAQ, gold, or silver five years ago?
Bitcoin (BTC): +1,297.87%
No surprise here. Bitcoin absolutely stole the show. Despite all the ups and downs (and there were plenty), BTC ended up with nearly 1,300% gains. It had a huge surge in late 2020 and 2021, crashed hard, and then climbed even higher starting in 2023.
This kind of return doesn’t come without risk. Bitcoin was by far the most volatile of the group. But for those who held on, the reward was massive. It also marked a big shift in how people think about money and investing.
"Crypto is no longer just a fringe idea."
NASDAQ: +175.26%
Tech stocks had a strong run, too. The NASDAQ gained around 175%, driven by innovation, digital expansion, and eventually, the AI boom. While there were some bumps along the way (especially when interest rates went up), the general trend was up and to the right.
Unlike Bitcoin, the NASDAQ was more predictable, less explosive.
Gold: +127.39%
Gold did what gold usually does. It held its value and slowly moved higher. Over five years, it returned about 127%, which is pretty solid for a “safe haven” asset. It didn’t grab headlines like crypto or tech stocks, but it stayed reliable through the chaos.
Silver: +124.50%
Silver had a similar story to gold, but with a bit more fluctuation. It benefited from both investor demand and industrial use, and it ended up with just over 124% in gains. Not bad for a metal that often gets overshadowed by its shinier cousin ;).
What It All Means
If you were in Bitcoin, you saw huge gains, but also had to stomach major volatility. Tech investors did well too, especially those who stayed in through the dips. Meanwhile, gold and silver offered steadier, more defensive returns.
One big takeaway: the investment landscape is changing. Traditional assets still matter, but new ones like crypto are reshaping what portfolios can look like.
In the end, it’s about balancing risk and reward!
and figuring out what kind of investor you are.
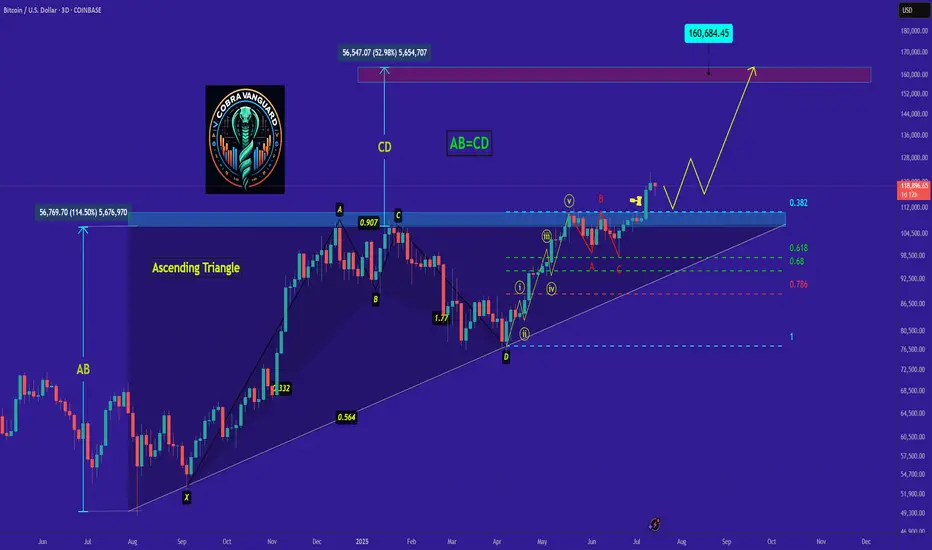
Do you think I'm joking ???As I said, Bitcoin broke the triangle, and now with a slight price correction, it could surge to $160,000, and you still think I'm joking!!
Previous analysis
Best regards CobraVanguard.💚
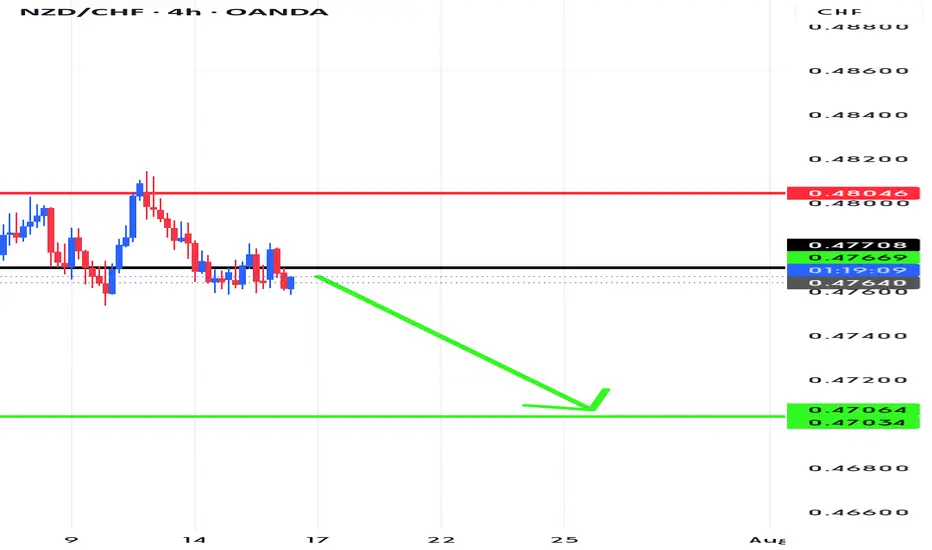
Is this movement happening in the CADCHF currency?
Hi dears
The currency seems to be in a downward trend. This currency is useful for those looking for a long-term trade.
If you like my analysis, just follow me 😄
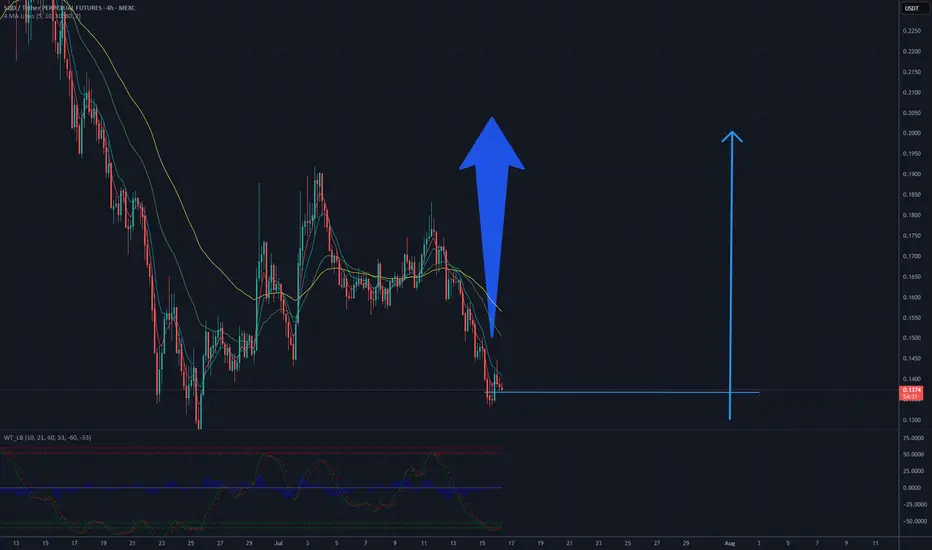
SQD/USDT – Bullish Reversal in Sight with Target at $0.20After a prolonged downtrend, SQD/USDT has reached a significant support zone between $0.13–$0.137, where a local bottom appears to be forming. The WT_LB oscillator is showing a positive divergence — price is making lower lows while the indicator is making higher lows — which often signals a potential reversal. The price is beginning to consolidate above the support, with early signs of strength emerging through small breakouts. If the pair breaks above the $0.15–$0.16 resistance range, momentum could accelerate, potentially driving the price toward the $0.20 target, aligning with the previous high from early July.
Potential TP: 0.20 USD
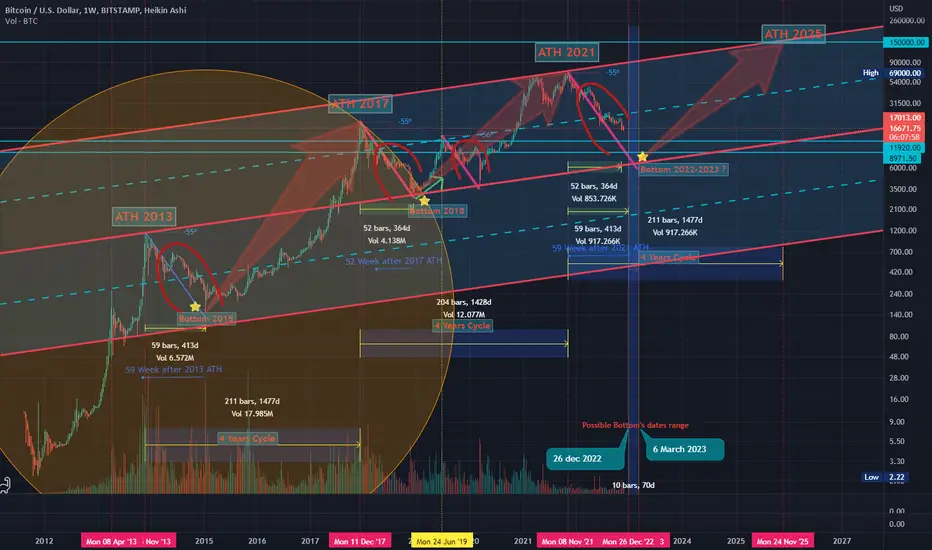
BTC Bottom & New ATH..... when ?!!! Hello Guys
There are some notes of BTC weekly Chart:
1. We have a new ATH every 4 years ( 1428-1477 ) days..
2. After the ATH we take about ( 52-59 ) weeks to make a new bottom then we go up a little ...
3. Every time we reach a new ATH we drop down in a same angle (-55) before the new bull run starting .... look at my chart ( Red angles and curves ):
****** We dropped from ATH 2013 to Bottom 2015 by an angle ( -55 ) .
****** We dropped from ATH 2017 to Bottom 2018 by an angle ( -55 ) .
****** Same (24 July 2019) we dropped from local top to the local bottom by Angle ( -56 ) .
****** Will we drop from ATH 2021 to Bottom (2022 - 2023) by the same angle ( -55 or -56 )??
4. In my opinion , I expect we will reach the final bottom between ( 26 December 2022 : 6 march 2023 ).
5. I don't care what will be the price of BTC then , but I care only for when will be the possible bottom !!.
But if we can try to expect the price it will be in a range of ( 11900 : 9000$) ...
Note:( 10K - 10500$) is very very strong demand area for BTC .
-------------------------------------------------------------------------------------------------------------------------------------------------------------------------------------------------------
Finally , I think the new ATH will not be before Nov 2025 ( 150k $ ).
It is not a financial advice , I am only share my thoughts with u :)
Thank u and good luck.
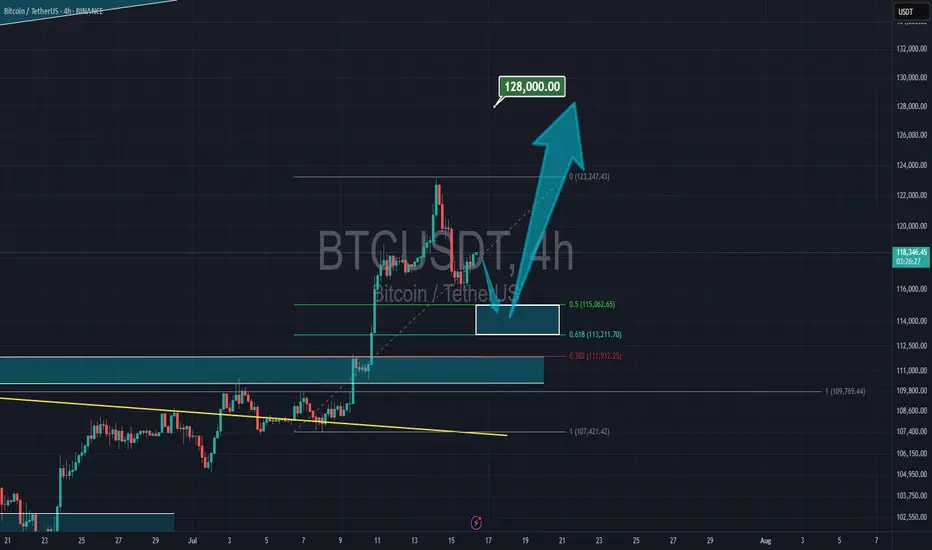
Bitcoin to 128kThere is a strong support between 113k to 115k for Bitcoin, as you see that is the 61% of the Fibonacci, and it is just the start for the rally.
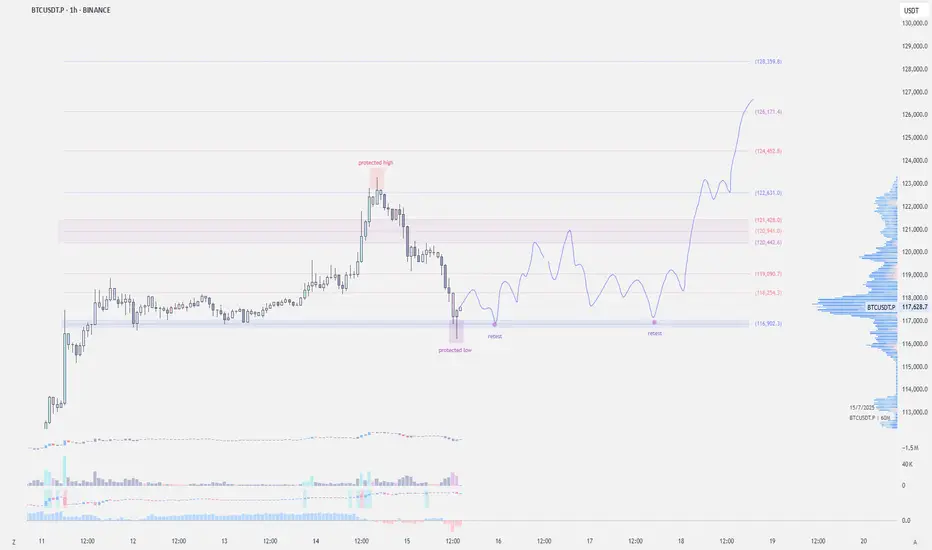
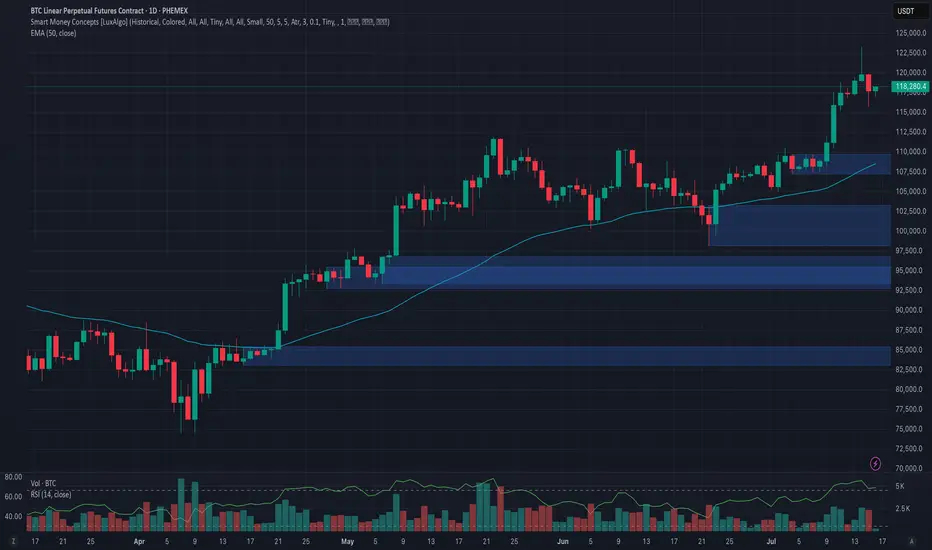
Phemex Analysis #97: What's Next for Bitcoin, After $123k?!Bitcoin ( PHEMEX:BTCUSDT.P ) recently made history by hitting an all-time high of $123,251 on July 14, 2025. However, enthusiasm was quickly tempered as BTC retraced by approximately 6%, dropping sharply to around $115,696 on July 15. Currently, the price has partially recovered and is trading at about $118,200.
With the market sentiment at a pivotal juncture following this volatile movement, traders and investors are carefully considering their next steps. Let's dive into several possible scenarios that might unfold in the coming days.
Possible Scenarios
1. Bullish Continuation (Breakout Above $123k)
If Bitcoin quickly regains bullish momentum, it may retest and surpass its recent high at $123,251. Breaking decisively above this resistance could trigger another strong rally, driven by renewed market optimism and potential institutional inflows.
Pro Tips:
Entry Strategy: Look to open or add to existing positions upon confirmation of a clear breakout above $123,251, especially if accompanied by high trading volume.
Profit Targets: Key resistance zones for profit-taking after a breakout include psychological levels at $128,000, and the significant milestone at $130,000.
Risk Management: Use protective stop-loss orders placed below the recent low around $115,000 to manage downside risks effectively.
2. Extended Consolidation (Range-Bound Scenario)
Bitcoin could enter a period of price consolidation, fluctuating between support at approximately $115,000 and resistance near $123,000. This scenario often occurs when the market awaits clearer directional cues.
Pro Tips:
Range Trading: Employ a grid-trading strategy, placing buy orders near support ($115,000–$116,000) and sell orders around resistance ($122,000–$123,000) to maximize profits from short-term volatility.
Monitoring Indicators: Keep an eye on declining trading volume, which often signals the potential for an upcoming breakout or breakdown.
3. Bearish Pullback (Correction Scenario)
Given the rapid recent surge to all-time highs, a deeper market correction remains possible. If BTC decisively breaks below support at $115,000 with strong selling pressure, further declines towards $107,218 or even $98,132 could ensue, especially if accompanied by negative broader market sentiment.
Pro Tips:
Short Opportunities: Experienced traders might explore short positions if BTC convincingly breaks below the $115,000 support level.
Accumulation Strategy: Long-term investors can strategically accumulate positions around significant lower support levels such as $107,218 and $98,132, provided price stabilization signals are evident.
Conclusion
Bitcoin is currently at a crucial technical and psychological level after hitting its latest all-time high. Traders should closely monitor the outlined scenarios—particularly watching key resistance at $123,251 and essential support at $115,000. By utilizing disciplined risk management, proactive profit-taking strategies, and careful market analysis, investors can effectively navigate BTC’s ongoing volatility and strategically position themselves for the next significant move.
🔥 Tips:
Armed Your Trading Arsenal with advanced tools like multiple watchlists, basket orders, and real-time strategy adjustments at Phemex. Our USDT-based scaled orders give you precise control over your risk, while iceberg orders provide stealthy execution.
Disclaimer: This is NOT financial or investment advice. Please conduct your own research (DYOR). Phemex is not responsible, directly or indirectly, for any damage or loss incurred or claimed to be caused by or in association with the use of or reliance on any content, goods, or services mentioned in this article.
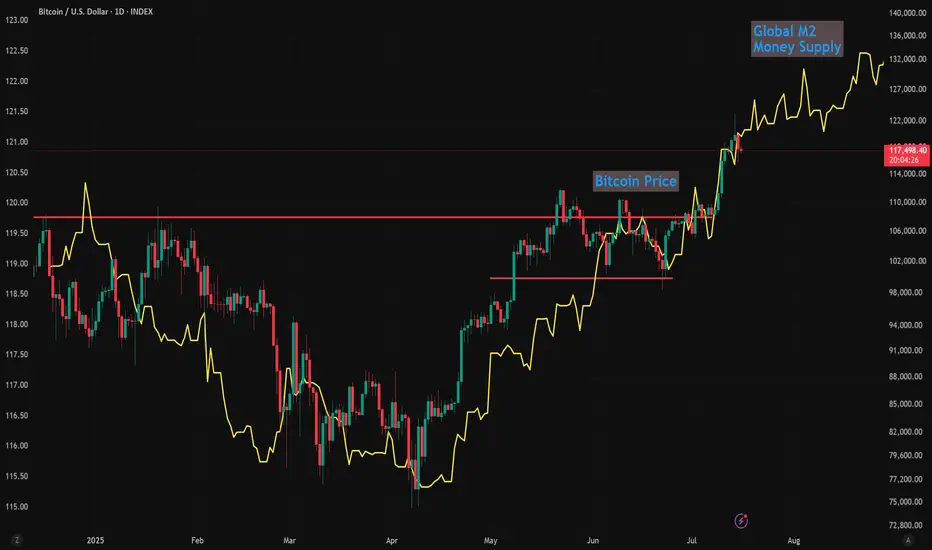
Global M2 Money Supply (70/84/90 Day offset) and $150k BTCI'm using Global M2 slightlty different than most here, and showing it behaves differently during different periods of the cycle.
Many people say M2 leads Bitcoin by 10-12 weeks (70 - 84 Days) and I've seen periods where it does... But in this phase of the bull-run 90 days is working best.
We can see the dip in M2 around now coinciding with the drop in Bitcoin prices.
Of course, these are not directly correlated and can't be relied upon as predictive.
But it's following pretty close, and overall looks great for further upside!
I'll follow up with a video on this if anybody is interested.
BITCOIN PULLBACK 110.000🔹 The uptrend remains intact
After setting a new high, the price may enter a mild correction toward the $110K zone.
Key support levels in this uptrend are:
✅ $115K
✅ $110K
✅ $105K
As long as the price holds above $105K, any pullback is considered healthy and the uptrend is likely to continue.
📊 A shallow correction is part of a healthy market structure.
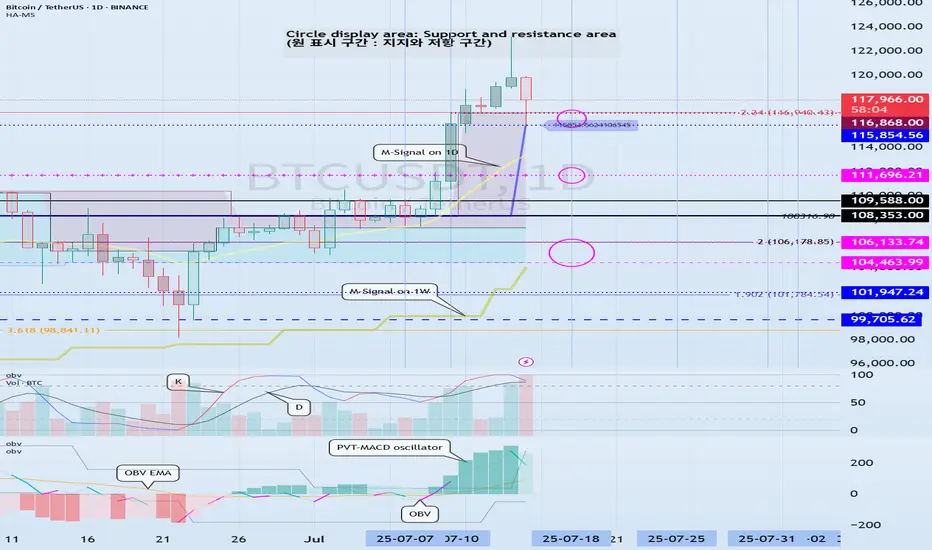
Support and resistance zones: 115854.56-116868.0
Hello, traders.
Please "Follow" to get the latest information quickly.
Have a nice day today.
-------------------------------------
(BTCUSDT 1D chart)
This decline created a new trend line.
This added a period of volatility around July 31st.
If the HA-High indicator is generated at the 115854.56 point, the key is whether it can be supported and rise around that point.
If it falls below the HA-High indicator, there is a possibility of a downward trend.
Therefore, it is necessary to look at which support and resistance points the price is maintained at as it passes the volatility period around July 18 (July 17-19).
-
Since the StochRSI 80 indicator is formed at the 116868.0 point, it is important to be able to maintain the price above 116868.0 if possible.
Therefore, assuming that the HA-High indicator will be generated at the 115854.56 point, the key is whether there is support around 115854.56-116868.0.
Next, since the M-Signal indicator on the 1D chart is rising above 116696.20, we need to check if it is supported by the M-Signal indicator on the 1D chart or around 116696.21.
-
So far, we have talked about how to maintain an upward trend by breaking through a certain point or section.
That is,
- The K of the StochRSI indicator should be below the overbought section and should show an upward trend with K > D.
- The PVT-MACD oscillator indicator should show an upward trend. (If possible, it should be above the 0 point.)
- The OBV indicator of the Low Line ~ High Line channel should show an upward trend. (If possible, it should be maintained by rising above the High Line.)
I said that when the above conditions are met, there is a high possibility that the upward trend will continue.
On the other hand, in order to change to a downward trend,
- The DOM (60) indicator should be created and show resistance near the DOM (60) indicator.
- When the HA-High indicator is generated, it should show resistance near the HA-High indicator.
- When the K of the StochRSI indicator falls from the overbought zone, it should switch to a state where K < D and show a downward trend. (However, caution is required as volatility may occur when K reaches around the 50 point.)
- The PVT-MACD oscillator indicator should show a downward trend. (If possible, it is better if it is located below the 0 point.)
- The OBV indicator of the Low Line ~ High Line channel should show a downward trend. (However, it should show a downward trend in the state where OBV < OBV EMA is present.)
When the above conditions are satisfied, there is a high possibility of a downward trend.
Among these, the most intuitive thing to know is whether the DOM (60) indicator and the HA-High indicator are generated.
This is because, in order to first switch to a downward trend, a signal that the current price position is a high point must appear.
The DOM(60) indicator is an indicator that indicates the end of the high point.
Therefore, if the DOM(60) indicator is generated, it is likely to be a high point.
However, since it can be supported and rise near the HA-High indicator, you should check whether there is support in the HA-High ~ DOM(60) section and respond accordingly.
The HA-High indicator is an indicator created for trading on the Heikin-Ashi chart, and if it falls below the HA-High indicator, it is likely to be a point where a downtrend will begin.
-
Since the same principle applies to any time frame chart you trade, it is easier to understand the chart and determine the timing of the start and end of the transaction.
However, the basic trading method must be a split trading method.
The reason is that if it rises in the HA-High ~ DOM(60) section, it is likely to show a stepwise upward trend, and if it falls in the DOM(-60) ~ HA-Low section, it is likely to show a stepwise downward trend.
This basic trading method, that is, buying near the HA-Low indicator and selling near the HA-High indicator, will eventually make you familiar with day trading, which will have an effective influence on finding a buying point when making mid- to long-term investments.
It is wrong to say that you are good at mid- to long-term investments when you are not good at day trading.
You were just lucky.
Unfortunately, this kind of luck cannot last.
-
Thank you for reading to the end.
I hope you have a successful transaction.
--------------------------------------------------
- This is an explanation of the big picture.
(3-year bull market, 1-year bear market pattern)
I will explain more details when the bear market starts.
------------------------------------------------------
#BTCUSDT(BITCOIN): Another Small Correction And Bounce Straight Bitcoin reached a record high of 125k, but then its price started to drop and is currently trading at 115k. We expect the price to reverse from the 110k area and continue its bull move towards the potential next target of 150k. Keep an eye on the price to see if it falls below our area of interest.
Good luck and trade safely!
Team Setupsfx_
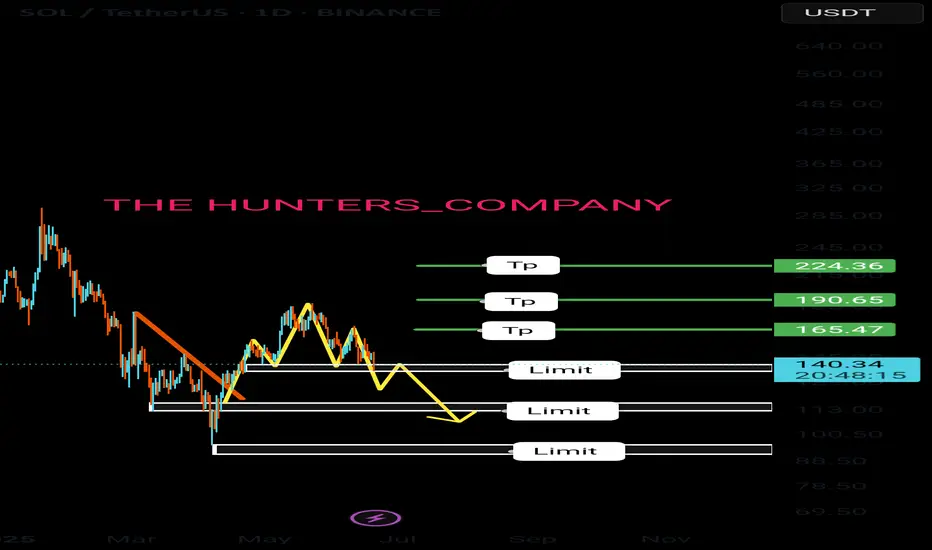
Solana:Daily free signalhello friends👋
As you can see, after the drop that we had, insider buyers showed and were able to support the price well.
But it was not enough, and as you can see, a noisy pattern has formed, which can indicate a further decrease in the price.
Now we can take advantage of this opportunity and make step-by-step purchases with risk and capital management in the support areas that we have obtained for you and move to the specified goals.
🔥Follow us for more signals🔥
*Trade safely with us*
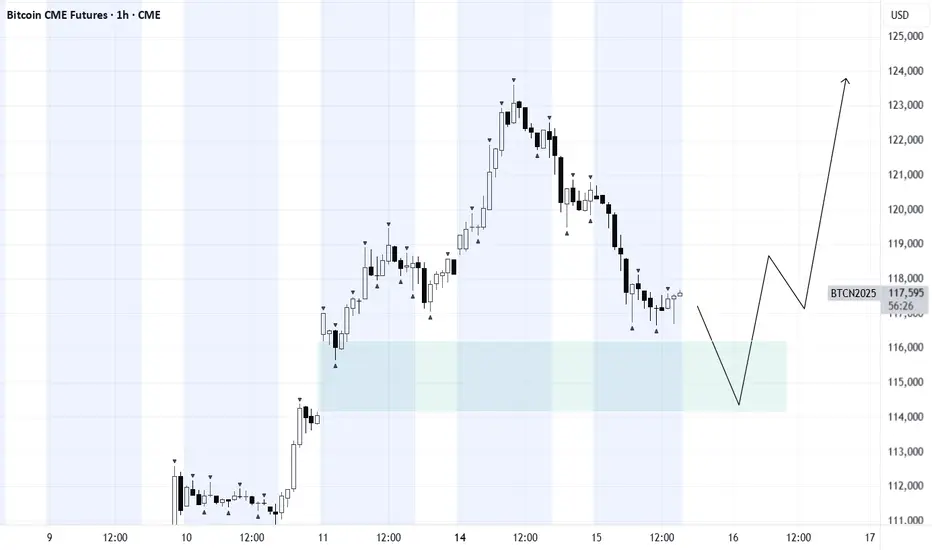
BTCA gap is currently in play. For further upside, it would be healthy to see a full or partial fill in the near term, followed by a strong reaction.
Such a move would signal strength and validate bullish momentum.
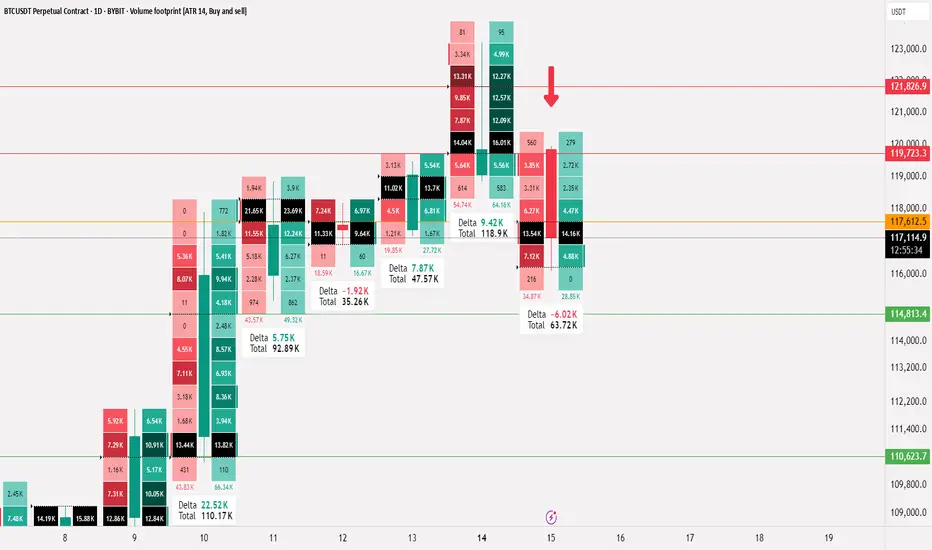
BTCUSDT.P liquidity analysis🟠 CRYPTOCAP:BTC
📄 This analysis is for liquidity and comparing supply and demand ratios
🚨 We start by noting that actual selling pressure began at 121826 and this ratio increased as it dropped below 119723
📄 Any daily close below 117612 will increase this pressure, which is logical after such a rise, specifically in Bitcoin
⭕️ The two closest important levels with liquidity and buying strength are at 114813 and 110623
◀️ The current rebound from 116114 (the lowest point Bitcoin has reached currently at the time of writing this analysis) is insufficient in terms of liquidity and needs more momentum, and attention here should be on the level 117612
📄 The current movement is between 117612 - 114813, the range where Bitcoin stabilized before achieving the historical peak, and thus maintaining this range will provide a boost for a larger rise
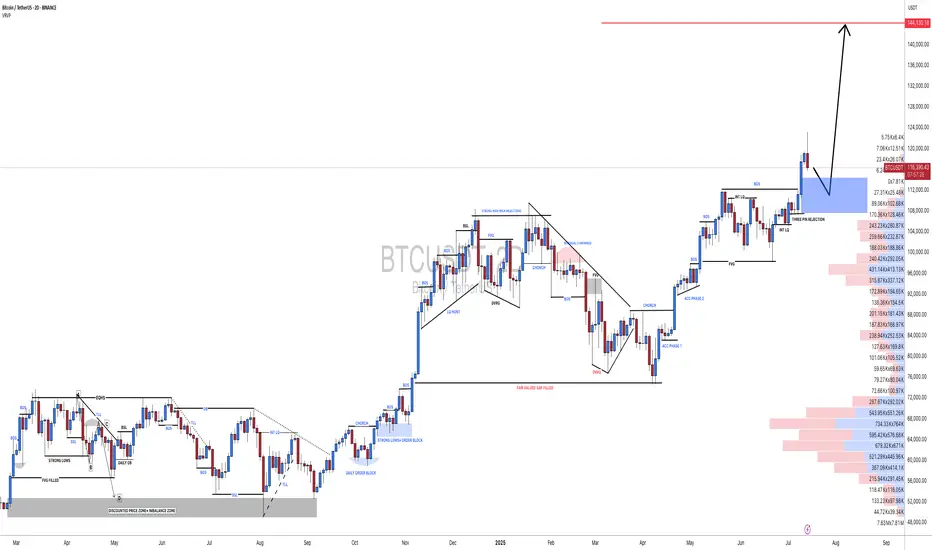
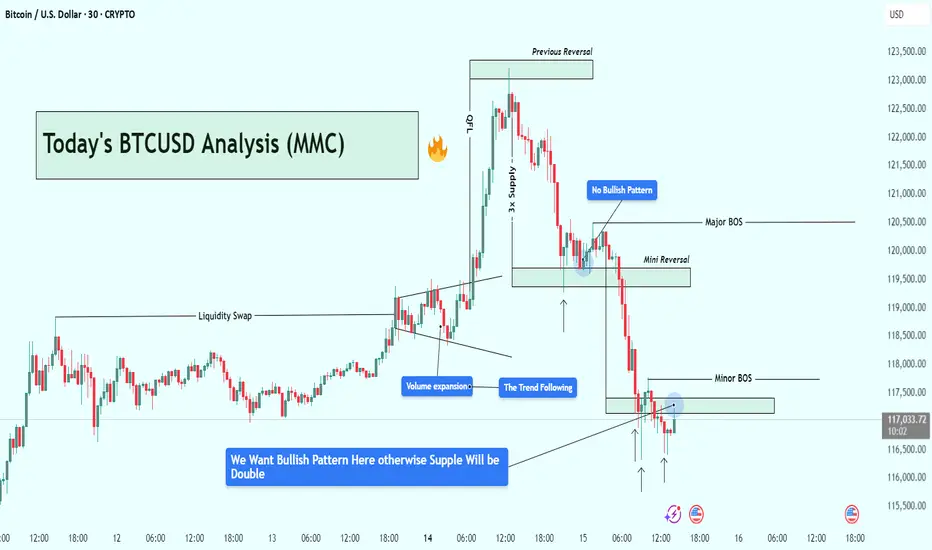
BTCUSD Analysis : Bitcoin Trend Shifted/Bullish Pattern + Target🧭 Overview:
Bitcoin’s recent price action has delivered a textbook sequence of institutional liquidity play, volume-driven breakout, and supply zone rejection. After rallying on increasing volume, BTC tapped into a significant 3x Supply Zone—which also served as a previous reversal point—and was swiftly rejected. The market is now trading around a key decision zone where traders must stay alert for a confirmed bullish reversal, or risk getting caught in further downside.
🔍 Step-by-Step Technical Breakdown:
🔸 Liquidity Grab + Volume Expansion
The move began with a liquidity sweep, as BTC pushed above recent highs, hunting stop-losses and inducing breakout traders. This kind of price manipulation is typical of smart money accumulation/distribution zones.
Immediately following that, we observed a volume expansion—a strong signal that institutional players had stepped in, propelling BTC upward with conviction. This expansion pushed price sharply into the 3x Supply Zone, a critical zone of interest from a previous bearish reversal.
🔸 3x Supply Zone – The Turning Point
Once price entered the 3x Supply Zone, bearish pressure resumed. No bullish continuation pattern appeared on the second attempt into this zone—confirming that sellers were defending it aggressively. This area has now been validated as a strong supply barrier, capable of initiating trend reversals.
🔸 Major BOS – Structural Shift Confirmed
Price broke below key support around $120,500, which marked a Major Break of Structure (BOS). This BOS is crucial—it represents a shift from a bullish to bearish market structure and is often the signal that retail longs are trapped.
This BOS was followed by a mini reversal zone, but again, no bullish confirmation appeared there—highlighting market weakness.
🔸 Minor BOS & Trendline Breakdown
Further downside action led to a Minor BOS near $117,800, reinforcing the bearish sentiment. Additionally, the ascending trendline—which had supported BTC’s rally—was decisively broken and retested from below. This confirms a shift in momentum, now favoring sellers.
📍 Current Price Action – Critical Decision Zone
BTC is currently hovering around $117,000, right at a potential demand zone. While there was a brief bullish reaction, the market hasn’t formed a valid bullish reversal pattern yet.
There’s a clear message from the chart:
“We want a bullish pattern here—otherwise, support will break and supply will double.”
In simple terms, unless bulls step in with structure (higher low, engulfing candle, etc.), sellers will likely take over, and price may test deeper support levels.
🎯 What to Watch Next:
✅ Bullish Case:
If BTC forms a strong reversal pattern (e.g., double bottom, bullish engulfing, or inverse head & shoulders), we can expect a short-term recovery back to:
Target 1: $118,500
Target 2: $120,000–$120,500
❌ Bearish Case:
Failure to hold this zone and no clear bullish pattern = likely continuation to the downside, potentially targeting:
$116,000
Even $114,500 in extended moves
🧠 Trading Insights (Educational):
Volume + Structure = Edge
Don’t rely solely on candlestick signals—combine them with structural breaks and volume to get confluence.
Supply Zones Aren’t Just Rectangles
The 3x Supply Zone was powerful because it had historical context, volume convergence, and psychological resistance. These layered factors make zones more reliable.
BOS Isn’t a Trendline Break
BOS means real structural shift. In this case, lower highs and lower lows confirmed the change.
💡 Final Thoughts:
BTC is at a make-or-break level. The recent rejection at the 3x supply zone has shifted the momentum, and buyers must prove their strength now—or risk watching the price unravel further.
Stay patient, wait for structure, and never fight momentum.
BTC BIG SHORT!We did a mirror retest, and many other signals also point to a sharp decline, indicating numerological codes 69/96.
Bitcoin Early, Not LateA simple graphic with all annotations included :
- Trend.
- Fibonnacci.
- Middle Line.
- Support and Bounces.
- Resistances and dips.
- Everyone gets Bitcoin at the price they deserve.
- Not a price Prediction, keep things simple.
Happy Tr4Ding !
BTCUSDT. Current scenario range Current scenario range — can shift depending on how the market reacts next.
This analysis is based on the Initiative Analysis concept (IA).
Wishing you profitable trades!

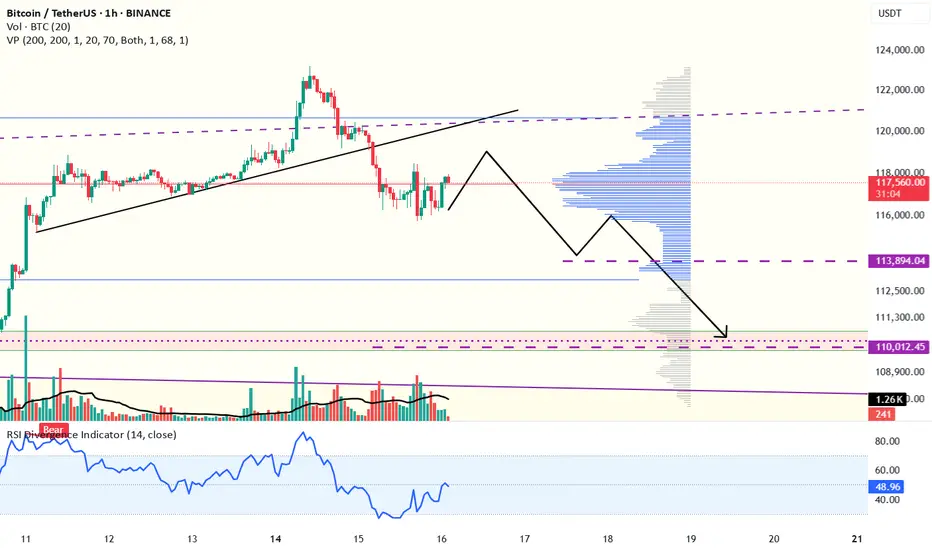
$BTC - LTF OutlookCRYPTOCAP:BTC | 1h
We're establishing a new value area here
Looking at a potential ltf setup:
If 116.5k holds as base support, targeting a move toward 120.5k–121.4k (immediate supply zone)
Similar to past price action, we might see a few pushes before breaking through ltf supply.