PALANTIR REMAINS YOUR TRADING GOAL, DOUBLING IN PRICE IN 2025In the Faraway Kingdom... In the Thirtieth Realm....
Somewhere in another Galaxy.. in late December, 2024 (yet before The Second Coming of Trump), @TradingView asked at it awesome Giveaway: Happy Holidays & Merry Christmas .
1️⃣ What was your best trade this year?
2️⃣ What is your trading goal for 2025?
Here's what we answered:
1️⃣ What was your best trade this year?
- Surely Palantir NASDAQ:PLTR 💖
I followed Palantir all the year since January, 2024, from $16 per share, watch here .
Current result is 5X, to $80 per share.
Also I added more Palantir after SP500 Index inclusion in September 2024 watch here .
Current result is 2.6X, from $30 to $80 per share.
2️⃣ What is your trading goal for 2025?
- Once again, surely Palantir NASDAQ:PLTR 💖
It's gone 7 months or so... (Wow... 7 months really? 😸😸😸)
Let see what's happened next at the main graph of Palantir stock, to LEARN WHY PALANTIR REMAINS THE TRADING GOAL, DOUBLING IN PRICE IN 2025...
Palantir stock remains an attractive trading goal for several compelling reasons rooted in its strong market performance, innovative technology, and robust growth prospects, particularly in the artificial intelligence (AI) sector.
1. Exceptional Stock Performance and Momentum.
Palantir Technologies has been one of the best-performing stocks in 2025, surging over 80% in the first half of the year alone, vastly outperforming the S&P 500’s modest 5.5% gain. The stock recently hit all-time highs around $149, reflecting a nearly 400% increase year-over-year, underscoring its strong momentum and investor enthusiasm. This surge positions Palantir as a top AI stock to watch, attracting both retail and institutional investors, including conservative entities like the Czech National Bank.
2. Leadership in AI and Data Analytics.
Palantir is not just a data analytics company; it has transformed into a major AI software provider with its Artificial Intelligence Platform (AIP). This platform extends beyond government contracts into commercial sectors such as healthcare, energy, and automotive, fueling significant revenue growth. The company reported a 39% revenue increase to $883.9 million in Q1 2025, driven largely by AI adoption. Its AI platform is gaining traction globally, with many companies rapidly adopting Palantir’s software through short training bootcamps, demonstrating scalable and fast integration.
3. Strong Government and Commercial Contracts.
Palantir’s roots in government intelligence and defense continue to be a significant revenue driver. The U.S. government division alone generated $373 million in Q1 2025, with overall government revenue up 45% year-over-year. Strategic partnerships, such as with Accenture to streamline federal operations and projects like the U.S. Navy’s ‘Warp Speed for Warships,’ highlight Palantir’s expanding footprint in critical government sectors. Simultaneously, the commercial segment is booming, with revenue soaring 71% to $255 million in Q1 and projected to reach $1.178 billion in 2025.
4. Financial Health and Growth Outlook.
Palantir’s financials are strengthening, with no debt and adjusted free cash flow more than doubling to $370.4 million in the recent quarter. Analysts forecast the company’s revenue to exceed $3.5 billion in 2025, up from $2.23 billion the previous year, and project potential revenue of $7 billion by 2028. Operating margins are improving, with a recent quarter reporting a 26% margin, the highest in company history. This solid financial foundation supports further investment in AI innovation and market expansion.
5. Market Position and Competitive Edge.
While Palantir competes with tech giants like Microsoft, Amazon, and Google in the AI and data analytics space, it has carved out a unique niche with its specialized government contracts and AI-driven software solutions. Its ability to integrate complex datasets for real-world operational use distinguishes it from competitors, fostering a loyal investor base and a "cult-like" following among retail investors.
6. High Valuation Reflects Growth Expectations.
Despite a high price-to-earnings ratio (PE around 621), reflecting elevated expectations, many analysts remain optimistic about Palantir’s long-term potential due to its rapid growth and expanding AI capabilities. The company’s market capitalization has soared above $330 billion, surpassing many established corporations, signaling strong market confidence.
7. Palantir stock is a compelling trading goal because it combines robust growth, cutting-edge AI technology, strong government and commercial contracts, and solid financial health.
8. In conclusion, Palantir remarkable stock performance and strategic positioning in the booming AI sector make it a promising investment for traders seeking exposure to transformative technology with significant upside potential.
9. ...and yet, Palantir performance since inception (It ultimately went public on the New York Stock Exchange through a direct public offering on September 30, 2020) is better, rather then Bitcoin.
--
Best wishes,
@PandorraResearch Team 😎
BTCUSDT

Retail in?After almost 3 decades as a trader, if there is one thing I have learned over the years, significant highs are made when sentiment is at extremes. Whether it is "mom and pop" or the "shoeshine guy" calling the top, it's when the buying (or selling) by retail is at a fever pitch. These days, you can't find a bear in Bitcoin, and the days on end of reports preaching "record inflows" is almost deafening.
Technically, Bitcoin is probing some key resistance today. It's stalled by the 161% Fibonacci extension of the recent early May highs to June lows. More importantly is the 127% extension of the January highs to April lows. RSI is very divergent as price hits new highs. And with sentiment at near extremes, bulls should be careful now. And a break back below the 112k level would be a very bearish "topping pattern" event.
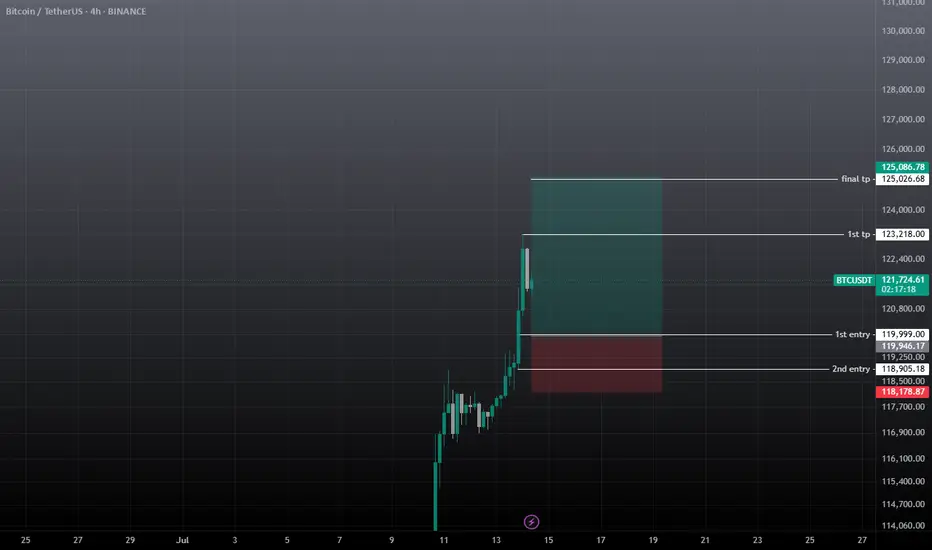
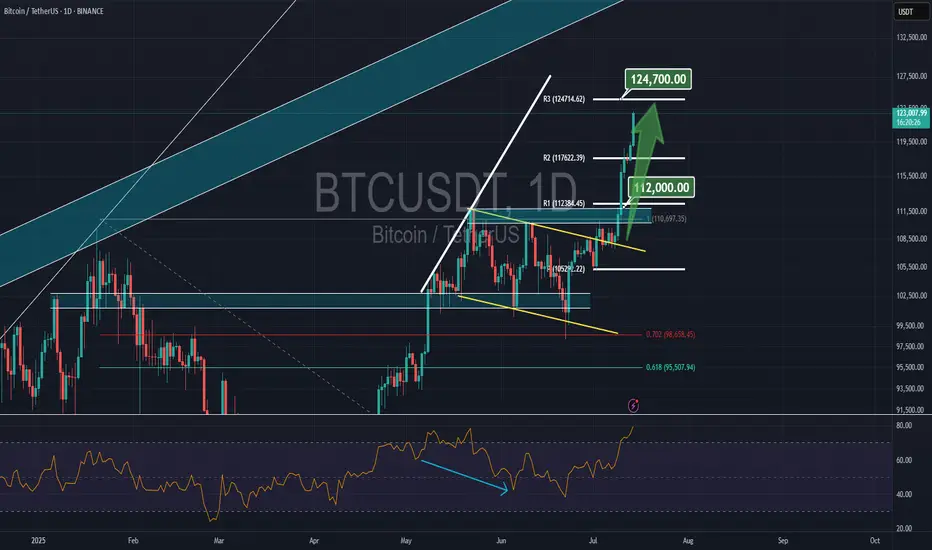
BTC-----Buy around 121100, target 121800 areaTechnical analysis of BTC contract on July 14:
Today, the large-cycle daily level closed with a small positive line yesterday, the K-line pattern continued to rise, the price was above the moving average, and the attached indicator was running in a golden cross. The overall trend is still very obvious, and it can be seen from the overall trend that the retracement is very small. After the shock correction in the two trading days over the weekend, it rose strongly again during the day and broke through the previous high position, so we keep the main idea of buying on retracement in trading; the short-cycle hourly chart intraday price broke upward, the starting point was 118880 area, the current price is consolidating at a high level, the K-line pattern continued to rise, and the attached indicator was running in a golden cross. If we look at the continuation of the high closing today, two conditions must be met: the European market price broke through the intraday high; the retracement cannot break the starting point, otherwise it will be difficult to fall.
Today's BTC short-term contract trading strategy:
Trade in the 121100 area when retracement, stop loss in the 120500 area, and the target is the 121800 area;

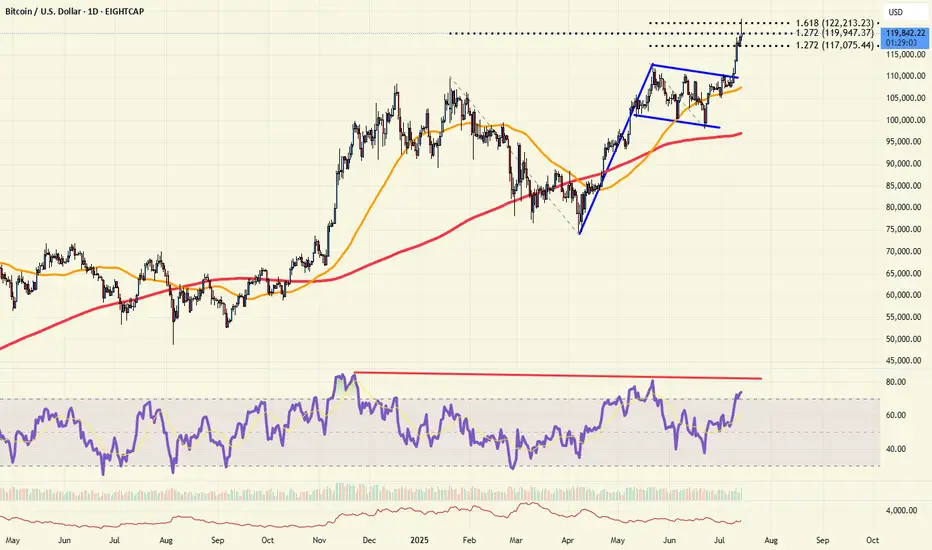
Analysis of the Latest Bitcoin Market。On July 14, Bitcoin's price surged sharply, with the highest level reaching $123,100. This breakthrough ended its eight-month-long consolidation phase within the $90,000 - $110,000 range.
The U.S. House of Representatives designated the week of July 14 as "Crypto Week" and plans to deliberate on a number of key bills. Among them, the Guiding and Establishing America's Stablecoin National Innovation Act aims to formulate federal regulations for stablecoins and is regarded as a "landmark legislation" in the cryptocurrency sector. The market expects the cryptocurrency industry to usher in policy dividends.
Market analysts are relatively optimistic about Bitcoin's prospects. The $125,000 level is seen as the next key psychological threshold, and a breakthrough above it would open up greater upside potential. Standard Chartered Bank predicts that Bitcoin will challenge $200,000 by the end of the year. Although the Relative Strength Index (RSI) is at a high level, there is no obvious overbought signal. The moving average system is clearly aligned, and the support level has moved up to $112,000. The market consensus holds that "any pullback represents a buying opportunity."
you are currently struggling with losses,or are unsure which of the numerous trading strategies to follow,You have the option to join our VIP program. I will assist you and provide you with accurate trading signals, enabling you to navigate the financial markets with greater confidence and potentially achieve optimal trading results.

symmetrical triangle in progressBitcoin has been consolidating at this level for several weeks, easing some of the pressure in order to push above 120K. As of today, we have a clear formation—a large symmetrical triangle—which confirms the continuation of the upward trend and rules out any possibility of returning to lower levels.
Bitcoin BTC price analysis📈 Two weeks have passed since the previous analysis of the OKX:BTCUSDT chart, and the market has decided to go with the 1️⃣ scenario.
Less than 3% remains to reach $125,000, and the price could easily get there by inertia, but that's a minor detail.
CRYPTOCAP:BTC is updating its ATH, and total liquidations on the crypto market over the past 24 hours are “only” $750 million, of which almost $450 million is accounted for by #Bitcoin.
Weak, very weak... Previously, longs were liquidated for $2+ billion, and it was reported that the actual amount of liquidations was significantly higher due to the fact that the exchanges' data was not fully disclosed. (For the sake of objectivity, at that time, the lion's share of liquidations was accounted for by altcoins, but now this is not the case).
◆ During this time, Trump introduced new tariffs — the market was “on a roll” — it swallowed it and didn't even notice the news.
◆ Tomorrow, July 15, the US CPI will be announced — the forecast is for inflation to rise from 2.4% to 2.6% (although there are rumors that the situation in the US economy is much worse and this may "come to light" tomorrow).
◆ July 16 - PII announcement - these indicators may act as a “cold shower” to bring the market out of its euphoria.
◆ From July 14 to July 18, the US Congress is considering three key crypto laws, including the GENIUS Act. Major players consider this a powerful driver. Perhaps the current growth has already “played out” and priced in expectations for news.
🪐 And this trading week will end on 18.07 with the start of Mercury retrograde, even the US Congress is postponing all important matters, and you still don't believe in it ))
🖐 Long positions are certainly beneficial, appropriate, and in line with the trend at present, but it is advisable to hedge them with stops, because as mentioned above: the price is rising, and there are few liquidations. During the previous decline in the cryptocurrency market, there were significantly more liquidations of long positions, and they may wish to repeat this.
And with the #BTCUSD price correction, there will be a fixation: some will have profits, and some will have losses in stablecoins, which would then be logical to reinvest as capital in altcoins. First in something more voluminous and less risky, and in the last stage, they will pump everything in a row)
But until then, we still need to survive and preserve our deposits.
So, in your opinion: correction to one of the levels:
1️⃣-$110k 2️⃣-$97k 3️⃣-$90k
or
is everything written above complete nonsense, and the market growth has only just begun to “take off”?
Top Altcoins Choice —Your Pick · Bitcoin Hits New All-Time HighBitcoin is once again trading at a new all-time high and as this happens the altcoins go boom.
The first instance circled around the fact that Bitcoin was strong and range trading between $100,000 and $110,000. When Bitcoin goes sideways within a bull market, the altcoins tend to blow up, and blow up they need. Now, when Bitcoin moves to hit a new all-time high and keeps growing; the 2025 Cryptocurrency bull market is fully confirmed.
» Which one is your favorite altcoin trading pair?
» Which project you think will grow the most in 2025 & 2026?
» What is your TOP ALTCOIN CHOICE?
Top Altcoins Choice —Your Pick
Leave a comment with some of your favorite altcoins pairs, the ones you like most and I will do a full analysis for you. I will publish in my profile and also answer directly in the comments section. I will pick and choose.
If you see other commentators that have a pair that you like, make sure to boost their comment and reply. The more boosts a comments gets, higher priority will be given to the project and trading pair.
Boost this publication and leave a comment, let's get started with your TOP ALTCOINS CHOICE!
Namaste.
BTC BUY / LONG SCALP TRADEWait for the entry to be filled, must use SL and don't use high margin on any trade. If TPs achieved first then ignore the trade.
btcusdt buy / long scalp setupWait for the entry and must use sl on all trades, if tp achieves first then ignore it.
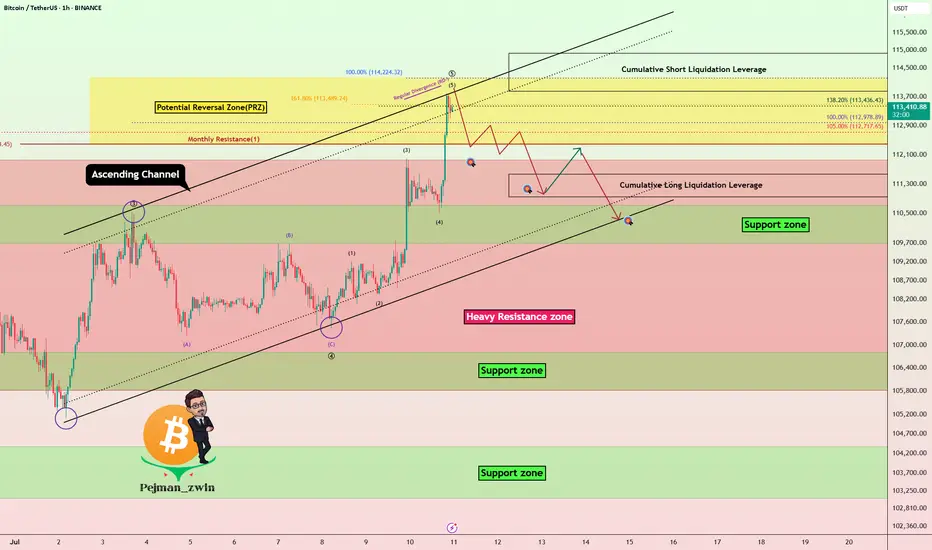
Bitcoin Hits New ATH – Is It Time to Short?Bitcoin ( BINANCE:BTCUSDT ) managed to form a new All-Time High(ATH) in the previous one-hour candles .
Do you think Bitcoin can create a new ATH in the coming hours?
Bitcoin is currently trying to break the Heavy Resistance zone($110,720-$105,820) . It has also penetrated the Potential Reversal Zone(PRZ) and Cumulative Short Liquidation Leverage($114,910-$113,850) .
In terms of Elliott wave theory , it seems that the 5 impulsive waves that Bitcoin started in the last 3 days can be completed above the ascending channel and PRZ .
Also, we can see the Regular Divergence(RD-) between Consecutive Peaks.
I expect Bitcoin to drop to at least Cumulative Long Liquidation Leverage($111,563-$110,947) . At least the price zone Bitcoin is in at the time of publishing this analysis is better for short positions , even if the Stop Loss(SL) is touched .
Note: Stop Loss(SL)= $115,023
Please respect each other's ideas and express them politely if you agree or disagree.
Bitcoin Analyze (BTCUSDT), 1-hour time frame.
Be sure to follow the updated ideas.
Do not forget to put a Stop loss for your positions (For every position you want to open).
Please follow your strategy and updates; this is just my Idea, and I will gladly see your ideas in this post.
Please do not forget the ✅' like '✅ button 🙏😊 & Share it with your friends; thanks, and Trade safe.
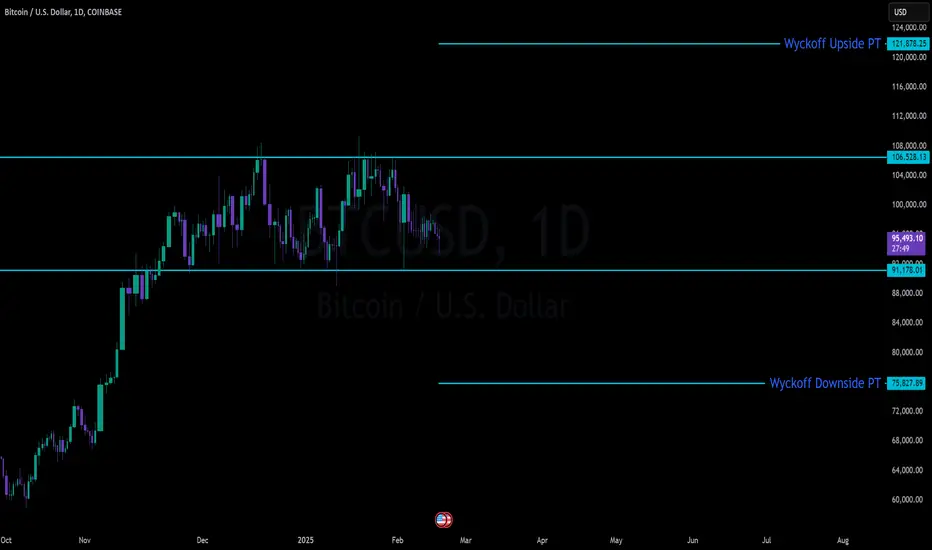
BTC Massive SetupConsolidation for months between 91k and 106k
- Classic Wyckoff setup as an accumulation/distribution
- Price targets of: 121.878 (122k is the popular target) to the upside with 75,827 on the down
- Saylor today put out news to be raising another $2 billion to buy BTC. Either he is going to be able to hold the floor or get washed out
- Trade can be taken with confirmation of breakout on either side pretty easily as momentum will be so strong that being on the wrong side will most likely be an immediate stop out
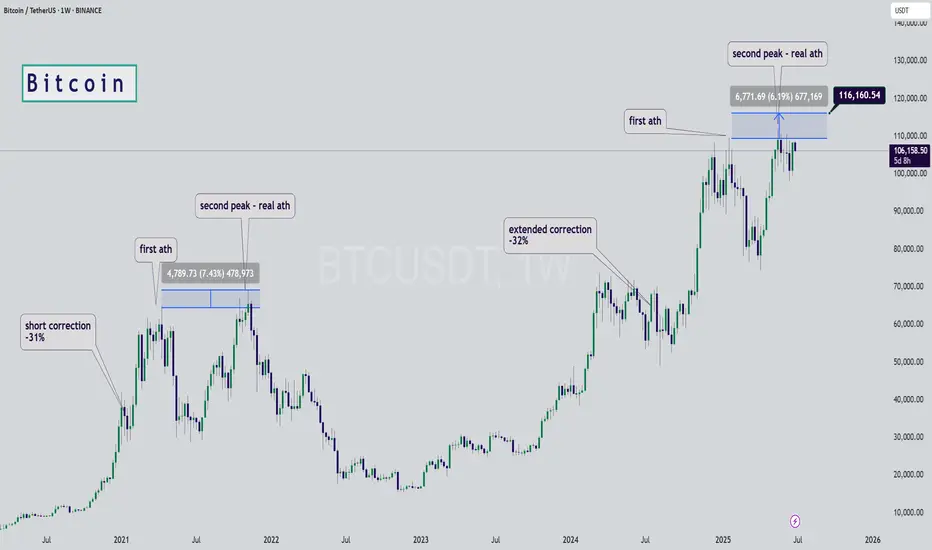
Bitcoin Fractal, increase to $116k Hi Everyone☕👋
BINANCE:BTCUSDT
Been such a long time since I posted. Today I'm looking at BTCUSDT, and I'm looking at the previous all time high cycle and what we were seeing (the pattern aka fractal).
Here's why we're likely going a little higher.
First correction of -32%
Followed by first peak, ATH
Correction, then the second peak and the REAL ath. Which is where we likely are:
Interesting to note that the previous time, the second ath was NOT THAT MUCH HIGHER. This should be considered to manage expectations in terms of how high we can go. Anything above +6% is a bonus.
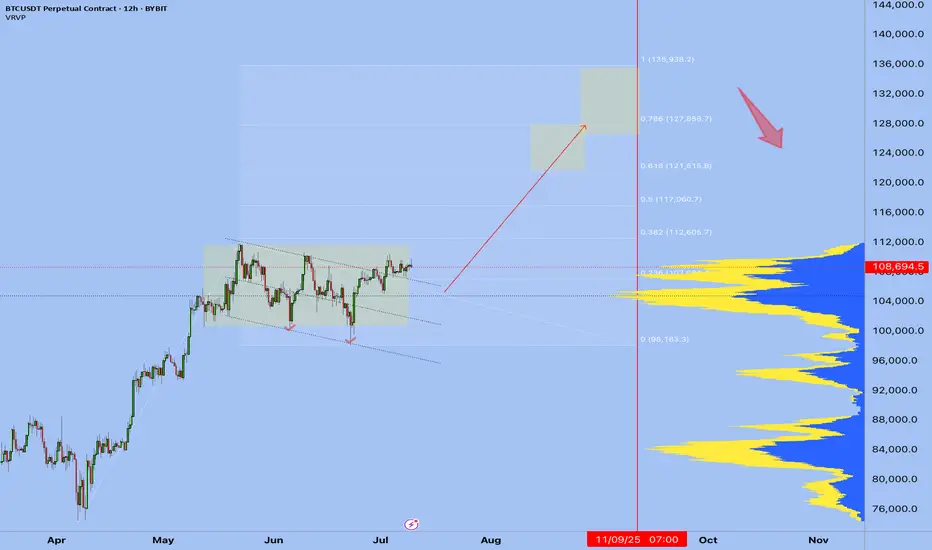
Where is the mid-term target for #BTC?📊Where is the mid-term target for #BTC?
🧠From a structural perspective, the bullish structure at the weekly and monthly levels is intact, so any increase is reasonable. We are approaching the target area of 132k-175.5k at the weekly and monthly levels. Please remember to lock in profits for spot trading.
➡️The weekly closing price is higher than the weekly resistance line, so the resistance line turns into a support line. If the price can return here again, you can look for bullish signals to participate in some long trades.
⚠️Short trading is a counter-trend trade, so we need to be cautious enough, and risk management is a must.
🤜If you like my analysis, please like 💖 and share 💬
BINANCE:BTCUSDT

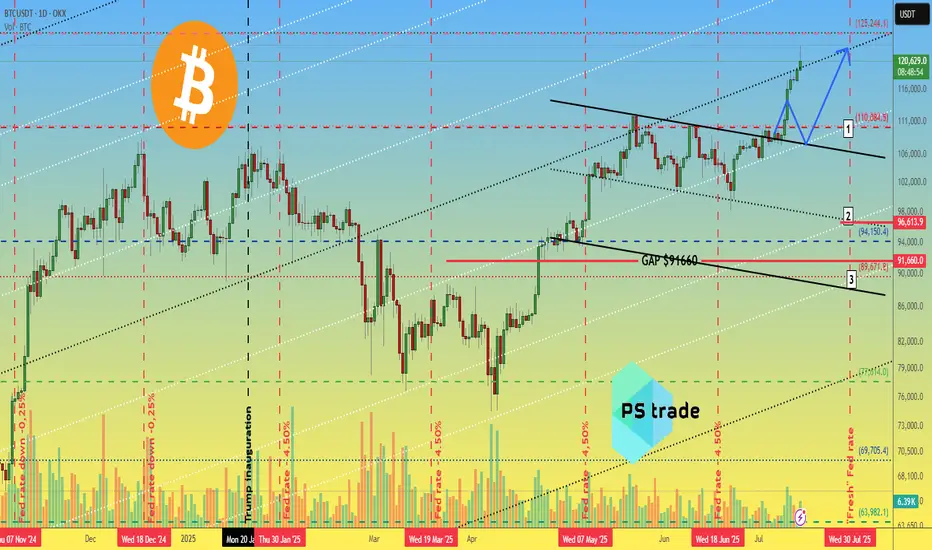
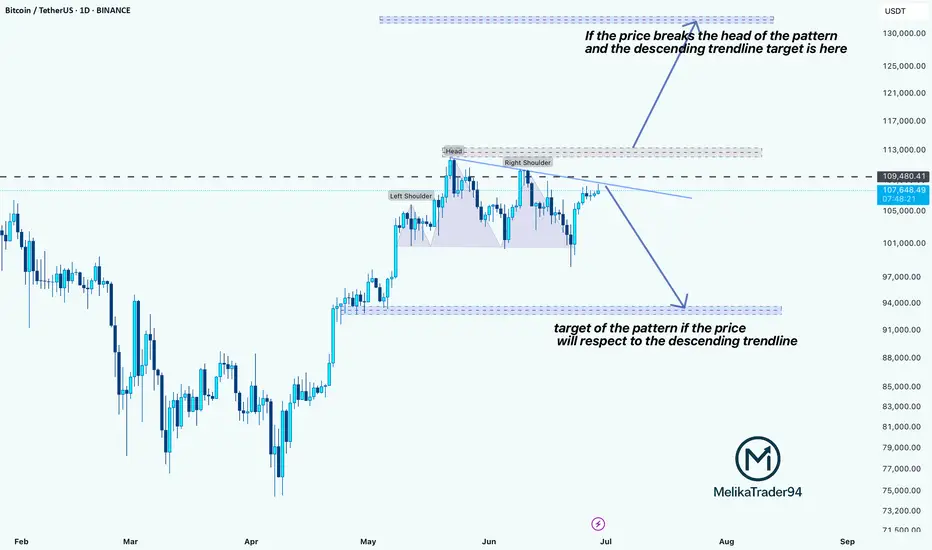
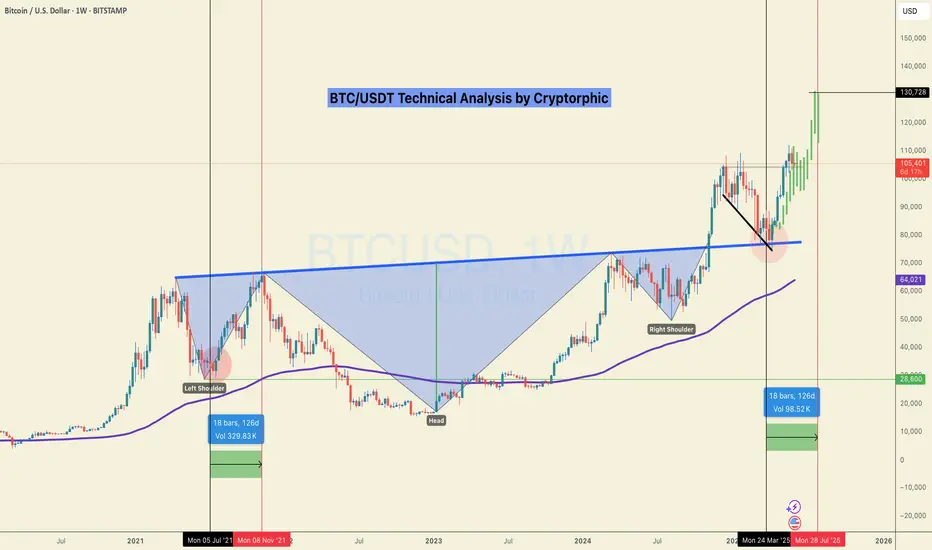
Bitcoin at a Crossroadshello guys!
In the current 1D chart of BTCUSDT, a Head & Shoulders pattern has formed, suggesting potential for significant price movement in the near term. The structure includes a defined left shoulder, head, and right shoulder, with a descending trendline acting as a critical resistance level.
🔹 Bearish Scenario:
If the price respects the descending trendline and fails to break above the neckline (around $109,480) , a bearish reversal is likely. In that case, the target based on the pattern lies near the $93,500–94,000 support zone. This level aligns with a previous consolidation area, making it a strong candidate for a reaction or bounce.
🔹 Bullish Scenario:
On the flip side, if the price breaks above the neckline and the descending trendline, invalidating the pattern, a strong bullish continuation could unfold. The potential breakout target would be around $127,000–130,000, in line with the projection from the head of the pattern.
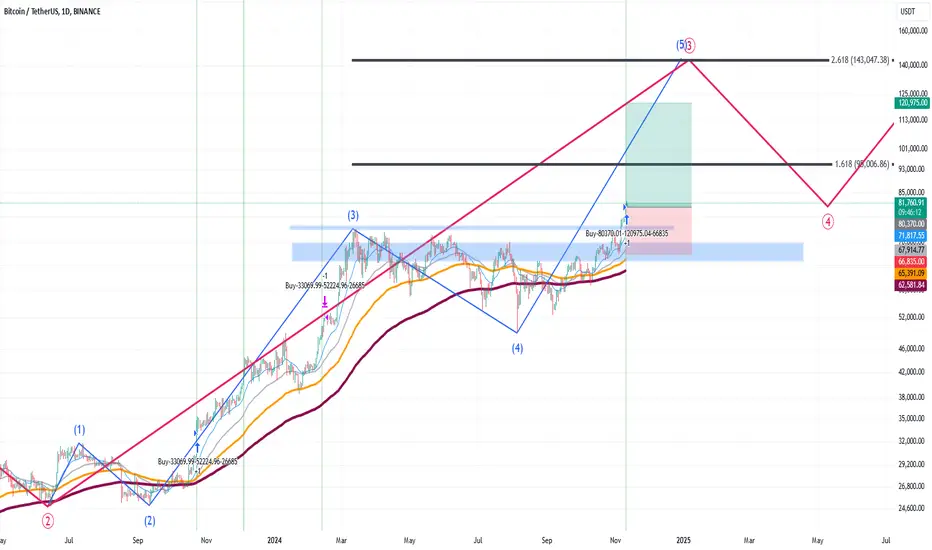
Golden Bitcoin Signal: A Great Investment Opportunity🔔 Our Bitcoin Investment Bot has issued an exclusive signal! This signal, backed by 15 years of historical data analysis, marks the perfect time to enter the market. 🎯 Take Profit Target: $120,975 (equivalent to a potential 50.5% profit)
⚖️ Professional Risk Management: This signal comes with a Stop Loss at $66,835 (16.8% risk), offering an ideal balance of profit and risk. Our bot, with its advanced and data-driven strategies, identifies the most valuable investment opportunities.
⏳ Opportunities don’t last forever! This signal could be the start of a significant move. Now is the best time to act and take advantage of this precise analysis. With our bot, you’re one step closer to sustainable profitability. 🌟
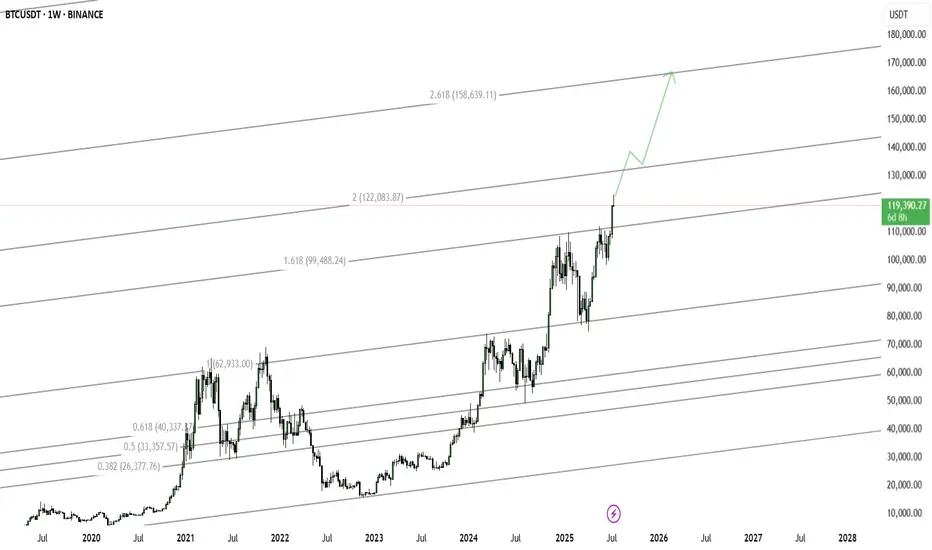
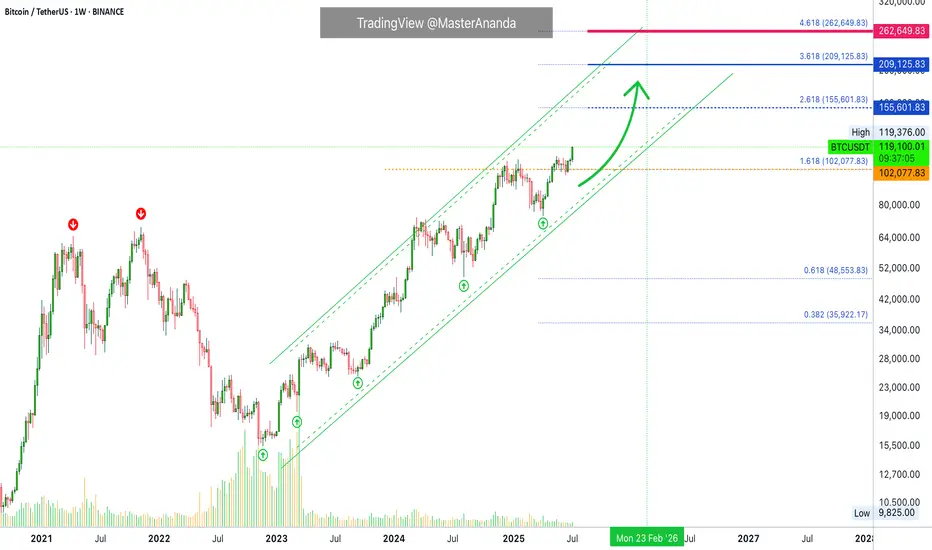
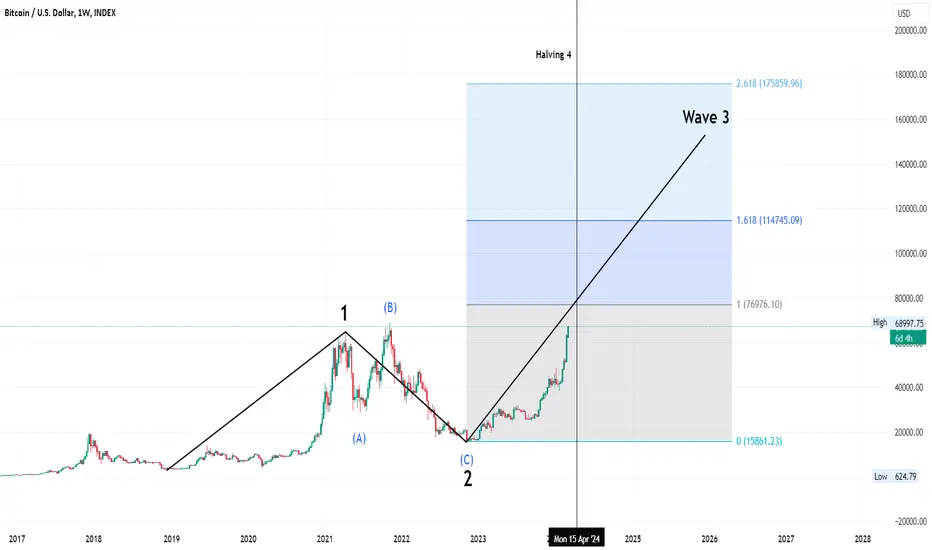
Wave 3Friends,
This wave is much too big to be some kind of first wave!
Technical Section:
What we have:
- The rise from 2019 to 2021 was Wave 1.
- Wave 2 is an expanded flat.
What we don't have:
- Wave 3 = either 1.62 x length of wave 1
or
2.62 x length of wave 1
or
4.25 x length of wave 1
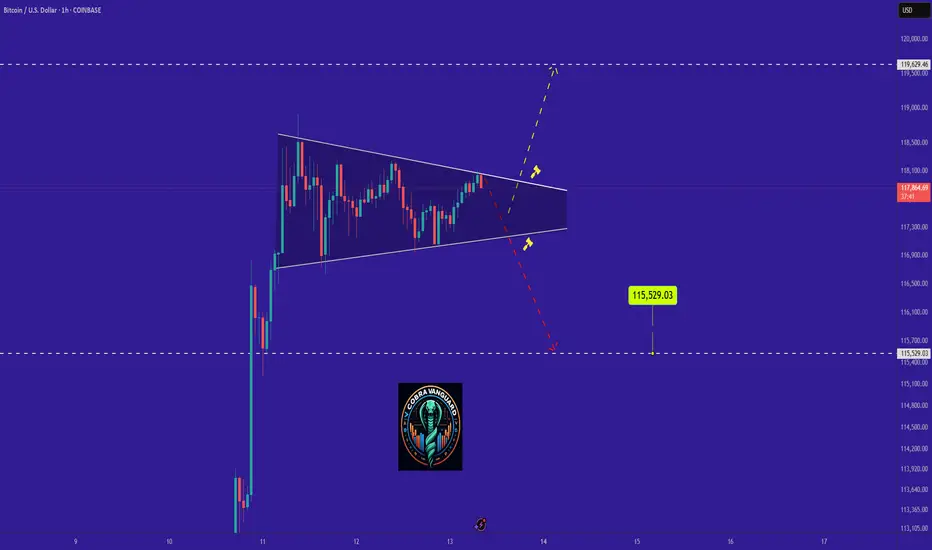
BITCOIN's Situation (1h) !!!The triangle pattern will break in the direction it is breached, and the price will move in that direction. In my opinion, the price could be corrective and may correct down to $115K.
Atomic Pump Exploded, You Missed It! Now What?Ever opened your charts after a few hours off and realized the market just exploded upwards without you?
That feeling of missing out, regret, and mental chaos is real.
But here’s the thing: if you missed the move, what should you do next?
This post is for you the ones who feel like the train left the station, but still want to win the next round.
Hello✌
Spend 3 minutes ⏰ reading this educational material.
🎯 Analytical Insight on Bitcoin :
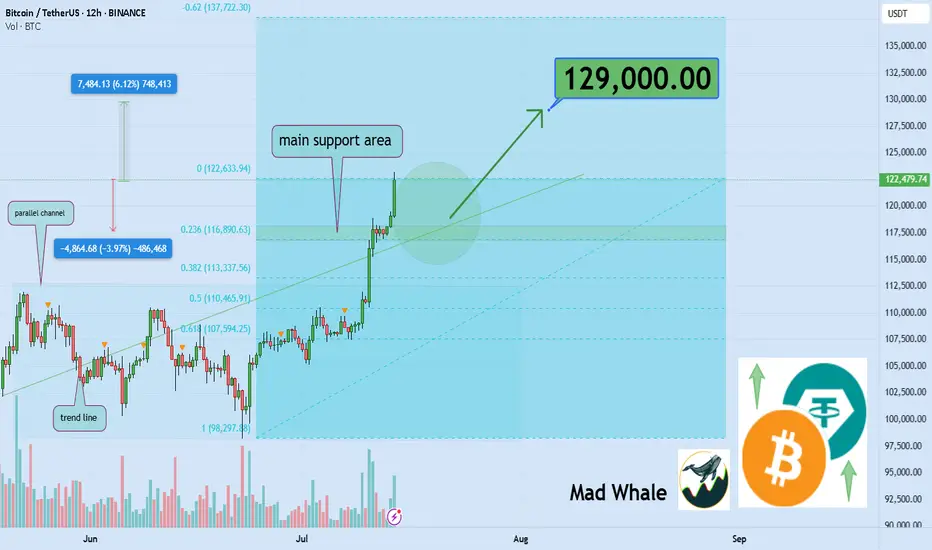
Volume remains the decisive factor driving BINANCE:BTCUSDT toward higher price levels 📈. Across various scenarios whether it’s market battles, FOMO spikes, institutional capital flows, or extended periods of consolidation volume confirms the strength behind the move. Discussions about Bitcoin as the new global currency continue to fuel interest and momentum. In the short term, I’m targeting $129,000 for Bitcoin, representing roughly a 6% upside from current prices 🚀.
Now , let's dive into the educational section,
🧠 Understanding the Trader Psychology After Missing a Market Nuclear Explosion
When the market suddenly pumps, the first thought for many traders is: “I missed it.” That’s where the mental storm begins. Your mind starts blaming you, your analysis, or even bad luck. But all of that is just an emotional response.
The real question is can you use this moment to build your self-awareness and grow as a trader?
🧨 Turning Mistakes into Opportunities Without Self-Blame
Missing a pump isn’t necessarily a mistake it’s just an outcome. Maybe you didn’t check the charts, maybe fear held you back. What matters is: what did you learn?
A real trader documents every misstep, studies it, and adjusts next time. Turn that missed opportunity into a "pivot moment".
Keep a trading journal. Write why you missed it. What signs were there that you ignored? What can you do differently next time?
📊 TradingView Tools to Hunt the Next Big Move 🚀
When the market explodes, jumping in without a plan is a recipe for disaster. Step one? Turn off your emotions. Step two? Open up TradingView.
In moments like these, a few key tools can help you figure out whether the pump is over — or just getting started. One of the most powerful tools is Volume Profile Visible Range (VPVR). It shows you where volume is stacking up.
Heavy pumps usually lead to corrections, but if VPVR shows strong volume still holding higher levels, the opportunity may not be gone yet.
Next is the Relative Strength Index (RSI). If RSI is already above 70, chances are you're showing up late. But here’s the twist if there’s a small dip, RSI cools down, and then starts rising again… that might be your real chance to enter.
💥 When the Market Blows Up Like a Nuclear Bomb, How Do You React?
When green candles start stacking and everyone’s flexing profits, you’re left behind staring at a chart that feels like it betrayed you.
This is exactly when people make emotional decisions. But urgent hype is the enemy of good analysis. Your first job here: stay calm and look at the trend like a surgeon.
🧩 Greed vs. Logic Entering at the Top or Waiting for a Pullback?
The question isn’t whether to enter now. The real question is: why are you entering?
Because you feel left out? Or because your system gives you a signal?
If your decision isn’t based on a clean setup, you’re not trading you’re gambling. Logic must win over emotion. Every. Single. Time.
🧱 Coping With the Psychological Wall of Missing Out
The pain of missing out is real. It’s like arriving at the station just to see the train’s dust.
But here’s the truth: this wasn’t the last train.
One of the best traits of a great trader is the belief in future opportunities. If you chase what’s already gone, you’ll keep losing.
Instead, focus on rebuilding your mindset.
🎯 Smart Goal Setting: Prepare for the Next Wave, Don’t Chase the Previous One
Don’t chase a pump that’s already peaked. Instead, watch for early signs of the next one.
Look at coins that haven’t moved yet but are building momentum.
Focus on price action, volume behavior, hidden news, and reliable chart patterns. Let logic lead the way not FOMO.
🔄 What’s the Best Move After Missing a Pump? Maybe… Do Nothing
Sometimes, doing nothing is the best strategy.
The market isn’t a one-time lottery ticket. It gives out chances regularly but your impatient mind makes you believe you’re running out of time.
If your next move feels rushed, pause. Train your discipline to only trade with a cool head.
💡 Pro Tips to Come Back Stronger in the Next Big Move
Instead of regret, build a killer watchlist.
Set smart price alerts.
Go back to your past data and find recurring setups.
Sharpen your skills, study tools that help, and prepare for different scenarios.
Being prepared = staying ahead.
✨ Need a little love!
We pour love into every post your support keeps us inspired! 💛 Don’t be shy, we’d love to hear from you on comments. Big thanks , Mad Whale 🐋
📜Please make sure to do your own research before investing, and review the disclaimer provided at the end of each post.
#BTC/USDT It's not over yet! Eying at 130K +ALTCOIN CHEAT SHEET!The last time I shared this chart was on April 14th, when Bitcoin was trading around $84,000 — right when panic was setting in across the market.
The message back then was simple: don’t panic, it’s just a retest.
And here we are again, revisiting the same sentiment with a new chart!
There are a lot of “double top” charts circulating in the space right now, but let me be clear: it’s not over yet.
Before jumping to conclusions, go through this chart and analysis to understand the full picture.
Bitcoin closed the week at $105,705 — certainly higher than most expected just a few days ago.
This marks the first red weekly candle after seven consecutive green closes, which is normal in the context of a healthy uptrend. We're still midway toward the broader target, so there’s no reason to panic or shift into disbelief.
Yes, we may see further corrections in BTC over the coming days or week, potentially down to $98K, and in a less likely scenario, even $ 92K. But this time, Ethereum is showing signs of strength and is likely to outperform Bitcoin, creating high-quality entry opportunities across the altcoin market. In other words, this phase is not a threat, it's an opportunity. BTC is still destined to hit $130k+ as per charts and other important metrics.
Here’s a typical market structure and reaction flow to help put things in perspective:
1. Bitcoin rallies — Altcoins underperform or get suppressed due to capital rotation into BTC.
2. Bitcoin corrects — Altcoins correct further as fear increases and dominance rises.
3. Bitcoin stabilises — Ethereum begins to gain strength, often leading the altcoin recovery.
4. ETH/BTC ratio increases — Ethereum holds up better while many altcoins continue to lag.
5. Bitcoin breaks ATH — This triggers a gradual recovery in altcoins.
6. BTC dominance peaks — Altcoins start gaining serious momentum.
7. Capital rotates from BTC and ETH into altcoins — Sectors tied to the current narrative (like meme coins this cycle, and Metaverse/NFTs in the last one) begin to lead.
8. Altcoin season begins — Utility and mid-cap tokens follow, often delivering strong returns in the final phase.
This pattern has repeated across cycles. Currently, we appear to be in the transition between Bitcoin stabilising and Ethereum gaining dominance — typically the stage that precedes a strong altcoin rally.
Now is not the time to assume the move is over. Stay objective, monitor capital rotation closely, and prepare for what comes next.
If your views resonate with mine, or if this post adds any value to you, please boost with a like and share your views in the comments.
Thank you
#PEACE
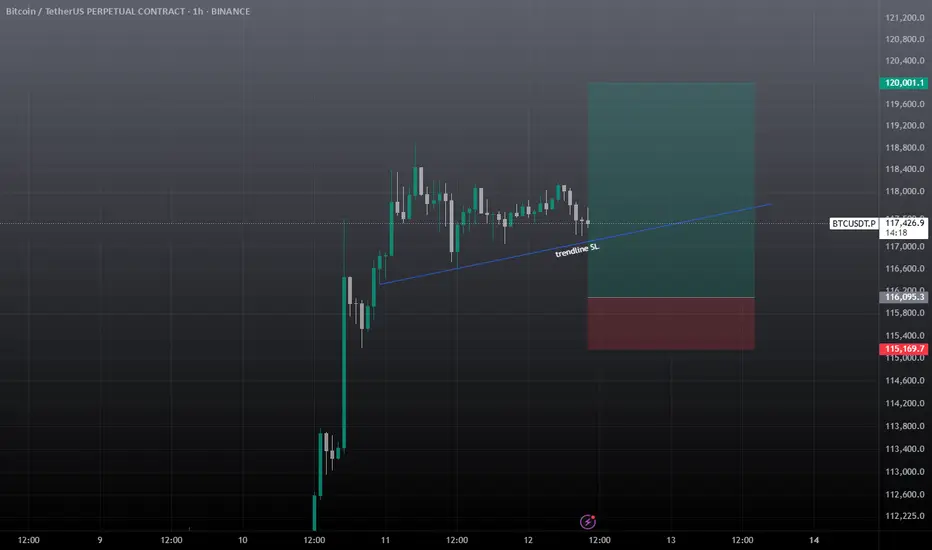
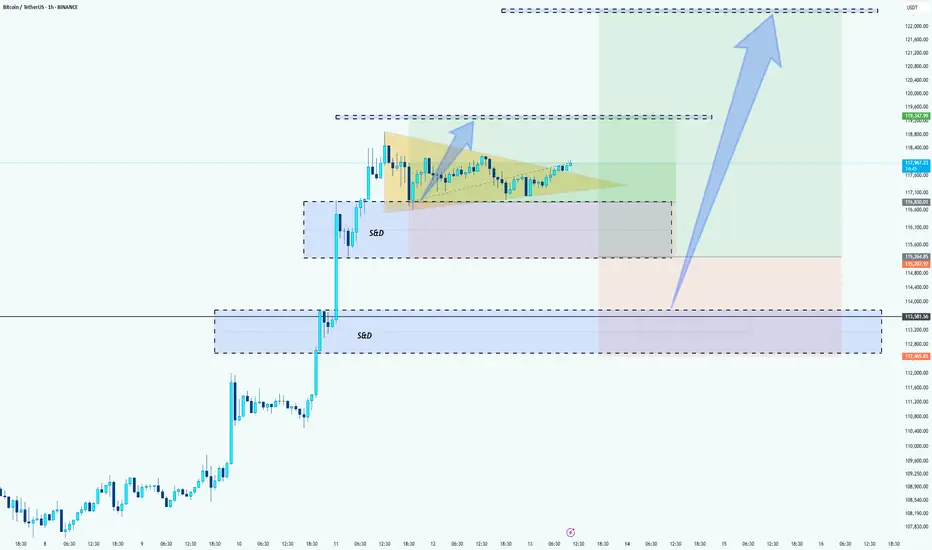
BTC Bullish Setup: Two Long Positions Aligned for ContinuationHello guys!
Bitcoin is currently in a strong uptrend, consolidating after a sharp move up. The chart highlights a textbook bullish continuation pattern (pennant/triangle), suggesting momentum is building for another leg up.
Attention:
This is not an either-or setups. Both long entries are valid and could trigger one after the other, offering layered opportunities for bulls.
1- First Long: Breakout from Bullish Pennant
Price is tightening inside a triangle after a strong impulse move.
A breakout above the resistance around $118K would confirm continuation.
Entry on the breakout targets the upper liquidity zone near $122K.
2- Second Long: Pullback to S&D Zone (around $115K)
If the breakout happens and then retraces, watch for price to revisit the S&D zone at $115,200–$115,800.
This area will act as support and provide a second long opportunity.
target: around $122k
Just Two Months Left: Navigating Bitcoin and Global ChangesGreetings to everyone reading these lines! Today, I want to share with you not just an analysis, but my personal reflections and feelings about the current situation in the financial and cryptocurrency markets, especially regarding Bitcoin.
Many of you already know that I have always been a firm believer in Bitcoin’s market cycles. Right now, we are approaching the final stage of another such cycle-the distribution phase. The past few months have seen considerable turmoil: Trump's election, escalating conflicts between India and Pakistan, Israel and Iran, rising tensions between Russia and Ukraine, and not to mention China’s increasingly assertive geopolitical moves. I can't shake the feeling that the world stands on the threshold of something significant, perhaps serious. I sincerely hope I'm mistaken, but signs of a global conflict or a substantial reset in the world order are undeniably in the air.
History shows us that after major upheavals and wars, the world undergoes profound changes. It seems we are nearing such a pivotal moment within the next couple of months. For a long time, I've highlighted September 2025 as a critical point in the current market cycle, and now everything confirms this scenario.
In these unstable times, participants in the financial markets face both risks and tremendous opportunities. The distinguishing factor today is the rapid integration of artificial intelligence into all areas of life. I firmly believe that if you don't begin incorporating AI into your activities now, you risk being left behind. Personally, I'm actively integrating artificial intelligence into my professional processes and everyday life, as I see it as inevitable in our near future.
Regarding the cryptocurrency market, I'll be frank: the past couple of years have significantly changed it and even somewhat disappointed me. Liquidity has become diluted, and the market has clearly become seasonal, with brief periods of explosive growth followed by long downturns. This has led me to return to trading Forex and gold, where the market is more transparent and predictable.
Many crypto projects that seemed promising in 2017 are now nearly forgotten and stagnating. Think of Dash, EOS, Litecoin, ZCash, and others-they haven't disappeared entirely, but they no longer play significant roles in the market. The battle for user attention has become overly aggressive, and competition has devolved into chasing short-lived hype. Nevertheless, there are exceptions, such as Solana—a project that achieved success thanks to a fortunate combination of factors. Yet such projects remain exceedingly rare.
Today, I see the most promising and powerful trend as the tokenization of real-world assets (RWA). It doesn’t matter so much which blockchain will be used-the concept itself has already proven effective. While this journey won't be easy, the involvement of giants like BlackRock indicates the trend is sustainable and promising in the long run.
Overall, I am confident that financial markets and digital currencies will continue to evolve and grow. However, in about two months, I plan to adopt a bearish stance. Unfortunately, there are few signs of a quick global economic recovery. The world needs significant restructuring and changes-new rules and agreements are inevitable, and the coming year promises many notable events.
Ask yourself: Are you ready for these changes? Are you prepared to adapt to new conditions, technologies, and realities? Personally, I'm fully ready, which is why I remain active in the market, continuing to share my thoughts, assist, and engage with each of you. If you have questions, ideas, or proposals for collaboration, I am always open to dialogue and eager for any interaction.
I sincerely thank each of you for your support, comments, and attention to my posts. I stay here because I believe in the enormous opportunities available even in the most uncertain times. We have an exciting journey ahead, and I invite you to travel it together with me.
Wishing you success, profits, and above all, peace and kindness on our planet. The time of change is already here. Let’s meet it together.
Warm regards,
Your EXCAVO.