BTC/USDT 4H – High-Probability Decision Point Ahead Bitcoin is currently retesting a confluence-rich zone — a textbook decision area where structure meets sentiment.
🔻 What’s in play?
🟥 Demand Zone / Bullish Order Block / Breaker Block (visible on 1H)
📈 Third-touch test of the ascending trendline – statistically known to trigger strong moves
⚪ Price sitting just above the 200 EMA acting as dynamic support
🧱 Prior resistance flipped to support — now being validated again
Despite the correction, structure remains intact. This is a healthy retracement unless price starts closing below trendline + zone with volume.
🔀 Possible Outcomes:
Bounce: If buyers step in here, this could mark the next leg in the uptrend.
Breakdown: A strong close below the zone/trendline could shift structure and sentiment bearish.
⚠️ No trade bias here — let price show its hand.
💬 What’s your view — bounce or break? Comment below!
✍️ Chart marked with structure logic only — not financial advice.
BTCUSDT

BTC Trade SetupBTC will not take any major correction until it sweeps upside liquidation and close with big red candle, So take the long only on BTC. Wick possible below the SL. I will hold the trade without sl if it comes to entry, if tp achieved first then ignore the trade. Also July breakout possible for BTC, July always positive for BTC, let's see.
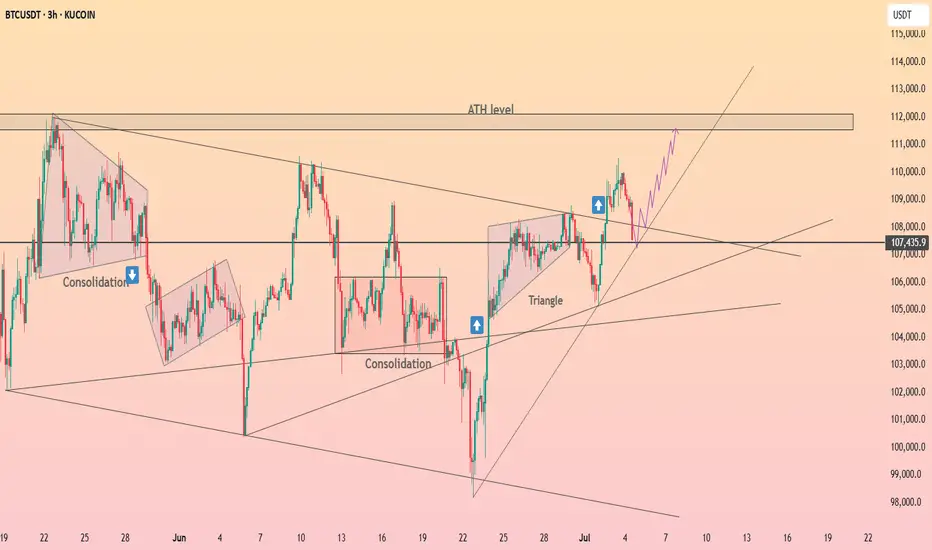
HolderStat┆BTCUSD retesting of the trend lineKUCOIN:BTCUSDT has pushed above 107,000 and reclaimed key levels after breaking from triangle and consolidation zones. Structure supports a move toward the 112,000 resistance zone (ATH). Higher lows and strong rallies continue to define the trend.
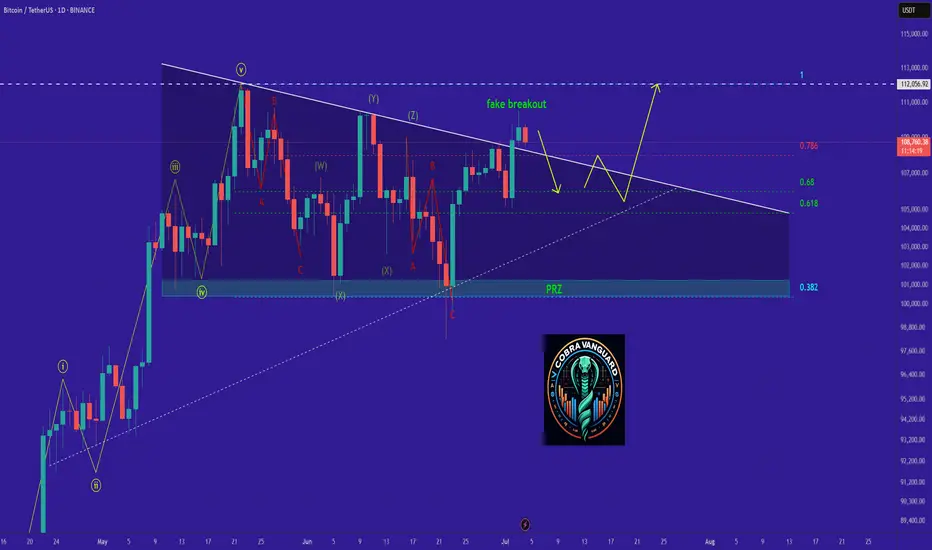
A Comprehensive Analysis !!!This market has shown disregard for technical patterns, and every time the price approaches historically significant levels, it reveals its true intentions and disappoints us. This cycle tends to repeat.
In my opinion, we’re likely to see one more drop in Bitcoin’s price. After that, instead of continuing the expected downtrend from the pattern, the price could break the descending formation and experience a strong upward move.
Stay Awesome , CobraVanguard.
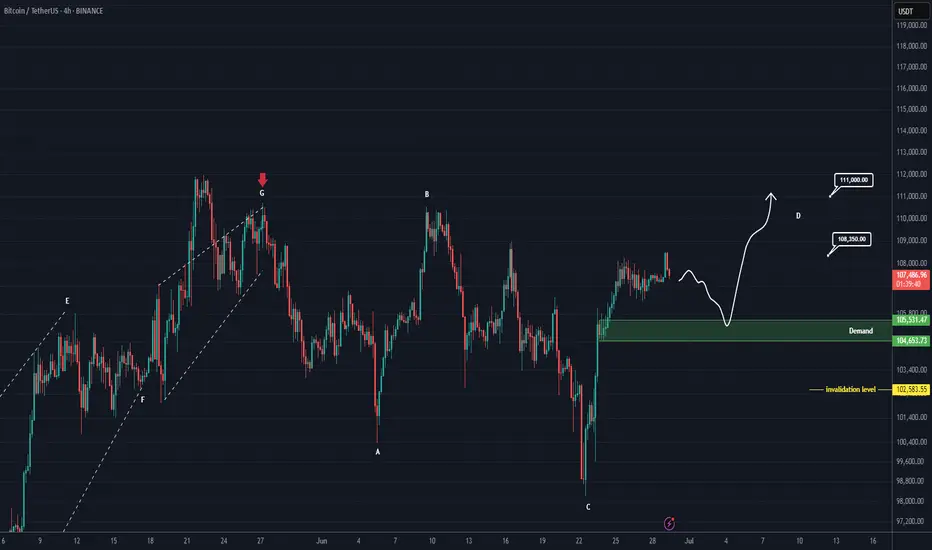
BTC Analysis (4H)This analysis is an update of the analysis you see in the "Related publications" section
Since the red arrow was placed on the chart, Bitcoin's bullish phase has ended and it has entered a corrective phase. This correction appears to be forming a Diametric pattern, and we are currently in the middle of wave E.
After interacting with the demand zone, the price may move toward the specified targets.
A daily candle closing below the invalidation level will invalidate this analysis.
For risk management, please don't forget stop loss and capital management
Comment if you have any questions
Thank You
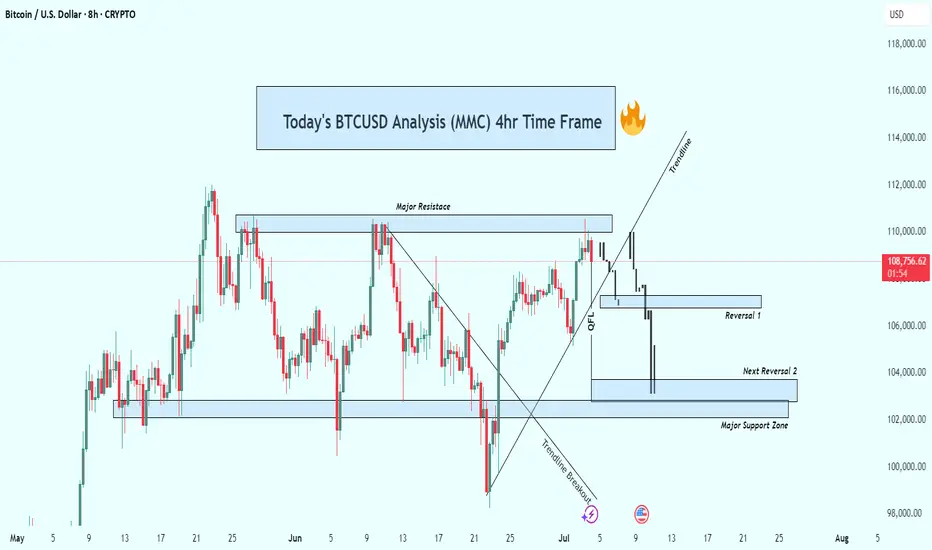
BTCUSD 4hr Technical Analysis : Rejects $110K - Next TargetsOverview:
Bitcoin is currently undergoing a significant technical correction after rejecting a strong resistance level. The 4-hour chart shows a decisive bearish breakdown, suggesting that the bulls are losing control and sellers are gaining momentum. As the price continues to fall, all eyes are now on the major support levels that could trigger a potential reversal—or further acceleration to the downside.
📊 Technical Breakdown:
1. Major Resistance Zone (~$110,000 – $111,000):
This zone has acted as a strong supply area, where price has repeatedly failed to break through. Multiple rejections from this zone confirm it as a key distribution area, where large sellers are stepping in. The repeated failure to close above it shows market exhaustion at the highs.
Multiple candle wicks and strong bearish closes around this area.
Bull traps occurred after brief moves above this resistance, followed by sharp sell-offs.
2. Trendline Breakout:
Previously, BTC had been respecting a rising ascending trendline, which served as dynamic support throughout the last rally. Recently, price broke below this trendline with strong bearish momentum.
This marks a break in market structure.
The trendline retest acted as resistance—textbook confirmation of the trend shift.
3. QFL (Quantity Following Line) Breakdown:
The QFL zone, typically a bullish defense level, has failed to hold. This breakdown confirmed that bulls lost a critical level of control.
Price briefly retested the QFL from below before continuing downward.
This zone now acts as resistance, reinforcing the bearish outlook.
🔻 Downside Targets & Reversal Zones:
✅ Reversal Zone 1 (~$106,000):
This minor support level provided minimal reaction and was quickly breached.
Lack of volume or candle confirmation suggests weak buying interest here.
✅ Next Reversal Zone 2 (~$104,000):
This zone has historical importance as a short-term demand area.
Monitor closely for bullish candlestick patterns, volume spikes, or bullish divergences to assess potential bounce scenarios.
✅ Major Support Zone (~$102,000 – $100,000):
This is the most critical level in the near term.
Historically, price has reversed strongly from this zone, indicating strong buyer interest.
If price breaks and closes below this level, expect a high-probability continuation towards the $98,000 psychological level or lower.
🧠 Market Psychology:
The breakdown from the trendline and QFL indicates panic or profit-taking.
Many late long positions are likely being liquidated.
Smart money may be waiting at the $100K zone to accumulate, depending on market conditions and macro factors.
🎯 Trading Strategy Ideas:
🛑 For Bears (Shorts):
Stay short below $110K resistance.
Trail stop-loss above QFL zone or trendline breakdown.
Look to take profit at $104K and $102K zones.
Add to positions on confirmed bearish retests of broken supports.
📈 For Bulls (Longs):
Wait for clear confirmation (e.g., bullish engulfing, double bottom, RSI divergence) near $104K or $102K before entering.
Avoid catching falling knives—patience is key.
Consider scaling in with smaller position sizes and tight stops.
Watch for a reclaim of the QFL zone or a strong bounce from the $100K psychological level.
🧭 Bias: Bearish
Structure: Lower highs & lower lows.
Momentum: Selling volume increasing, bulls losing steam.
Invalidation: A strong daily close above $111K would flip bias back to neutral/bullish.
🧩 Final Thoughts:
Bitcoin is currently in a fragile state as it retraces from a failed breakout. With multiple key support zones ahead, the next few sessions will be critical in determining whether bulls can reclaim control or if we see deeper downside movement. Watch for signs of exhaustion from sellers or fresh accumulation zones to position accordingly.
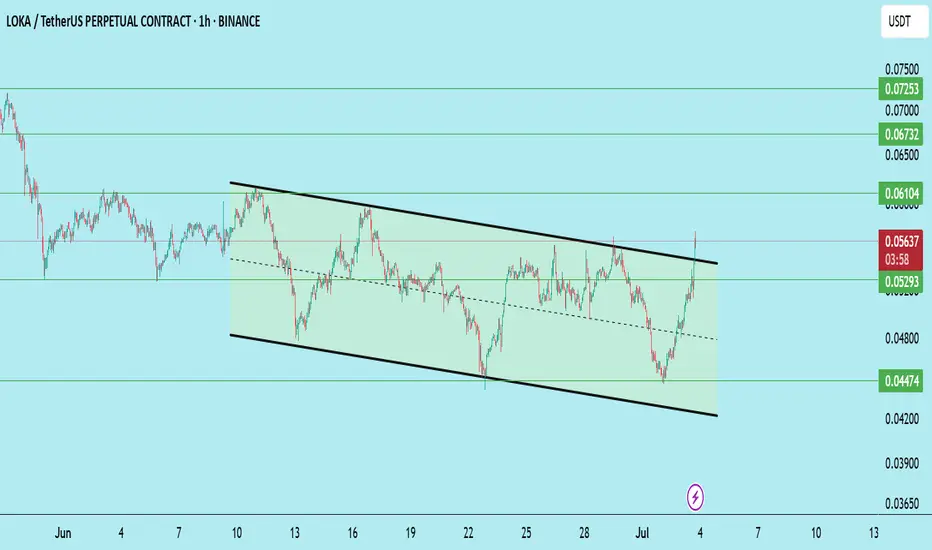
LOKA/USDT – Breakout WatchLOKA has broken out of a descending channel on the 1H chart, showing early signs of bullish momentum. The price has breached the upper boundary of the falling structure, supported by strong volume and clean trend confirmation.
Support Levels:
$0.05293 (recent breakout level)
$0.04474 (range low support)
Resistance / Target Levels:
$0.06104
$0.06732
$0.07253
Stoploss: Below $0.050 to protect against false breakout
Trade Idea:
Entry on retest near $0.053–$0.054 for a safer risk-reward setup.
Targets align with previous horizontal resistances and Fibonacci levels.
LOKA looks poised for a potential trend reversal if the momentum sustains above the channel. A break and hold above $0.061 would open room for higher targets.
As always, risk management is key.
Not financial advice – DYOR.
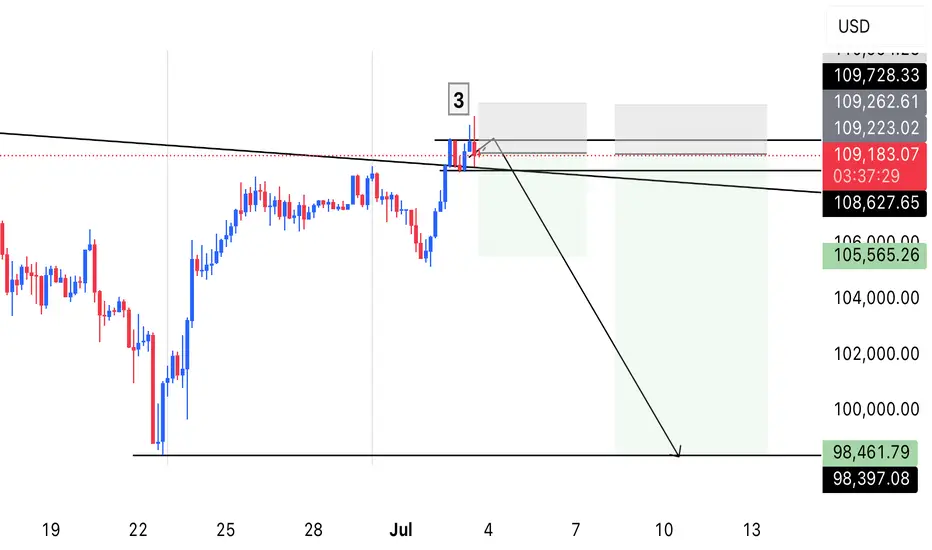
BTCUSD RISKY 4H SHORTPrice broke out of bearish trendline but formed resistance at $110600. Price printed a bearish engulfing pattern following Positive US jobs data. A potential two tops or double tops formed. A potential reversal to at least $105000.
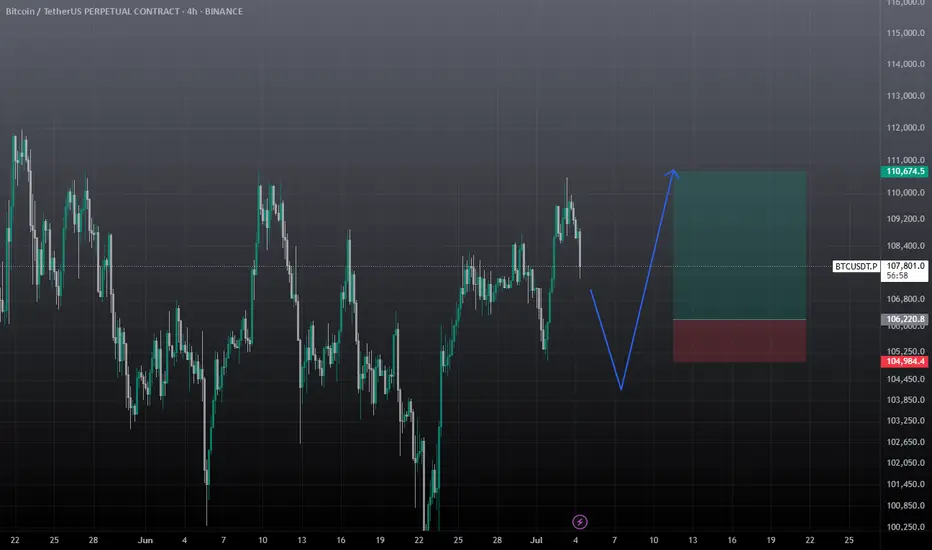
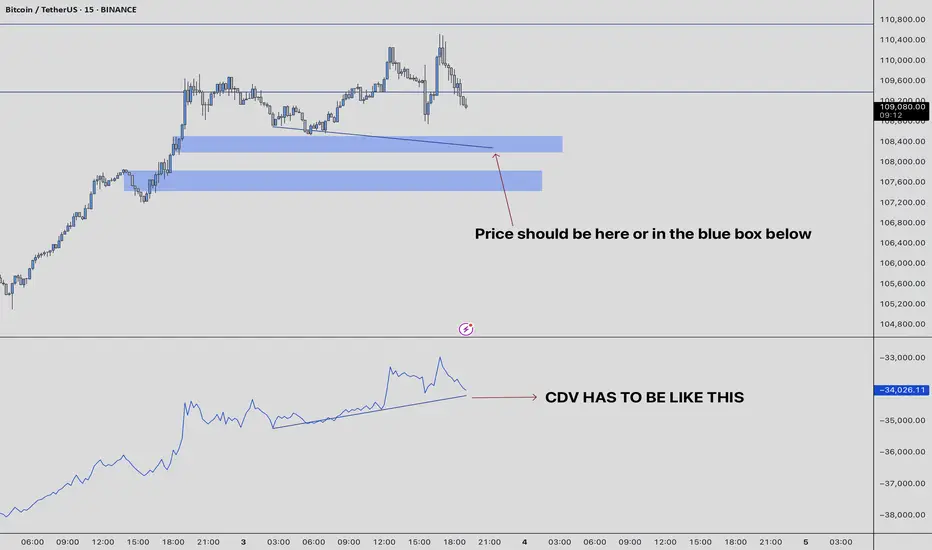
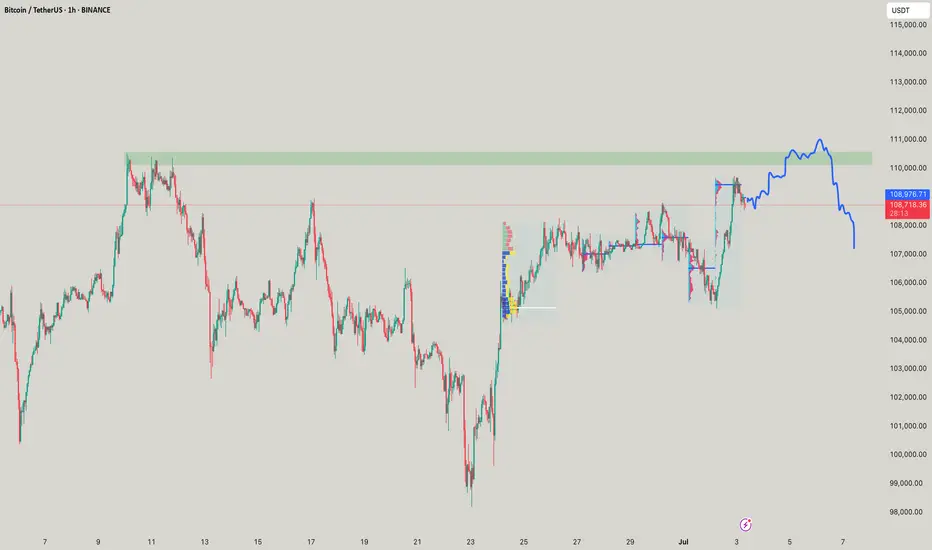
BTCUSDT: Positive CDV Divergence for Potential Long Setups• Market Overview: Bitcoin currently sits at a pivotal point. Although the price movement has been somewhat indecisive, we’re watching closely for signs of bullish momentum.
• CDV Divergence Focus: Our attention is on a potential positive Cumulative Volume Delta (CDV) divergence. This takes shape when the price makes a lower low but CDV registers a higher low (regular bullish divergence), or when the price posts a higher low and CDV shows a lower low (hidden bullish divergence). These patterns can hint at growing buying interest even if price action hasn’t caught up yet.
• Support Zones (Blue Boxes): The highlighted blue zones on the chart signal potential support levels where buyers may step in. These are mapped from prior demand areas or structural support points.
• Trade Setup: Should a confirmed positive CDV divergence appear near or inside one of these blue zones, it could offer a strong case for a long entry. This would suggest that while the price may look weak, buying strength is quietly building underneath.
• Managing Risk: Any long entry must be accompanied by a well-defined invalidation level—typically just below the blue box support or the lowest point of the divergence.
Disclaimer: This is a technical pattern-based analysis intended for informational purposes only. Trading involves risk. Always perform your own due diligence and assess your risk appetite before entering any trades.
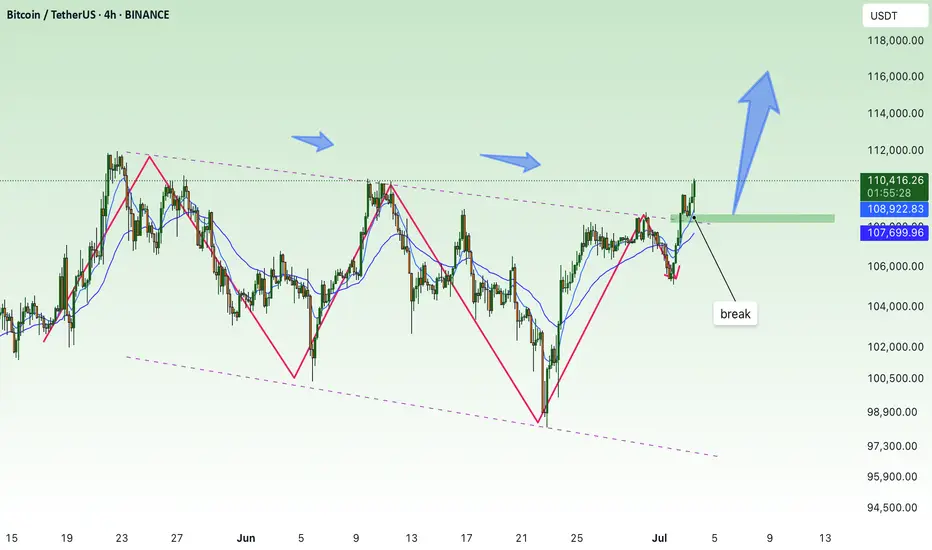
break, BTC soon reaches new ATH💎 Update Plan BTC after NFP (July 3)
Notable news about BTC:
Bitcoin (BTC) recovered to $ 109,000 on Wednesday when the US agreement with Vietnam and the increase in global M2 supply of M2 money has promoted an increase in open interest rates (OI), soaring to 689.78 thousand BTC worth about $ 75 billion. The cryptocurrency market in general has increased the price along with BTC, with leading altcoins, Ethereum (ETH), XRP and Solana (SOL) increased by 7%, 3%and 4%respectively.
Bitcoin, the market cryptocurrency market increased by the trade agreement with Vietnam and M2 money supply soared
The cryptocurrency market has recovered on Wednesday, an increase of 2% to regain the market capitalization of $ 3.5 trillion.
Technical analysis angle
First, congratulate the investors who follow the plan when we previously traded according to the model and had a short signal at 108k and took profit and then Long in the 106k area.
Currently, BTC is in wave 5 and is trapped in the Fibonanci area of 2,618 golden ratio around the price of 109k, this is also the threshold of the price of investors who are under pressure before the price area goes to 112k
The 112k region is a psychological area of profit and will appear on the 109k sales situation before the BTC price may rise further in the last 6 months of the year.
Please follow the channel to receive accurate scenarios about gold and BTC /-Teart /-heart
==> Comments for trend reference. Wishing investors successfully trading
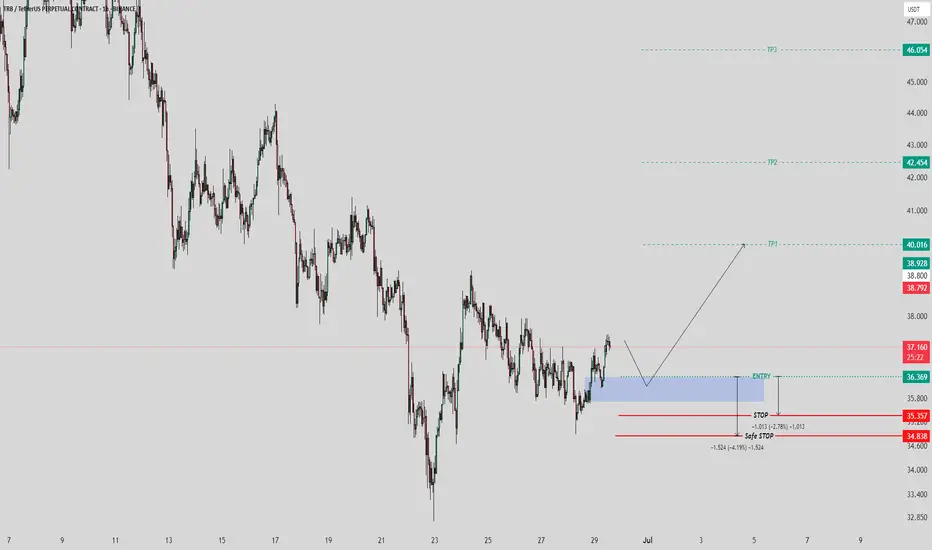
TRBUSDT Setup – Staggered Exits, Smart Profits📌 Entry: 36.70
🎯 TP1: +10% → Secure 50% of position
🛡️ Move to risk-free after TP1 to protect capital
🎯 TP2: Take 50% of remaining volume
🎯 TP3: Close all remaining volume
Calculated exits. Risk-managed. Momentum-ready.
#BTCUSDT: First $120,000 Then $140,000 Swing Move.Bitcoin has accumulated successfully and is currently on the verge of entering the next price zone, which is 120k, followed by 150k. There’s only one entry zone to consider. We’re confident that the price will move as planned, but it’s not guaranteed. Before taking entry, please conduct your own analysis.
If you like our work, please like, comment, and share.
Team Setupsfx_
❤️🚀
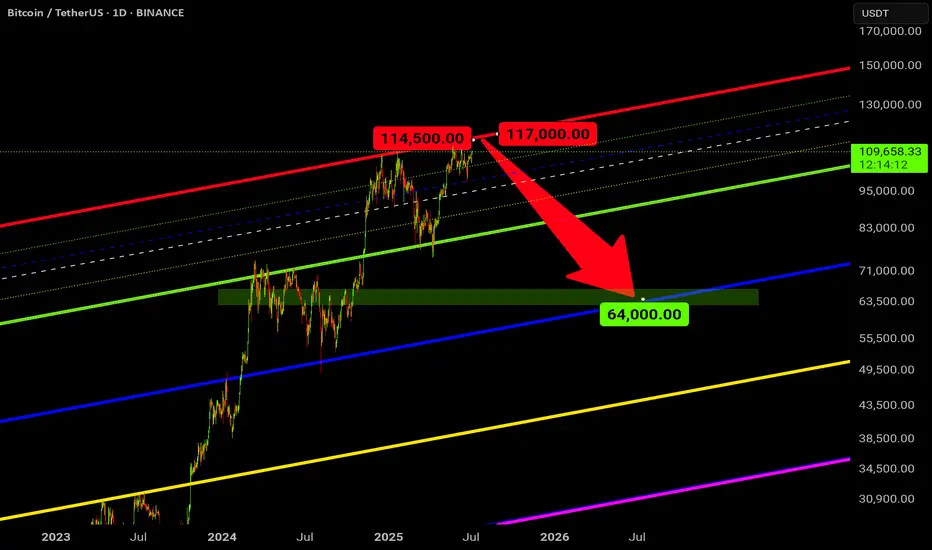
BTC Sell ShortThis is how I see Bitcoin in a year's time : the beginning of a bear market and the end of a bull market .
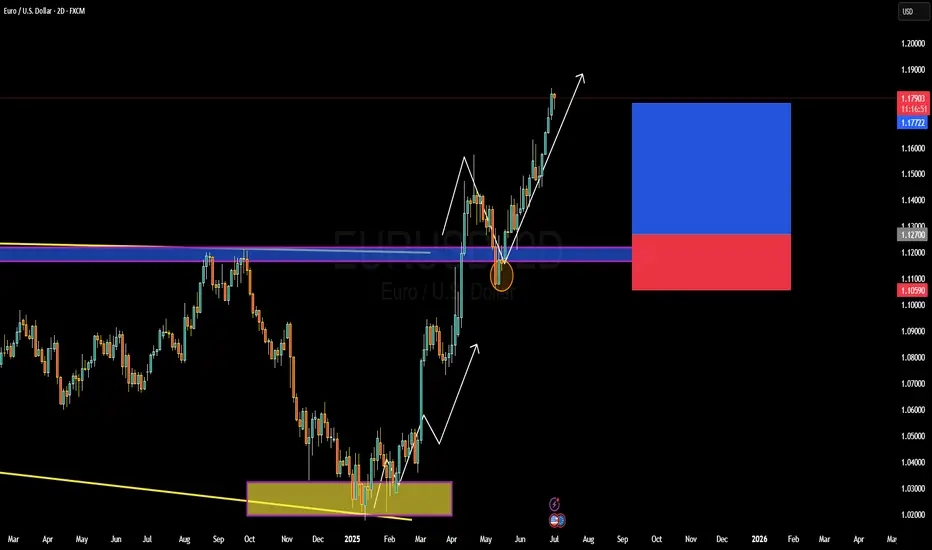
EURUSD BULISH OR BEARISH DETAILED ANALYSISEURUSD has been playing out exactly as forecasted, now trading confidently above the key 1.17 handle. Price action has respected prior structure levels perfectly, with the recent bullish impulse forming clean higher highs and higher lows. After a minor corrective move and successful retest of the previous breakout zone, we’re now seeing continuation momentum build toward the 1.21 target. This pattern is a textbook bullish flag followed by a clean breakout and retest, confirming the strength behind this current upside leg.
Fundamentally, the euro has gained strength due to growing divergence between the ECB and the Fed. With inflation in the Eurozone stabilizing and recent data indicating a modest recovery in manufacturing and services PMI, there's increasing speculation the ECB may hold rates longer, while the Fed is seen leaning toward eventual rate cuts as US labor data softens. The June NFP miss and downward revisions in prior data have weakened the USD’s position, creating a favorable environment for EURUSD bulls.
The technical confluence with macro fundamentals is striking. Risk sentiment is improving across global markets as inflation fears ease and rate clarity emerges. The euro remains supported by strong capital inflows and demand for yield stability. Additionally, EURUSD has cleared multi-month resistance zones with conviction, signaling institutional interest and momentum-based positioning. The recent candle formations suggest buyers are in firm control.
We remain on track for the 1.21 level, which aligns with prior swing highs and a key Fibonacci extension target. Any pullback toward the 1.16–1.1650 region should be viewed as a high-probability buying opportunity. With the DXY under pressure and euro zone resilience improving, EURUSD continues to be one of the top-performing major pairs heading into Q3. Stay patient and ride the wave—this move has more room to run.
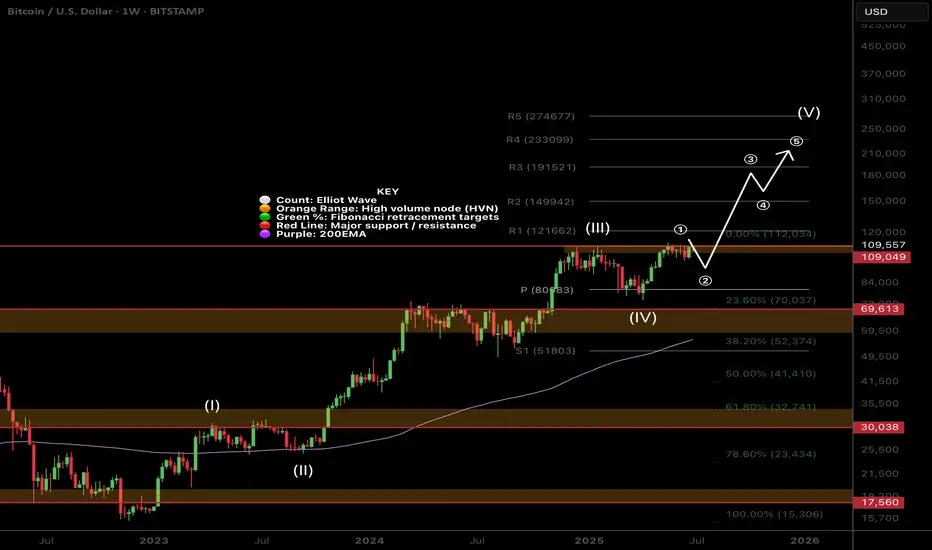
$BTC Weekly Continues to follow the script!BTC appears to have completed a shallow wave 2 retracement showing investor excitement and demand - They just can't wait to buy some!
New all time highs are expected this week (perhaps today) once the High Volume Node resistance we are currently at is overcome (obviously).
Wave 3 has an expected target of the R3 pivot $190k but i am expecting price to overextend this cycle to at least the R4 pivot at $233k.
Safe trading
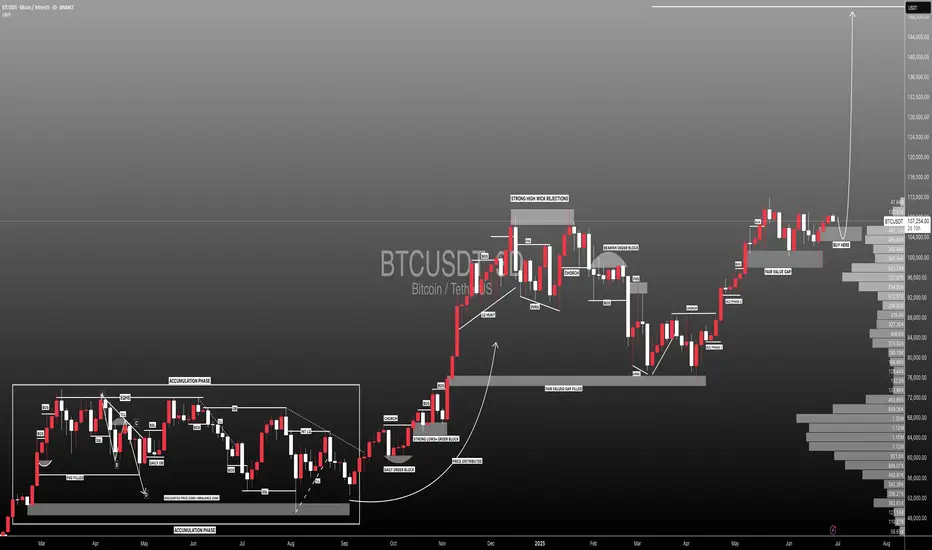
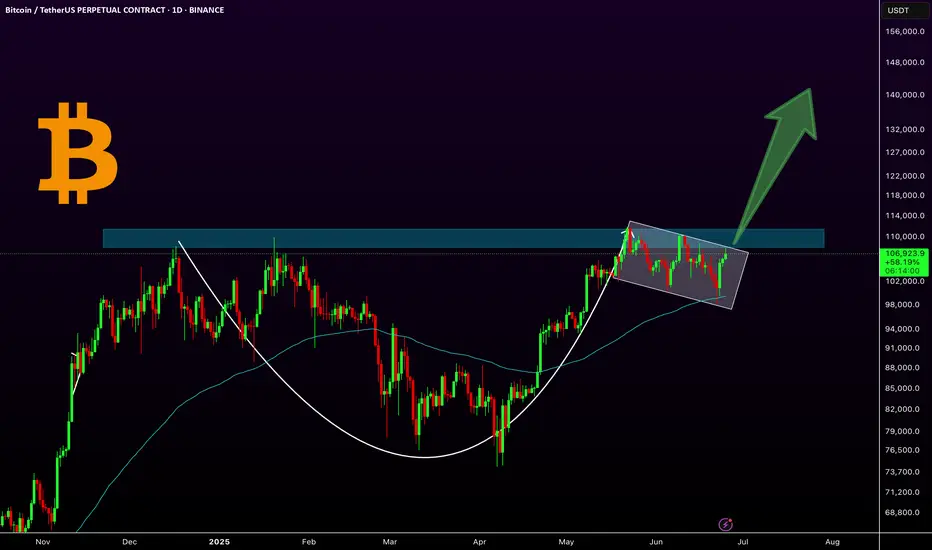
BTC: A Classic Cup & Handle in Play!Bitcoin has formed a classic cup and handle pattern on the daily chart, with the 100 EMA providing solid support during the handle formation. Currently, the price is consolidating in what appears to be a bullish flag or extended handle, just below the key resistance zone around $109K. A breakout above this level could ignite a strong bullish rally toward higher targets like $144k.
Key Highlights:
-Cup & Handle pattern confirmed
-10 EMA acting as dynamic support
-Bullish flag/handle forming near resistance
- A breakout could lead to explosive upside
Regards
Hexa
CRYPTOCAP:BTC BITSTAMP:BTCUSD
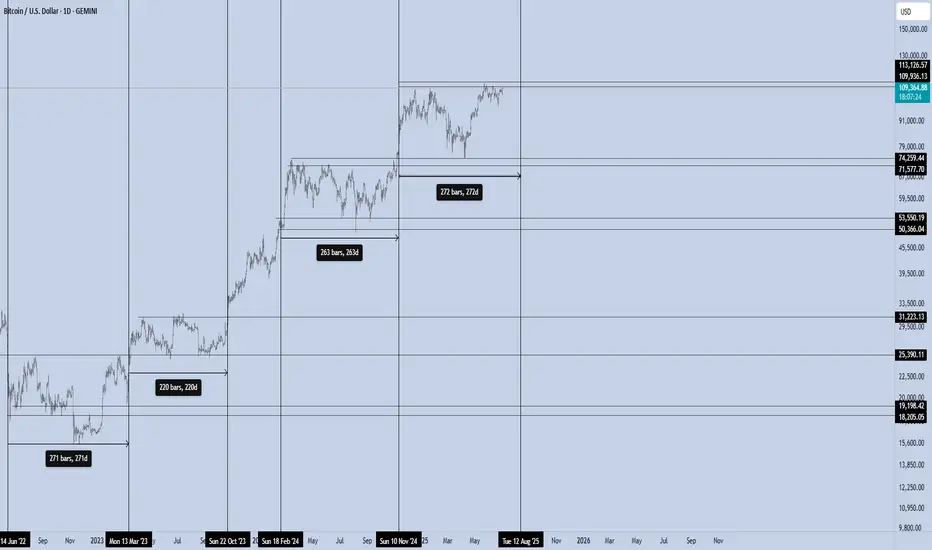
Bitcoin – The 270/100 CycleBitcoin isn’t just trading. It’s pulsing — in cycles that reward those who understand timing as much as price.
Over the last two years, BTC has shown a repeating pattern with surgical precision:
Range Phase:
Each macro consolidation lasts ~220 to 270 days, where price builds structure, absorbs supply, and prepares for its next expansion. This is the quiet phase — the zone where conviction is tested, and weak hands exit.
Impulse Phase:
What follows is a ~100-day vertical leg, where BTC surges between +50% to +80%, targeting the next macro resistance. We’ve seen this repeatedly:
Accumulate → Expand → Re-accumulate → Expand.
BTCUSDT Daily – Bullish Engulfing = Big Move?Whenever we've seen a bullish engulfing candle on the daily timeframe, it’s often followed by a strong upward move. This pattern has repeated consistently throughout the current cycle.
🔹 The recent daily close shows a clean bullish engulfing right off the 50 EMA support.
🔹 Previous purple zones also highlight areas where similar engulfing candles led to sharp rallies.
🔹 Price is once again reclaiming momentum after a liquidity sweep — a classic accumulation signal.
📈 If history repeats, we could be eyeing another leg higher toward the $112K–$115K zone.
Pattern Psychology:
"This bullish engulfing isn’t just a candle — it's a sentiment shift, where buyers overpower sellers completely in one session."
🔹EMA Bounce Strategy:
"Price is using the 50 EMA as a trampoline — a typical smart money support zone."
🔹 Rejection of Breakdown Narrative:
"The fakeout below 100,582 support could be a classic bear trap, setting up for a liquidity-driven rally."
🔹 Pivot Zone Reaction:
"Immediate pivot zone (102,292) reclaimed — price now in a favorable position to target next R1 around 110,000."
🔹 Historical Context:
"This setup mirrors the March bounce, where similar structure and RSI/MACD confluence led to a 12% surge."
⚠️ Disclaimer:
This is not financial advice or a buy/sell recommendation. Analysis is for educational purposes only.
All chart markings and interpretations are original.

BTC - will it touch ATH @ 112K ?Well the move of BTC was moved just touching the 4H or 1H ob acted as a well cushion and moved up, Looks like this is going to happen for once and then can be seen!
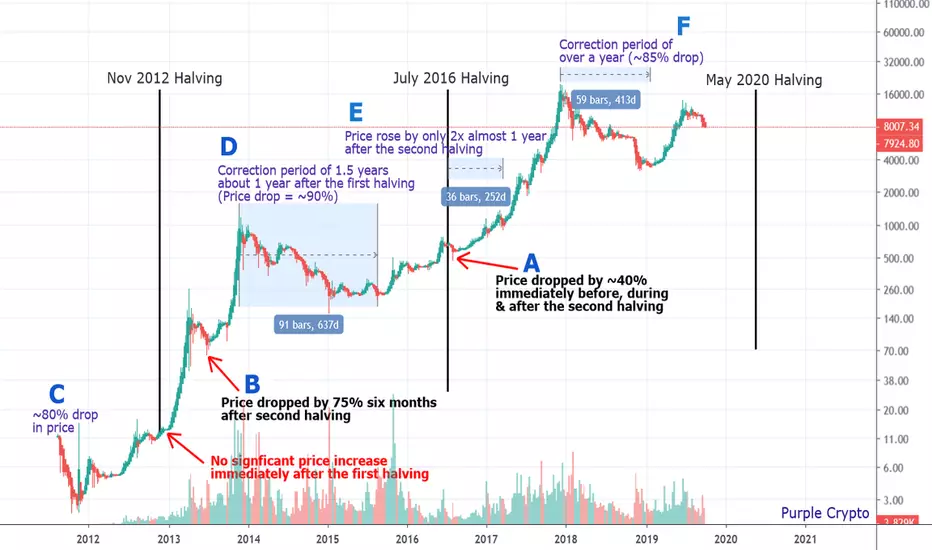
Bitcoin Halving DemystifiedI was recently asked of my opinion on how I could possibly come up with a Papa Bear Projection Chart where the correction period takes over a year long - one that takes us well into next year, and into and over the next Bitcoin halving date of May 2020. I figured it would be easier to simply print a chart for reference.
A picture speaks a thousand words. Here's a history of Bitcoin halvings - all two of them.
A. The first and the only point pertinent to the question that was asked of me is point A - the second BTC halving which occurred in July 2016 where the price of Bitcoin dropped ~40% immediately BEFORE, DURING and AFTER it.
Need I say more? The rest of this post is for educational purposes.
B. Here, the price dropped by 75% six months after the first halving (that should have said first on the chart).
C. A drop in price of approximately 80% in its early days (11.85 to 2.22) and one year before the first halving.
D. A correction period of over 1.5 years where the price dropped by about 90% between the two halvings (1163 to 152).
E. The price rose by 100% one year after the second halving. As an analogy, in today's terms, it would rise from 3000 to 6000 or 8000 to 16000 one year after the next halving (I'm not saying this is what will happen).
F. A correction period of over a year where the price dropped by ~85% (~20000 to ~3000).
Bitcoin has had more elongated correction periods and FAR MORE drops in price than it has had halvings. A third correction period of over a year or another drop in price is neither an abnormality nor a deviation from the "norm".
I guess the only reason I can think of as to why people think my projection seems so absolutely absurd is because they be dreamin' of owning Maseratis and Mansions and they be wantin' it now.
Do I think halvings have anything to do with the price of Bitcoin (all one of the two halvings which had no significant correlation, where the price did not increase immediately after the halving and only increased months later in line with the trend it was in prior to the halving)? None whatsoever.
Do I expect the price of Bitcoin to increase in the future? Yes, but only after it corrects.
What is clear from this chart is that BTC, just like any other stock or crypto, goes through cycles.
I can't predict when the corrections will end but I can forecast where it will likely finish based on its cycle and technical analysis, and that is what I am most concerned with at Purple Crypto Premium.
Adios amigos.
What goes up must come down.
My Secret Papa Bear Chart
It Played Out Like a Beautiful Melody
Are We Ready for the Crash?
Are We There Yet?
What If It Goes Down? Future Projection
___________________________
There's only one person you need to follow when it comes to crypto.
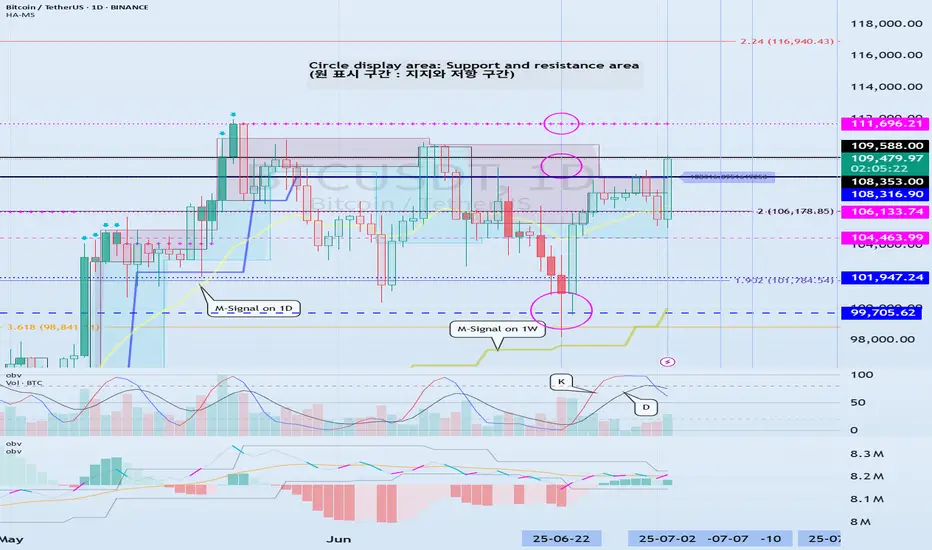
Check support at 108316.90-111696.21
Hello, traders.
If you "Follow", you can always get new information quickly.
Have a nice day today.
-------------------------------------
(BTCUSDT 1D chart)
Among the many trend lines, the one marked 1W is the important one.
Therefore, we need to look at whether it can rise above the 1W trend line or rise along the trend line.
If not, and it falls below 108316.90, it may lead to further decline, so we need to think about a countermeasure for this.
This volatility period is expected to continue until July 3, but it is expected to last until July 11, so caution is required when trading.
-
Indicators that indicate high points are DOM(60), HA-High, and StochRSI 80.
HA-High and StochRSI 80 are formed around 108316.90, and DOM(60) is formed at 111696.21.
Therefore, the 108316.90-111696.21 section is a high point boundary section, and if it is supported and rises in this section, it is highly likely that a stepwise uptrend will begin.
The conditions for a stepwise uptrend to begin are:
- The K of the StochRSI indicator must show an upward trend below 80,
- The PVT-MACD oscillator indicator must show an upward trend above the 0 point,
- The OBV of the Low Line ~ High Line channel must show an upward trend. If possible, it is better for the Low Line ~ High Line channel to form an upward channel.
When the above conditions are met, I think that if it is supported and rises in the 108316.90-111696.21 section, it is highly likely that a stepwise uptrend will continue.
If the above conditions are not met, it is likely that it will show a downward trend again while pretending to rise.
-
Thank you for reading to the end.
I wish you successful trading.
--------------------------------------------------
- This is an explanation of the big picture.
(3-year bull market, 1-year bear market pattern)
I will explain more details when the bear market starts.
------------------------------------------------------
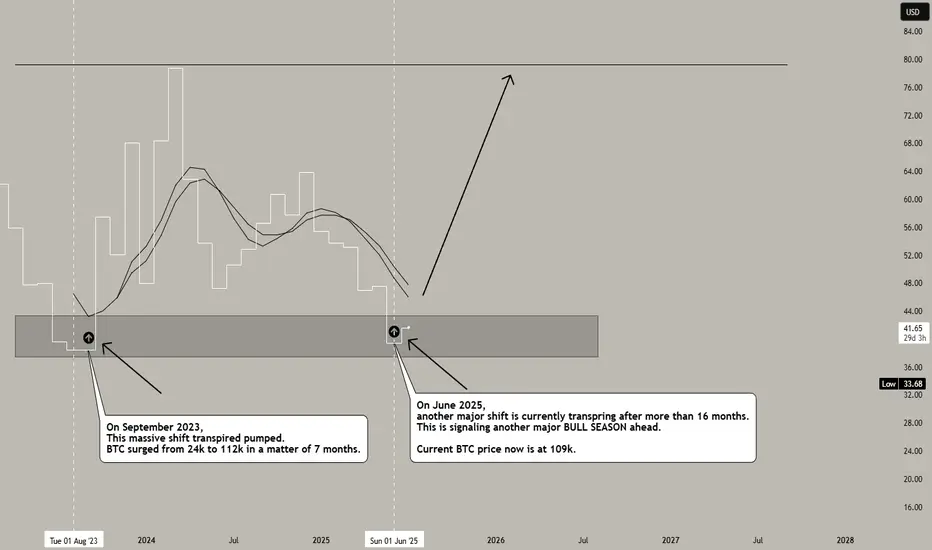
BVIV major BULL season ahead, BTC (from 106k) and ALTS ↑↑↑BVIV volatility index is a major confluence that 99% don't look at. Proof of this is there are only 3 posts about it, and one of them is mine lol. This is the 4th one. So you know its special.
This btc index is a major predictor of the market. When this shifts majorly, the whole market gets magnetized by it in massive scale.
Based on the current long term metrics. BVIV is hinting of another monster shift. It took 16 months for this signal to resurfaced. Last one was from September 2023, where BTC surge from 24k to 112k in 7 months. And as of this writing, June 2025 another big shift is transpiring after 16 months of long wait -- conveying another major ascend ahead in the next coming months.
Ideal seeding season is now -- you cant miss out because this change in structure doesnt come often. When this shows up, YOU SHOW UP. :)
Expect some weighty rise on the next few seasons. Market will be very very generous.
Spotted at 106k btc / 2400 eth.
Targets: Sky is the limit.
TAYOR.
Trade safely.
Not financial advice.
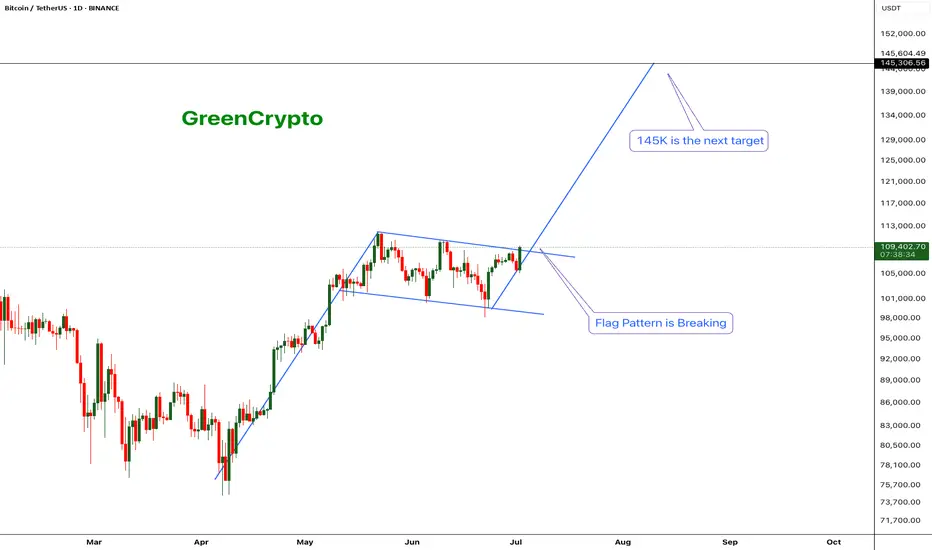
Bitcoin - Flag pattern is brokenBitcoin had been consolidating within a flag pattern for the past three months. That pattern has now officially broken to the upside, with the price surging to $109K — a strong bullish signal fueled by encouraging news around institutional adoption.
Based on both the technical flag breakout and ongoing fundamental momentum, the next target for Bitcoin is $145K. Any move beyond that would be considered a bonus in this current bull cycle.
Stay tuned for more updates.
Cheers,
GreenCrypto