Three White Soldiers & Three Black CrowsHello, Traders! 😎
In technical analysis, not all candlestick patterns are created equal. While some merely hint at indecision or short-term corrections, others shout with conviction: "Trend reversal is coming…" Two of the most powerful momentum candlestick formations are the Three White Soldiers and the Three Black Crows. When they appear, traders PAY ATTENTION. In this article, we’ll dive deep into: What do these patterns look like? Why do they form? What do they tell us about market psychology? How to trade them?+ Their limitations 👇🏻
What Are Three White Soldiers and Three Black Crows?
These Are Multi-Candle Reversal Patterns That Suggest A Strong Shift In Market Sentiment:
Three White Soldiers. A 🐂bullish reversal pattern that occurs after a downtrend. It consists of three consecutive long-bodied green (or white) candles, each closing higher than the last, and ideally opening within the previous candle’s real body.
Three Black Crows. A 🐻bearish reversal pattern that shows up after an uptrend. It’s made of three consecutive long-bodied red (or black) candles, each closing lower than the last and opening within the previous candle’s real body. They signal not just a change in price, but a shift in power, from sellers to buyers (or vice versa).
Candles With a Message
Unlike most one-candle signals or minor patterns, these sequences tell a real story. They show that one side has taken clear control over the market — not for an hour, not for a single day, but for multiple sessions. And that kind of shift, especially on higher timeframes like daily or weekly charts, is something seasoned traders pay close attention to.
Let’s get into the psychology for a second. Imagine you’re a trader who just watched BTC drop for two weeks. Then out of nowhere, three strong green candles appear, each more bullish than the last. You’re seeing buyers push through resistance levels like they don’t even exist. That’s not just a bounce, that’s confidence. That’s the kind of thing that makes people FOMO back in, or finally close out their shorts. Same with the Black Crows. If the price has been climbing and suddenly sellers start hammering it for three days straight? That’s not retail panic. That’s big money exiting.
Now, How do Traders Trade Them?
Well, a lot of people jump in right after the third candle closes. If you’re going long on the Three White Soldiers, you’re betting that the breakout has legs. Same for shorting the Black Crows.
But, and here’s the trap, not all of these patterns play out. Sometimes, that third candle is the climax, not the beginning. So confirmation matters. Volume should increase. The move should break a recent key level. Indicators like RSI or MACD should support the shift. Otherwise, you might just be catching the end of a move, not the start of one.
Another mistake? Ignoring context. These patterns mean nothing if they’re forming in the middle of chop or during low-volume holiday trading. They work best when they signal the end of exhaustion.
And let’s be honest. Even if the pattern is clean, you still need a plan. Stops should go below the first green candle (for bullish setups) or above the first red one (for bearish setups). If price moves against you, it means momentum never really shifted. That’s your cue to get out fast.
Final Thoughts
Three White Soldiers and Three Black Crows are powerful tools in the hands of a patient trader. Of course, these patterns aren’t perfect. They don’t account for time, so a 3-day move might seem powerful, but if it happens slowly over 12-hour candles, it’s not as strong as the same pattern on a daily chart with volume.
The takeaway? These are patterns worth knowing, not because they’re magic, but because they reflect a real shift in market behavior. When Three White Soldiers or Three Black Crows show up in the right place, at the right time, with the right confirmation… that’s when charts stop being random and start making sense. But remember. They are indicators, not guarantees. The best traders use them in conjunction with other tools and a clear trading plan.
BTCUSDT

BTCUSDT 1D – Retesting Key Support, Will Bulls Hold the Line?Bitcoin is retesting a crucial structural support level around $112K after its recent local top near $120K. This zone previously acted as resistance and is now being tested as support — a textbook bullish continuation signal if it holds.
Historically, these flips (from resistance to support) have triggered strong upside momentum, as seen after the $78K breakout earlier this cycle. However, failure to hold this level could open the door for a deeper correction toward $100K or even the $90K region.
This chart outlines the major structural zones:
Long-term accumulation base near $70–78K
Resistance flip zone at $110–112K
Local resistance near $120K
📌 If bulls defend this zone and reclaim momentum, we could see another push toward cycle highs. If not, patience is key — the next high-conviction entry may come lower.
How are you positioning around this zone? Let me know in the comments 👇

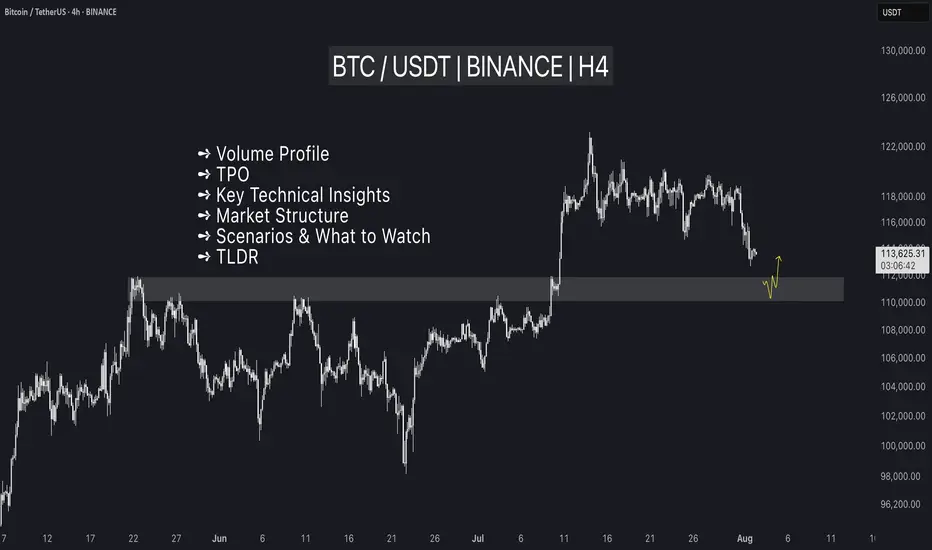
Bitcoin: Expected Cool-Off or Cause for Concern?After rallying more than 25% off the June lows, Bitcoin is finally taking a breather with a much-anticipated pullback. But as expected, the fear meter is spiking, especially across CT.
Was this cool-off really a surprise? Not quite.
The signs were there: price stalling at upper extremes, responsive sellers stepping in at perceived overextensions, and inefficient zones left behind during sharp impulsive moves.
Of course, reading it in real-time is easier said than done. Emotions always complicate execution , but that’s a separate conversation.
In this post, let’s break down the current structure in detail —using volume profile, TPO charts, and market structure analysis, to give you a clearer picture of what’s unfolding. We’ll also explore a few scenarios worth watching as the next move shapes up.
Let’s dive in!
Table of Contents
➺ Volume Profile
➺ TPO
➺ Key Technical Insights
➺ Market Structure
➺ Trade Scenarios and What to Watch
➺ TLDR
⦿ Volume Profile
Currently, we’re seeing two key zones of balance : one broad range that held for over 60 days and a tighter 21-day structure that formed at higher levels. These are classic areas of value where buyers and sellers found temporary agreement, establishing balance.
The sharp move from ~111,000 to ~122,000 was largely impulsive , with little volume built along the way, suggesting initiative buying in early July. As is often the case with such thin zones, they tend to get revisited once momentum fades. That’s exactly what we’re seeing now.
As price dips into this low-volume pocket, the key question is:
Will the market accept this zone and begin building value here, or will it reject and bounce back toward higher ground?
Looking at the Volume Range Visible Profile (VRVP) since June 7th, the nearby Value Area High (VAH) sits around ~111,000 . If current support doesn’t hold, this becomes the next major volume magnet. That said, there’s also a low-volume node (LVN) just above 111,000 , which could act as a demand pocket and trigger a responsive bounce.
In simple terms:
– Acceptance into the LVN could lead to new range formation at lower levels
– A sharp bounce off ~110,000 might reestablish the prior higher balance, or create a fresh range between the two existing areas
The next few sessions will reveal whether the market is hunting for new value or just shaking out weak hands.
⦿ TPO
Zooming into the 4H TPO chart, we can clearly see the evolving monthly profiles from May through August. And as is often the case, the market found resistance right where you’d expect: at the extremes.
The upper end of July’s profile became a battleground. Buyers attempted multiple pushes above that upper balance, but each effort was consistently faded by responsive sellers , signaling growing exhaustion at the top.
Eventually, that pressure gave way to an impulsive breakdown, driven by initiative selling. Notably, price didn’t rotate gently back into the previous range, but it sliced straight into a thin zone of prior low participation.
Now, the market is sitting at the low-volume region , and the next key battle is shaping up. Additionally, The 108,000 to 110,000 area carries weight as it served as the Value Area High (VAH) for both the May and June profiles. If buyers are going to respond, this is one of the more likely places for them to step in.
⦿ Key Technical Insights
▸ Failed Acceptance Above 21-Day Balance
Repeated attempts to hold above the short-term balance were rejected, signaling buyer fatigue and a lack of conviction at higher levels.
▸ Initiative Sellers Took Control
Once demand dried up, sellers stepped in aggressively. The thin participation during the recent rally left little structural support, allowing price to drop quickly.
▸ No Value Built Below Yet
The zone currently being tested saw minimal trading earlier. If bulls want to reclaim control, they’ll need to build value here and establish a new base.
▸ Prior Balance High as Potential Support
Price is now retesting the top of the 60+ day balance area from above, a classic setup where previous resistance can become support. This area also aligns with a known demand shelf.
▸ Deviation Below the 200 MA Cloud
Price has slipped below the 200 MA cloud and is nearing a key flip zone. A test of the 110,000 level next week wouldn’t be surprising. That area could serve as a strong support zone where a new accumulation phase begins.
⦿ Market Structure
The broader market structure points to a transition in progress. After spending over two months in balance , price broke out to the upside —only to form another short-lived range at higher levels. That, too, gave way to a swift breakdown.
This kind of “failed acceptance at higher prices” is often an early signal that the market may revisit prior zones of interest, typically areas where value was last built.
All eyes now shift to the 110,000–111,000 zone , the high of the previous 60-day balance.
We’re in a classic test-retest phase, where the market is probing for conviction . These moments often set the stage for the next significant move, either continued distribution lower, or the beginning of a re-accumulation phase.
⦿ Scenarios & What to Watch
As Bitcoin pulls back into key structural zones, several scenarios are in play. Here's what to monitor in the coming sessions:
Scenario 1: Re-Acceptance into 21-Day Balance
▸ If price reclaims and holds above ~116K, we could see a rotation back toward the upper end of the short-term balance near ~120K.
▸ This would suggest the recent breakdown was a failed auction or bear trap, not the start of a broader trend reversal.
▸ Watch for initiative buying above the demand shelf with follow-through volume.
Scenario 2: Choppy Mid-Balance Activity
▸ Price remains range-bound between ~110K and ~116K, forming a new short-term balance zone.
▸ Expect slower movement and back-and-forth behavior as the market decides its next direction.
▸ Patience is key here. Watch volume and initiative behavior to gauge strength.
Scenario 3: Rejection and Continuation Lower
▸ If price fails to hold above ~110K, there’s potential for a move down to the POC near ~104K, or even deeper toward ~100K (Value Area Low).
▸ These are low-volume zones, which rarely offer strong support unless new value is built.
▸ This would signal a continuation of the current imbalance and potentially mark a structural trend shift.
I’m primarily focused on Scenario 1 and 2 , as we appear to be in a late bull phase. A deeper pullback toward 100K increases the risk of a broader trend change, making it less attractive from a risk/reward standpoint.
⦿ TLDR
▸ Buyers failed to hold the top of the 21-day balance. Clear signs of exhaustion.
▸ Price dropped into a prior low-volume zone, which now acts as potential demand.
▸ This area has never been accepted before - either buyers step in, or we go lower.
▸ Reclaiming ~116K could fuel a move back toward 120K+.
▸ Failure to hold ~110K opens the door to 104K, maybe even 100K.
What happens next week will likely set the tone for the next major move. Watch how the market responds to acceptance vs rejection zones, and let price action confirm your bias before you act.
If you found this analysis helpful, share it with someone who trades Bitcoin. 🥰
What’s your read on the current structure? Let me know in the comments! 📉
⚠️ Disclaimer
As always, this post is purely for educational purposes. I am not a financial advisor, and nothing here should be taken as financial advice. Always consult your financial advisor before making any investment or trading decisions. Or at the very least, consult your cat. 🐱
TradeCityPro | Bitcoin Daily Analysis #142👋 Welcome to TradeCity Pro!
Let's get into the Bitcoin analysis. Yesterday, Bitcoin continued its correction and we need to see what is going to happen in the market today.
📅 Daily Timeframe
First, let’s take a look at the higher timeframe. On the daily chart, that curved upward trendline we had was broken by yesterday's candle, and the breakout candle had high volume.
✔️ For now, I don’t consider this trendline as broken and I’m waiting to get confirmation of the break.
🔍 Currently, the price is in a correction phase, and this correction is quite natural since the price had very low volatility for a long time and was stuck below the 120000 zone.
💥 But no trend reversal has occurred yet. In my opinion, as long as the price is above the 110000 zone, the trend is bullish, and I will consider the trend reversal confirmed only if a lower high and a lower low below 110000 are formed.
⏳ 4-Hour Timeframe
Yesterday, the corrective movement of the price continued, and after a pause at the 0.5 Fibonacci level, another bearish leg formed down to the 0.618 zone.
🔔 The RSI oscillator also entered the oversold area and then exited it again. I believe there’s a high possibility that until the end of the week, Bitcoin will range in these areas and the probability of a bullish or bearish move is much lower.
🔽 However, if the 0.618 Fibonacci level breaks, the price can move to lower areas like the 111000 zone. I think the likelihood of this happening in the future is high because that zone is a strong PRZ, and at the same time, it counts as a pullback to the 110000 zone.
📈 In the bullish scenario, if the price is supported from this area and starts to move upward, since we currently have no highs below the 116000 zone, we need to wait until the first bullish leg is formed and then enter on the second leg after the new high is broken.
⚡️ For now, I’m not opening any short or long positions. I prefer the price to form more structure so I can make a more comfortable decision.
❌ Disclaimer ❌
Trading futures is highly risky and dangerous. If you're not an expert, these triggers may not be suitable for you. You should first learn risk and capital management. You can also use the educational content from this channel.
Finally, these triggers reflect my personal opinions on price action, and the market may move completely against this analysis. So, do your own research before opening any position.

#BITCOIN - Short-Term Options [EXPLAINED]As expected, the price dumped below the descending channel , currently consolidating right below one's support level.
As expected, the price dumped below the descending channel , currently consolidating right below one's support level. On the chart I've described two possible options for the price movement: strictly positive and hmm.. okey.
Strictly positive: some consolidation below the support with, then quick retrace back inside the channel and new upward rally on the next working week. Entering LONG position will make sense after the breakout of the $116,500 resistance, not earlier.
Hmm.. okey: Bitcoin is not strong enough to come back inside the channel and dumps to $111,000 support level. Near this level we must see some consolidation to gather more power. Possible fakes down to $108,000. In some time (1 week+) we will have chances of going back up.
👉 Overall, the support of $111,000 is crucial right now. If we lose it, Bitcoin goes towards $100,000 and the current bullish phase might be considered as finished. For now we still have chances.

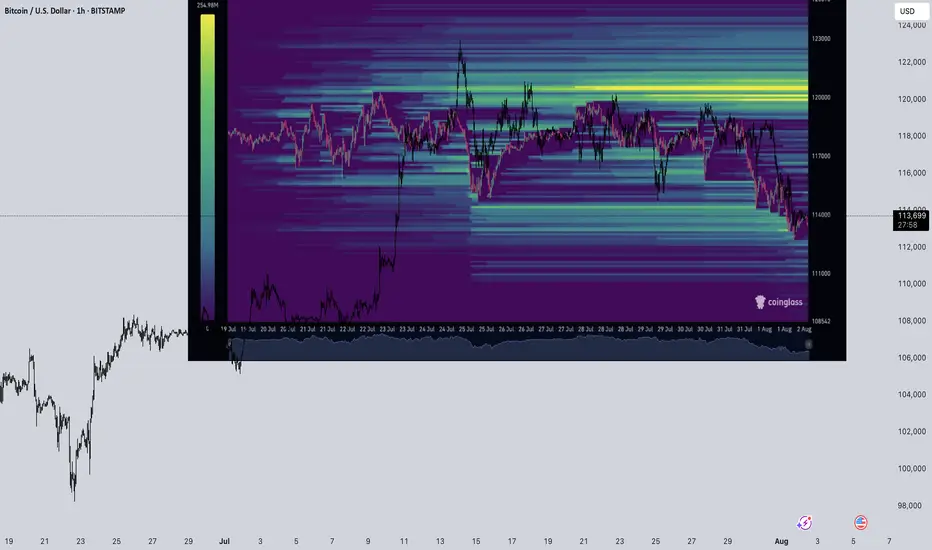
Btc / UsdtBITSTAMP:BTCUSD
"Bitcoin cleaned out the downside. Now all eyes on the untouched upside. Liquidity is a magnet — and BTC follows it."
Disclaimer : Not financial Advice
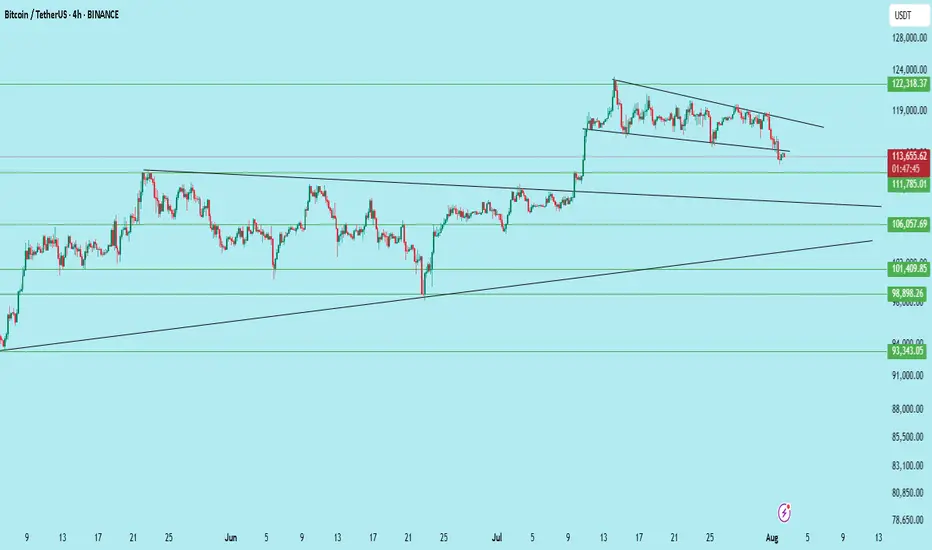
$BTC /USDT – Breakdown from Channel, Bears Gaining ControlBitcoin has broken down from its descending channel on the 4H chart after repeated rejection from the upper trendline. Price is now hovering near key support at $111,785.
Key Technicals:
Rejection from the descending trendline resistance
Breakdown of the mini-channel structure
Current price: $113,637
Support levels:
$111,785 (Immediate)
$106,057
$101,409
$98,398
Bearish continuation is likely if $111,785 breaks with volume
If the $111.7k zone fails to hold, BTC could see further downside toward $106k and even $98k in the coming sessions.
Invalidation: Bullish only on reclaim of $117K+ with strength.
DYOR | Not Financial Advice
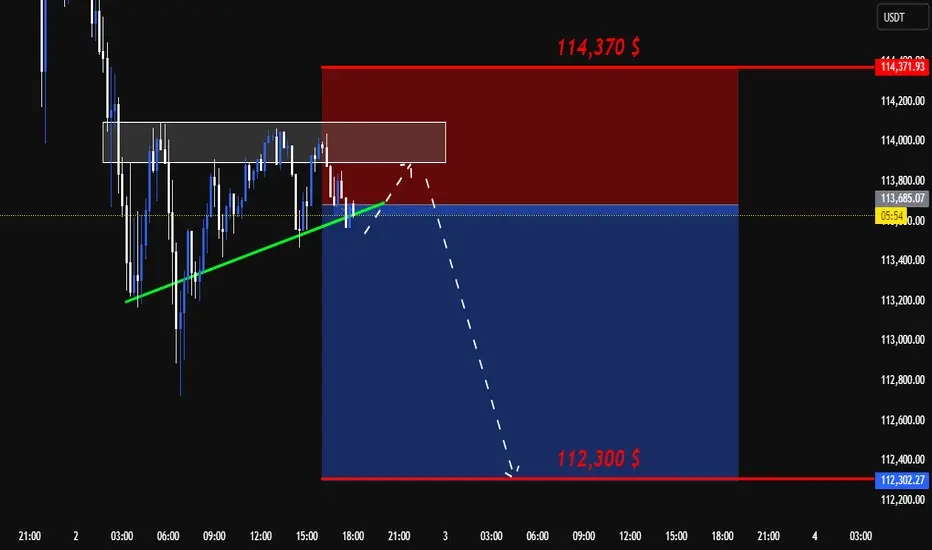
BTC SHORT SETUP INTRADAY ( 02 AUG 2025 )If you have doubt on our trades you can test in demo.
Details:
Entry: 113,680 $ - 113,450 $
Target Price: 112,300 $
Stop loss: 114,370 $
Trade Ideas:
Idea is clearly shown on chart + we have some secret psychologies and tools behind this.
What is required to Join VIP?
- Nothing just you have to share 10% of your profit with us at the end of the month which you earned from our signals. Yeah this is just the requirement, trade where ever you like your favorite broker or else you don't need to pay fees first or create account thru our link.
Trade Signal:
I provide trade signals here so follow my account and you can check my previous analysis regarding BITCOIN. So don't miss trade opportunity so follow must.
BINANCE:BTCUSDT BINANCE:BTCUSDT.P BINANCE:BTCUSD
Bitcoin’s Game Has Changed: Fresh Support Zone, Targets Sky-HighHey Dear Friends,
Until recently, Bitcoin had been stuck in a range between 112,331 and 105,344 for quite some time. But that range has now been clearly broken. So, what does this mean? This zone, which used to act as resistance, is now expected to flip and act as support.
According to my weekly trading model, the long-term target levels I’m tracking for Bitcoin are: 127,818 – 137,000 – 146,000.
Since this is a weekly setup, it might take a while for these targets to play out. Even if we see pullbacks to the 112K, 105K, or even 100K levels, I expect to see strong buying pressure from that zone.
I’ll keep sharing regular updates as this setup develops.
To everyone who’s been supporting and appreciating my work—thank you, truly. Your encouragement means the world to me and keeps me motivated to keep showing up. Much love to all of you—I’m grateful we’re in this journey together.

Bitcoin buy setupHi everyone.
I think this area has a good potential to set an order and take at least 1% profit out of it..
Let's see how it reacts to this level...
Please consider the risk management.
Goodluck

BTCUSDT: Elliot Wave AnalysisAs you can see in the chart, the fourth wave has ended and there is a possibility of an increase in the next stage to the level between 128,000 and 131,000, followed by a correction for a larger fourth wave and finally the last leg of the increase to the fifth wave, which has the possibility of reaching 139,000 to 140,000.

Reversal from Channel Bottom or a Real Breakdown? Identifying th
🎯 BTCUSDT - Analysis
🔹 Analysis Date: 1 August 2025
📉BTCUSDT:
Price is currently moving inside an ascending channel and has touched the bottom of the channel again, offering a potential buy opportunity.
However, for those seeking a low-risk entry, the zone around 118,000 could be ideal—if price returns to the channel and confirms support.
Although it seems the channel’s lower boundary might break, this could be a fake break to mislead traders before a rebound.
The support at 110,000 is a crucial short-term level; if it fails, a deeper correction toward 98,090 or even 94,000 is likely.
Our targets remain at the upper boundary of the channel.
⚠️ Risk Management Tip: Wait for confirmation near 118,000 if unsure, and always size positions based on overall volatility.

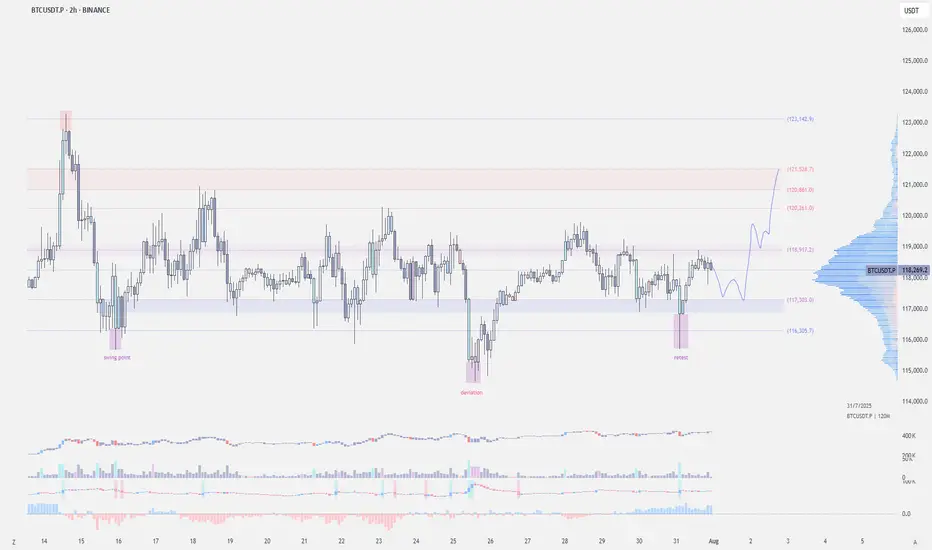
$BTC - Swing Point RetestCRYPTOCAP:BTC | 2h
We've got a swing point retest at 115.7k after the deviation at 114.6k
For bullish continuation, holding above 117.3k-116.8k is key — any break below invalidates the setup.
A clean break above the 120k resistance, I'm expecting we could finally tag 121k–122k (untested supply zone).
#BTC Update #12 – July 31, 2025#BTC Update #12 – July 31, 2025
Bitcoin is currently at the upper boundary of the channel it has been following. It may experience a pullback from this upper boundary. This pullback is estimated to reach the $116,800 level. If it wants to go lower, it could drop as far as the $114,500 level.
There is a significant amount of liquidity between $121,000 and $117,000. Bitcoin may also try to sweep this area. However, despite 4 or 5 attempts, it still hasn’t managed to break above the upper resistance zone. Therefore, a pullback should always be taken into account.
Overall, Bitcoin is still in a correction within a correction. That means no impulsive move has occurred yet. It’s not at a suitable point for either long or short positions. You may choose to trade within this range, but keep in mind that it's quite risky.
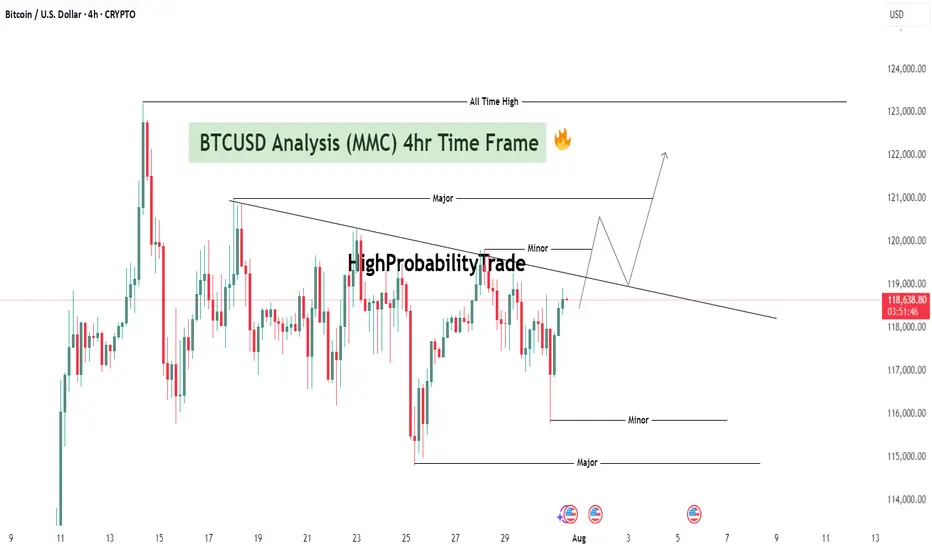
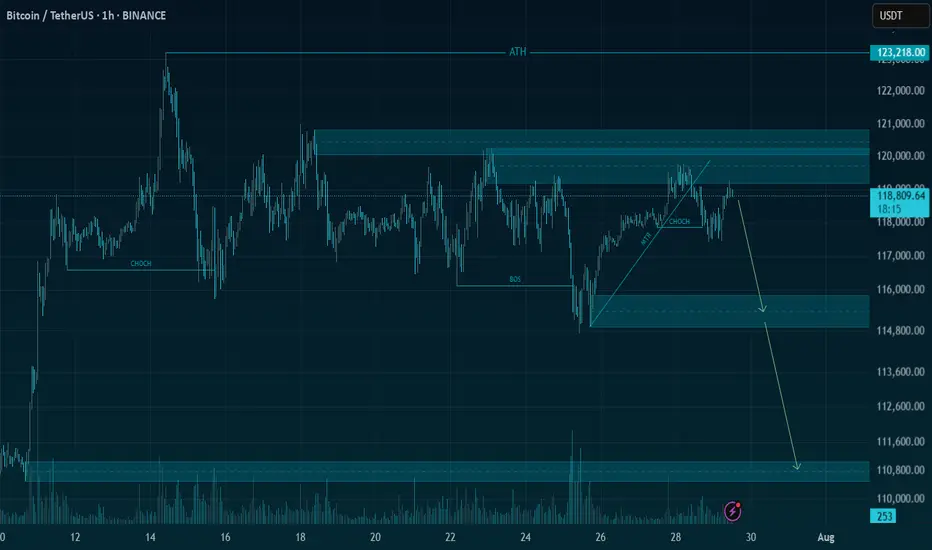
BTCUSD Analysis : Major Breakout Setup | Big Move Loading"Bitcoin Coiling Below Key Resistance – Breakout or Trap?"
🔍 Technical Overview:
Bitcoin is currently trading within a compressed range, sitting just below a key descending trendline that has capped upside movement for multiple sessions. Price is consolidating between minor highs and lows, hinting at a build-up of momentum for the next breakout move.
The setup presents a classic compression inside a bearish wedge, but with increasing bullish pressure evident from higher lows and wick rejections near minor supports.
🧱 Detailed Technical Breakdown:
🔸 1. Descending Trendline Structure
Price has formed a downward sloping resistance line from earlier highs.
This trendline has acted as a dynamic ceiling, rejecting multiple bullish attempts.
Each time price approaches it, the rejection gets weaker, indicating a possible breakout attempt soon.
🔸 2. Multiple Minor & Major Zones
Minor Resistance: Around $118,800–$119,200
A short-term ceiling that has paused bullish rallies.
Price needs a clean break and close above this to initiate momentum.
Major Resistance: ~$121,000–$121,200
This zone aligns with a previous significant swing high.
A break above here could result in strong bullish continuation toward ATH levels.
Minor Support: ~$117,000
Price has repeatedly bounced from this level.
A breakdown would indicate fading bullish strength and open the downside.
Major Support: ~$115,000
A historically strong demand zone.
If BTC fails all bullish attempts, this would be the final defense for buyers.
🧠 Market Psychology Insight:
Price is trapped between aggressive short-term sellers and accumulating buyers.
Buyers are placing confidence in this area by defending higher lows.
Sellers are still protecting the trendline, but with each retest, the defense weakens.
This is a classic equilibrium zone where liquidity is building—once imbalance hits, a strong impulsive breakout (either direction) is likely.
Volume and momentum should be watched closely as a breakout with confirmation may trap the opposite side, leading to a strong move (short squeeze or long liquidation).
🔮 Scenario Forecasts:
📈 Bullish Breakout Scenario:
Price breaks above $119,200 → minor resistance flips to support
Retest of the broken trendline confirms a bullish breakout
Price targets:
First Target: $121,000–$121,200 (major resistance)
Second Target: $122,500+
Third Target: $123,800–$124,000 (All-Time High)
Confirmation Needed: 4H candle close above descending trendline and $119,200 with rising volume.
📉 Bearish Rejection Scenario:
Price gets rejected from the trendline or minor resistance zone
Breaks below $117,000 minor support
Possible targets:
First Target: $116,000 (reaction zone)
Second Target: $115,000 (major support)
A fall below $115,000 could invalidate the bullish buildup and invite strong bearish continuation.
This would signal that bulls failed to reclaim control, and sellers maintain market structure dominance.
📌 Key Levels Summary:
Type Price Range Significance
🔺 All-Time High $123,800–124,000 Final upside target
🔸 Major Resistance $121,000–121,200 Key breakout level
🔹 Minor Resistance $118,800–119,200 Immediate trendline + local supply
🔹 Minor Support ~$117,000 Local demand base
🔻 Major Support $115,000 Last line of defense for bulls
🧭 Conclusion & Strategy:
Bitcoin is approaching a make-or-break zone under a significant descending trendline. Price compression is tightening, and a breakout looks imminent.
Traders should stay patient and wait for confirmation—either a breakout and successful retest for longs or a rejection and trendline defense for shorting opportunities.
Whether it’s a breakout toward $121K and ATH, or a drop toward $115K support, this setup offers a high-probability trade opportunity for both bulls and bears depending on the confirmation.
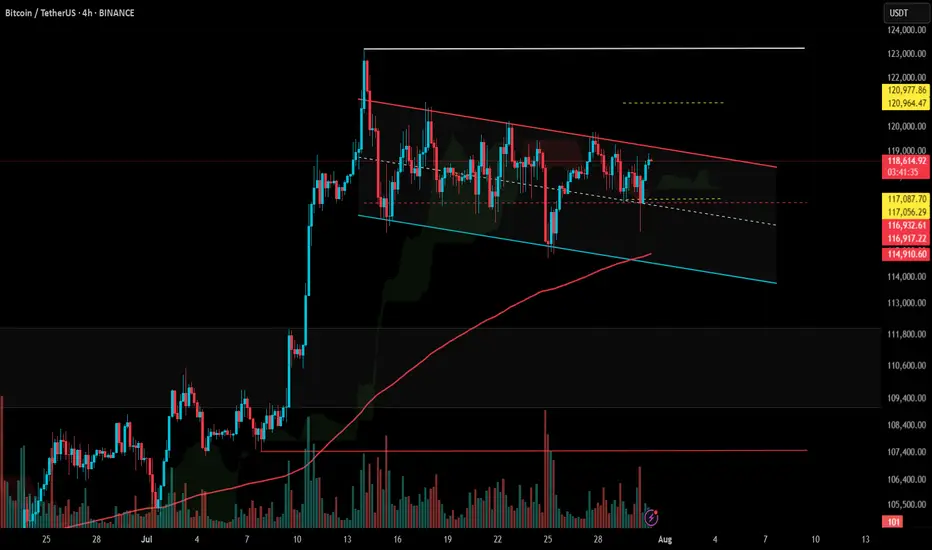
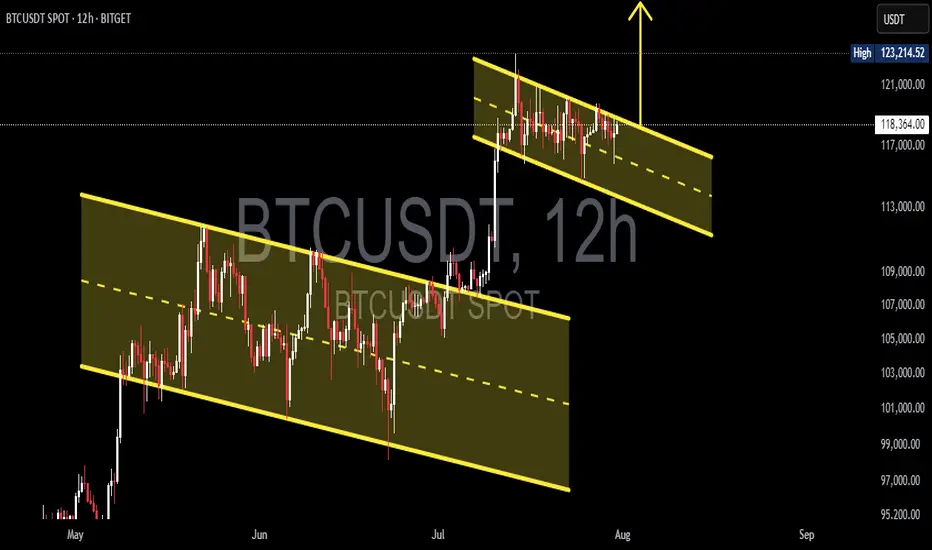
Bullish Flag Forming on BTCUSDT – Is the Next Big Move Coming?🧠 Complete and Insightful Technical Analysis:
The 12H BTCUSDT chart is currently showcasing a textbook Bullish Flag pattern, a powerful continuation structure that often precedes major upward moves.
---
🏗️ Pattern Breakdown: Bullish Flag
1. Flagpole:
The sharp breakout from around $107,000 to $123,000 marks the impulsive rally — this is the flagpole, created by strong bullish momentum.
Represents the "lift-off" phase where buyers dominate the market.
2. Flag (Consolidation Phase):
After the strong rally, price consolidates inside a downward-sloping parallel channel, forming the flag.
This pullback is healthy, characterized by declining volume, a key feature of the Bullish Flag.
Indicates temporary profit-taking before continuation.
3. Confirmation:
A breakout above the flag's upper boundary (around $123,000 – $124,000) with strong volume would confirm the pattern.
Breakout traders often use this as a high-probability entry.
---
📈 Bullish Scenario (High Probability):
If BTC breaks above the flag structure:
🎯 Measured Move Target (Based on Flagpole Height):
$123,000 + ($123,000 - $107,000) = $139,000
🚀 Potential for further upside if macro conditions and sentiment support the move, possibly reaching $135,000+ in the medium term.
Confirmation Required: A strong candle close above $123,500 with volume spike.
---
📉 Bearish Scenario (If Breakdown Occurs):
If BTC breaks down below the flag (~$117,000):
Retracement likely toward previous breakout zones at $112,000 – $109,000
Such a breakdown could turn the current structure into a fakeout or bear trap
However, this zone may present a strong re-entry opportunity for long-term bulls.
---
📚 Educational Insight for Traders:
Bullish Flags often appear during strong uptrends, acting as a pause before the next leg up.
A healthy pattern shows shrinking volume during the flag and rising volume at breakout.
Traders should monitor key horizontal resistance and volume behavior for confirmation.
---
🧭 Conclusion:
BTCUSDT is at a critical technical juncture. The formation of a clean Bullish Flag suggests the potential for a major continuation rally. Confirmation through a breakout is key — this is the time to prepare, not react.
#BTCUSDT #Bitcoin #BullishFlag #BTCBreakout #CryptoTechnicalAnalysis #CryptoTrading #PriceAction #BTCAnalysis #BitcoinPattern #CryptoEducation #BTCFlag #ContinuationPattern
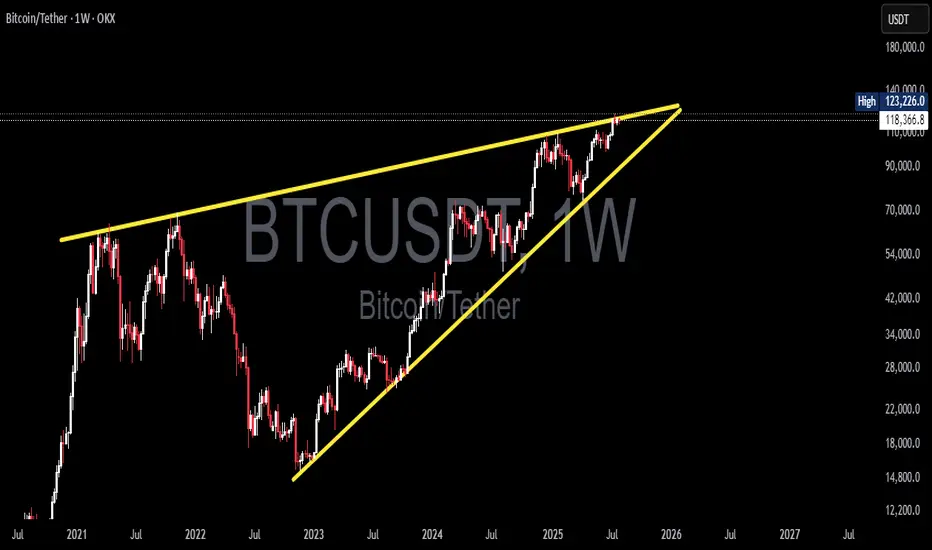
Bitcoin at a Decisive Moment! Rising Wedge Formed — Breakout?🧠 In-Depth Technical Analysis (BTCUSDT – Weekly Timeframe)
Bitcoin is currently trading within a large Rising Wedge pattern, formed over the long term from late 2022 to mid-2025. This structure is typically a bearish reversal formation, although it can also lead to a breakout in strong bull markets.
The wedge is defined by:
Consistently higher lows on the lower trendline
A gradually rising upper resistance line that currently caps price around $123K–$125K
Decreasing volume, indicating consolidation and energy buildup near the apex
This wedge reflects a period of euphoric price action post-2022 bear market accumulation, with price now testing the top of a historically significant resistance zone.
---
📊 Key Price Levels:
🔹 Current Price: ≈ $118,436
🔹 Recent Weekly High: $123,226
🔹 Critical Resistance (Wedge Top): $123,000–$125,000
🔹 Dynamic Support: Rising wedge base (~$90,000–$95,000)
---
🐂 Bullish Scenario: “Historic Breakout Incoming”
If BTC successfully breaks above the wedge’s upper resistance and closes a weekly candle above $125K with strong volume, it would signal a confirmed breakout from the long-term wedge structure.
📈 Upside Targets:
🎯 Target 1: $140,000
🎯 Target 2: $155,000+ (based on Fibonacci extension and macro targets)
🚀 A breakout of this magnitude may trigger a new parabolic rally, especially if accompanied by:
Increased institutional adoption
Spot ETF inflows
Favorable macroeconomic shifts (e.g., rate cuts)
---
🐻 Bearish Scenario: “False Breakout or Breakdown Risk”
If Bitcoin fails to break out and faces strong rejection from the resistance zone (possibly a false breakout), the rising wedge formation may break down — leading to a steep correction.
📉 A breakdown from this structure often leads to sharp drops due to:
Overextension of the current trend
Distribution phase by smart money
🎯 Downside Targets:
Support 1: $95,000–$90,000
Support 2: $76,000
Major Support: $54,000 (historical demand & EMA zones)
---
🔍 Optional Indicators for Chart Confirmation:
Weekly RSI: Watch for bearish divergence
Volume Profile: Can highlight distribution or accumulation zones
EMA 21/50: Ideal for identifying dynamic support levels in retracements
---
📌 Conclusion:
Bitcoin is at a crucial inflection point within this multi-year Rising Wedge. A confirmed breakout could lead to new all-time highs, while a breakdown may trigger a broad correction. Traders should prepare for high volatility, wait for clear confirmation signals, and manage risk wisely in this pivotal zone.
#Bitcoin #BTCUSDT #RisingWedge #BTCBreakout #TechnicalAnalysis #CryptoMarket #PriceAction #BearishReversal #CryptoSignal #ChartPattern #BitcoinAnalysis #Cryptocurrency
Will BTC ever reach 130k?Yes in your dreams, I am joking, it can but not now, blue shows what fall can trigger when massive selloff happens, and here it looks the smaller momentum to happen soon!

BTC/USD – 4H Short Setup AnalysisBitcoin is currently trading within a defined range under macro resistance. The chart shows price stalling below a key supply zone, with rejection from the upper Keltner Channel and diagonal resistance (yellow trendline). A local bearish divergence appears to be playing out as momentum fades.
📉 Short Position Setup:
Entry: $119,275 (supply retest)
Stop Loss: Above local high / top channel boundary
Targets:
TP1: $117,163 (38.2% Fib)
TP2: $115,858 (61.8% Fib)
TP3: $113,746 (full measured move)
Confluence:
Bearish rejection near multi-touch trendline resistance
Lower high formation after extended consolidation
Heikin Ashi candles showing loss of bullish momentum
Watch for: Breakdown of the white trendline support to confirm momentum shift. Invalidation if BTC closes strongly above $120,000.
Timeframe: 4H | Strategy: Range Reversal + Fib Confluence

Important Volatility Period: August 2nd - 5th
Hello, fellow traders!
Follow us for quick updates.
Have a great day!
-------------------------------------
(BTCUSDT 1M Chart)
Let's take a moment to check the trend before the new month begins.
There have been two major declines so far, and a third major decline is expected next year.
For the reason, please refer to the "3-Year Bull Market, 1-Year Bear Market Pattern" section below.
-
My target point for 2025 is around the Fibonacci ratio of 2.618 (133889.92).
However, if the price surges further, it could touch the Fibonacci range of 3 (151018.77) to 3.14 (157296.36).
If it rises above 133K, it's expected that prices will never fall below 43823.59 again.
Since the HA-Low indicator hasn't yet been created on the 1M chart, we need to monitor whether it appears when a downtrend begins.
Based on the current trend, the HA-Low indicator is expected to form around 73499.86.
More details will likely be available once the movement begins.
-
The basic trading strategy involves buying in the DOM(-60) ~ HA-Low range and selling in the HA-High ~ DOM(60) range.
However, if the price rises above the HA-High ~ DOM(60) range, a step-up trend is likely, while if the price falls below the DOM(-60) ~ HA-Low range, a step-down trend is likely.
Therefore, the basic trading strategy should be a segmented trading approach.
The further away from the HA-High indicator, the more likely it is that the DOM(60) indicator will act as a strong resistance when it forms.
Therefore, if the current price and the HA-High indicator are trading far apart, and the DOM(60) indicator forms, it is expected to face significant resistance.
-
Looking at the current trend formation, the high trend line is drawn correctly, but the low trend line is not.
This is because the StochRSI indicator failed to enter the oversold zone.
Therefore, the low trend line is marked with a dotted line, not a solid line.
Therefore, what we should pay attention to is the high trend line.
We need to see if the uptrend can continue along the high trend line.
-
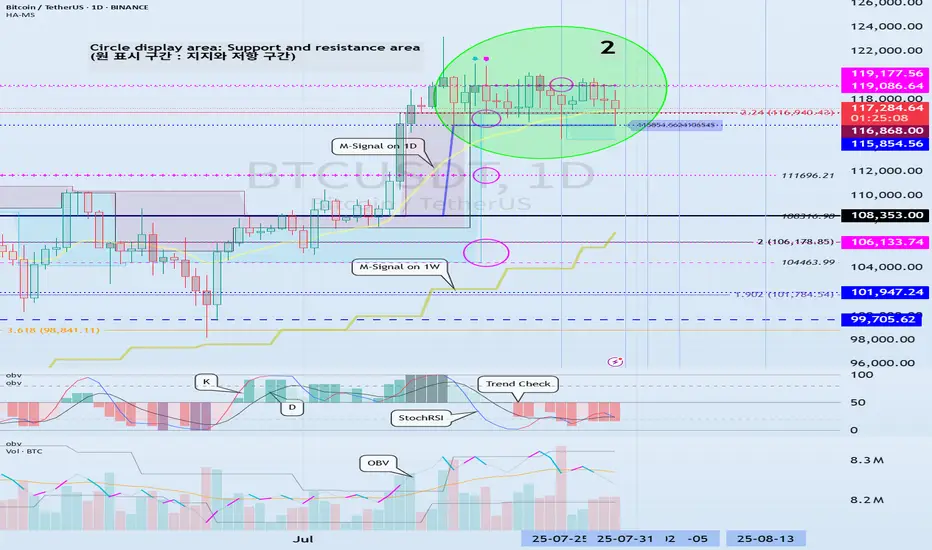
(1D chart)
If we use the trend lines drawn on the 1M, 1W, and 1D charts to predict periods of volatility, the periods around August 5th and August 13th are significant periods of volatility.
By breaking this down further, the volatility periods are around July 31st, August 2nd-5th, and August 13th.
Therefore, trading strategies should be developed based on the assumption that the volatility period extends from July 30th to August 14th.
The current price is moving sideways in the 115,854.56-119,177.56 range.
This range, the HA-High ~ DOM (60), is a crucial area to consider for support.
This will determine whether the price will continue its upward trend by rising above 119,177.56, or whether it will turn downward by falling below 115,854.56.
If the price falls below 115854.56, it is expected to meet the M-Signal indicator on the 1W chart and reestablish the trend.
The HA-High indicator on the 1W chart is forming at 99705.62, and the DOM (60) indicator on the 1W chart is forming at 119086.64.
Therefore, when the price declines, it is important to check where the HA-High indicator on the 1W chart forms and determine whether there is support near that point.
-
The On-Board Value (OBV) indicator within the Low Line ~ High Line channel is showing a downward trend.
If the OBV falls below the Low Line, the price is expected to plummet.
Therefore, it is necessary to closely monitor the movements of the OBV indicator.
The Trend Check indicator is a comprehensive evaluation of the StochRSI, PVT-MACD Oscillator, and On-Board Value (OBV) indicator.
The TC (Trend Check) indicator interprets a rise from the 0 point as a buying trend, while a decline indicates a selling trend.
In other words, a rise from the 0 point is likely to indicate an uptrend, while a decline is likely to indicate a downtrend.
Currently, the TC (Trend Check) indicator is below the 0 point, suggesting a high probability of a downtrend.
However, if the TC (Trend Check) indicator touches a high or low, the trend may reverse.
In other words, touching a high increases the likelihood of a reversal from an uptrend to a downtrend, while touching a low increases the likelihood of a reversal from a downtrend to an uptrend.
When such movements occur, it's important to consider the support and resistance levels formed around the price level to determine a response.
In other words, consider the support and resistance levels formed at the current price level.
As a significant period of volatility approaches, prepare to transition from box trading to trend trading.
-
Thank you for reading to the end.
I wish you successful trading.
--------------------------------------------------
- Here's an explanation of the big picture.
(3-year bull market, 1-year bear market pattern)
I'll explain more in detail when the bear market begins.
------------------------------------------------------
BTCUSDT | Bitcoin needs liquidity to be able to go up more🚀 Trade Setup Details:
🕯 #BTC/USDT 🔽 Sell | Short 🔽
⌛️ TimeFrame: 1H
--------------------
🛡 Risk Management:
🛡 If Your Account Balance: $1000
🛡 If Your Loss-Limit: 1%
🛡 Then Your Signal Margin: $1204.82
--------------------
☄️ En1: 118829.28 (Amount: $120.48)
☄️ En2: 119162.54 (Amount: $421.69)
☄️ En3: 119400.34 (Amount: $542.17)
☄️ En4: 119638.61 (Amount: $120.48)
--------------------
☄️ If All Entries Are Activated, Then:
☄️ Average.En: 119283.83 ($1204.82)
--------------------
☑️ TP1: 118025.43 (+1.05%) (RR:1.27)
☑️ TP2: 117427.5 (+1.56%) (RR:1.88)
☑️ TP3: 116671.89 (+2.19%) (RR:2.64)
☑️ TP4: 115717.73 (+2.99%) (RR:3.6)
☑️ TP5: 114673.35 (+3.87%) (RR:4.66)
--------------------
❌ SL: 120276.34 (-0.83%) (-$10)
--------------------
💯 Maximum.Lev: 66X
⌛️ Trading Type: Swing Trading
‼️ Signal Risk: ⚠️ High-Risk! ⚠️
🔎 Technical Analysis Breakdown:
This technical analysis is based on Price Action, Elliott waves, SMC (Smart Money Concepts), and ICT (Inner Circle Trader) concepts. All entry points, Target Points, and Stop Losses are calculated using professional mathematical formulas. As a result, you can have an optimal trade setup based on great risk management.
⚠️ Disclaimer:
Trading involves significant risk, and past performance does not guarantee future results. This analysis is for informational purposes only and should not be considered financial advice. Always conduct your research and trade responsibly.
💡 Stay Updated:
Like this technical analysis? Follow me for more in-depth insights, technical setups, and market updates. Let's trade smarter together!
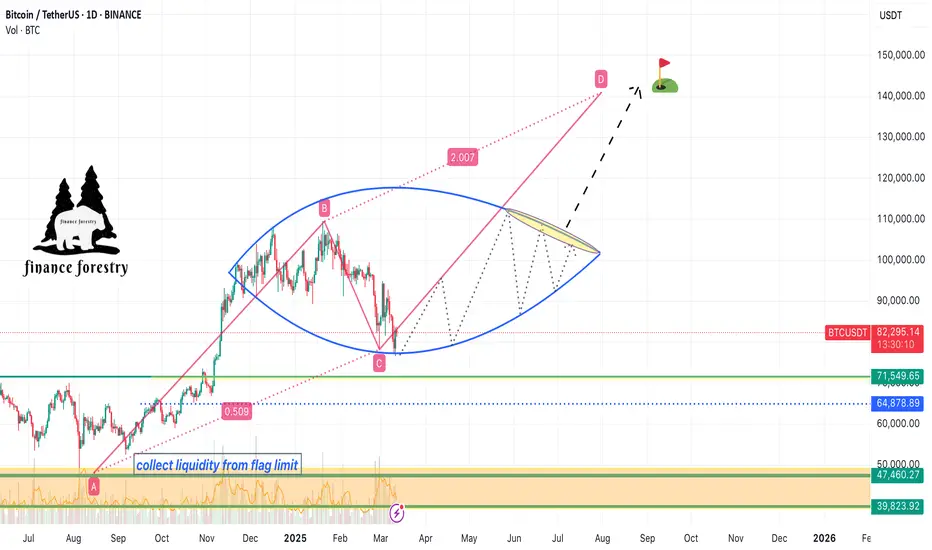
Bitcoin's Natural Correction and the $141K Target Based on Fibonhello dear trader and investors
The cryptocurrency market is always accompanied by strong fluctuations and natural corrections. Bitcoin, as the market leader, requires corrections and liquidity accumulation after each significant rally to pave the way for higher price targets. In this article, we analyze Fibonacci structures and harmonic patterns to demonstrate that Bitcoin's next target could be $141K.
1. Bitcoin Corrections: A Natural Part of an Uptrend
Price corrections in bullish trends are a normal phenomenon that helps shake out weak hands and allows major players to accumulate liquidity. Historically, Bitcoin has experienced 20-30% corrections before resuming its upward trajectory. The current correction is no different and may serve as a base for the next strong move toward higher targets.
2. The $141K Target Based on Fibonacci
Fibonacci levels are among the most reliable tools for predicting price targets. Assuming Bitcoin's recent high was around FWB:73K and the ongoing pullback is a healthy retracement, we can use harmonic AB=CD pattern to project potential upside targets. Based on these levels, Bitcoin could reach $141K in the next bullish phase.
Confirmation Through Harmonic Patterns
Harmonic patterns like Butterfly and Gartley suggest that the current correction is forming a potential reversal structure. If this correction completes within the PRZ (Potential Reversal Zone), Bitcoin could see a strong continuation of its uptrend. The Fibonacci ratios in these harmonic structures indicate that the final price target for this bullish wave could be around $141K.
Volume and Liquidity: Key Drivers for the Rally
Bitcoin needs increased volume and liquidity inflows to reach higher levels. On-chain data shows that trading volumes are rising and large investors (whales) are accumulating rather than selling. This behavior typically precedes a strong bullish move.
Bitcoin's current correction is entirely natural, and technical structures suggest that it could be laying the foundation for a new bullish wave. Based on Fibonacci and harmonic pattern analysis, Bitcoin's next major target is around $141K. Traders and investors should consider these levels in their analysis and avoid emotional decisions during market corrections
good luck
mehdi
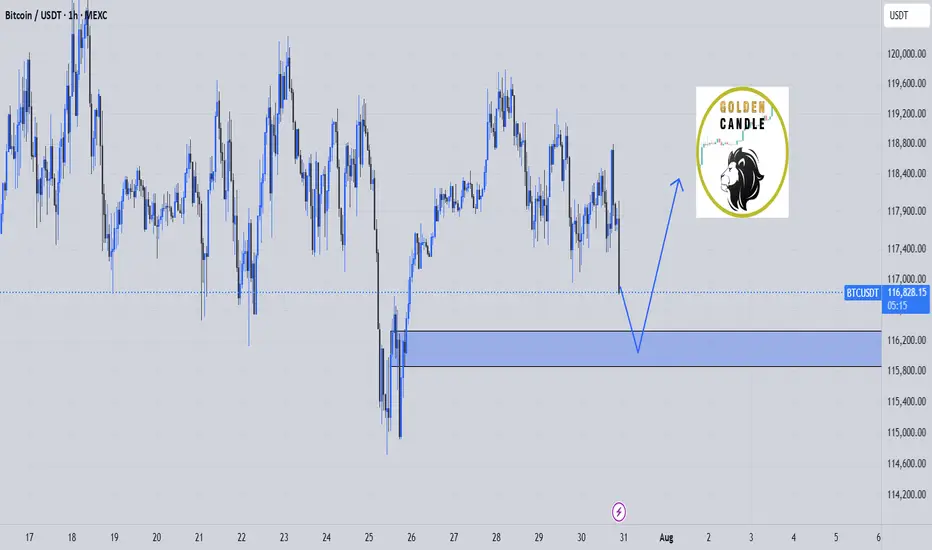
btc buy midterm"🌟 Welcome to Golden Candle! 🌟
We're a team of 📈 passionate traders 📉 who love sharing our 🔍 technical analysis insights 🔎 with the TradingView community. 🌎
Our goal is to provide 💡 valuable perspectives 💡 on market trends and patterns, but 🚫 please note that our analyses are not intended as buy or sell recommendations. 🚫
Instead, they reflect our own 💭 personal attitudes and thoughts. 💭
Follow along and 📚 learn 📚 from our analyses! 📊💡"