$TOTAL – Is This Another Bull Trap in the Making?The total crypto market cap ( CRYPTOCAP:TOTAL ) has surged from $2.32T and is currently trading around $3.25T, continuing its upward trajectory. On the surface, things look bullish—but is there more to the story?
Looking at the chart, the current market structure bears a striking resemblance to previous cycles:
• 2021: Massive bull run
• 2022: Painful bull trap
• 2024: Another explosive rally
• 2025: …potential bull trap?
If history is any guide, we could be nearing a critical turning point. The pattern suggests caution—could this rally be setting up for another steep correction?
My Take: Momentum is strong, but the similarities to past cycles are too close to ignore. If the market stalls at current levels, the risk of a bull trap becomes very real.
What do you think—repeat of history or a new chapter for crypto?
Please support this idea with a LIKE👍 if you find it useful🥳
Happy Trading💰🥳🤗
BTCUSDT

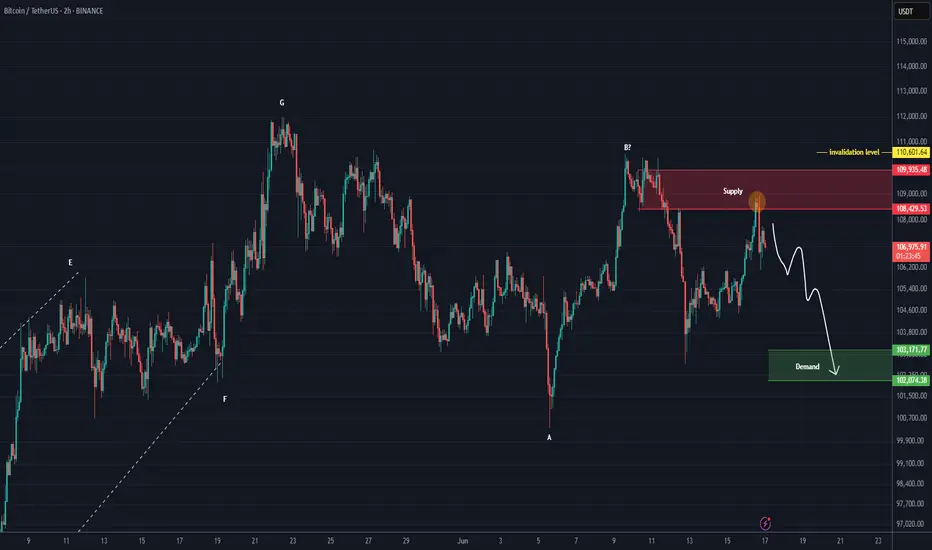
BTC is still bearish (2H)This analysis is an update of the analysis you see in the "Related publications" section
The red zone seems to have had enough orders to reject the price downward. It is expected that the price will drop at least to the green zone below.
There will be some fluctuations along the way.
A daily candle closing above the invalidation level would invalidate this analysis.
For risk management, please don't forget stop loss and capital management
Comment if you have any questions
Thank You
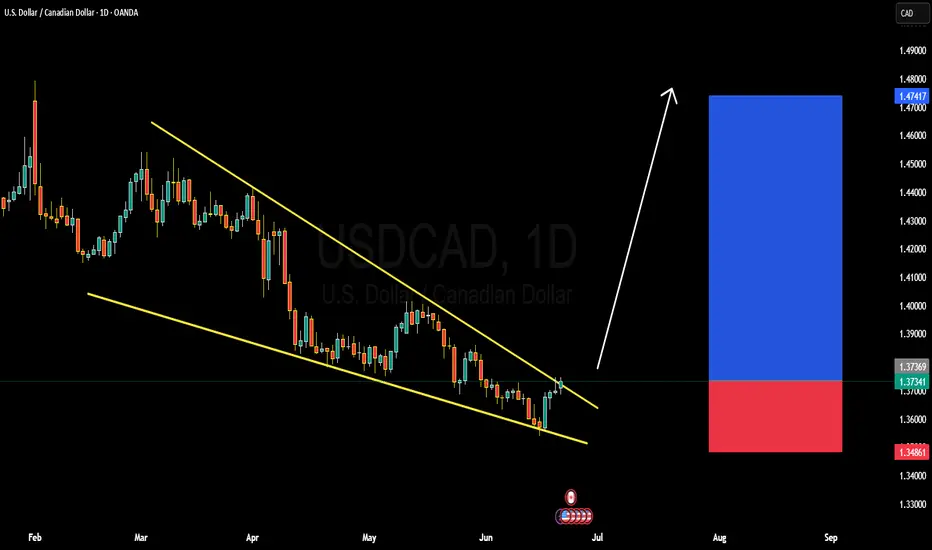
USDCAD DETAILED ANALYSISUSDCAD has formed a classic falling wedge pattern on the daily timeframe, with price currently pressing against the upper trendline resistance near 1.37300. This is a high-probability bullish reversal setup, and the pair is showing early signs of a potential breakout. The recent bullish momentum from the lows suggests buyers are stepping in aggressively, and if we get a strong daily close above the wedge, it could confirm the start of a new upward leg. My near-term target for this breakout is 1.47300, offering an excellent risk-reward profile.
From a fundamental perspective, the Canadian Dollar is currently under pressure due to weakening oil prices and softening domestic economic data. The Bank of Canada has recently signaled a dovish tilt following its latest rate cut in June, citing slower GDP growth and easing inflation. On the other hand, the US Dollar is finding renewed strength backed by sticky inflation and the Fed’s cautious stance on rate cuts. The divergence in monetary policy between the Fed and BoC is creating a favorable environment for USDCAD bulls.
Technically, the confluence of wedge resistance, bullish divergence on the RSI, and a clear higher low formation all point toward a breakout scenario. A break above 1.37600–1.38000 would unlock the next wave of bullish continuation, potentially accelerating momentum toward the 1.47 handle. This area also aligns with the previous March highs, making it a strong technical magnet.
I remain bullish on USDCAD and will be watching the breakout closely this week. If the pair holds above 1.36800 and breaks structure convincingly, I’ll be adding to longs on confirmation. The current setup presents a textbook breakout opportunity supported by strong fundamentals, technical structure, and market sentiment leaning in favor of the USD.
The Pattern That Could Launch BitcoinSpotted a long-term inverted head & shoulders pattern forming over a 7–8 month stretch on Bitcoin — much more reliable than short-term setups. If this bullish structure plays out, we could be looking at a breakout that pushes BTC firmly into price discovery.
I’ve included local Fibonacci levels on the chart, though I couldn’t fit the macro one (going from $4k → $69k → $15k — the 1.618 extension of that larger swing lands at $119,800. That could be a key resistance target if we clear the ATH and continue the uptrend. After that, there's the smaller timeframe, but more recent, fib ext 1.618 sitting at $131k.
I'd be very cautious of a failed pattern if $101k doesn't hold. As a last support, 95k and the red 20EMA might hold.
Let’s see how this plays out 🚀
BTCUSDT: buy or sell plans for near futureBTCUSDT: buy or sell plans for near future. Very easy and clear setups are shown. Pay attention to the timeframes that I have indicated. You can either buy or sell immediately after close, or wait for pullback to gain more.
Cheers
Support Tested: Can Bitcoin Withstand Global Fear?CRYPTOCAP:BTC is struggling to hold above the key support zone after losing its rising trendline.
This weakness comes as the Israel-Iran conflict intensifies, shaking global market confidence. While BTC has often acted as a hedge, rising geopolitical tension is pushing investors toward safety, causing hesitation even at critical support levels.
A breakdown here could trigger deeper downside.
DYOR, NFA

$BTC correction: targets 101k, 97.5k, 94k, 87kThe hype is peaking — institutions, banks, Wall Street, and even governments are buying Bitcoin.
Yet despite the frenzy, BTC has been rejected three times around the $110K level and appears to be heading into another correction.
Bitcoin maximalists are pushing a strong FOMO narrative to attract retail investors, but several factors are pushing back:
- Psychological barrier: At these price levels, retail investors are hesitant. Owning just a "fraction" of a Bitcoin doesn’t appeal to the average person.
- Geopolitical tension: The conflict with Iran is serious. This isn’t a small, isolated country — Iran is a millennia-old civilization with global alliances. This situation won't resolve quickly or easily like Libya, Syria, or Iraq.
- Oil price surge: Escalating tensions could disrupt the Strait of Hormuz, a critical route for global oil. Western sanctions on Russia already strain supply — if Iran joins, where will Europe get its energy? U.S. supply won’t be enough. Expect a spike in inflation.
- Recession risks: Persistent inflation could drive a recession in the second half of the year.
- Trade wars & tariffs: No resolution, just chaos.
- Ukraine-Russia war: Still unresolved. Still draining global stability.
In short, the world is burning — and this is terrible for markets.
Bitcoin maximalists — some even selling company shares to buy more BTC — may soon face the harsh reality: Bitcoin needs a deeper flush before it can rally again. Retail won’t return until altseason clears the way and resets sentiment.
In a cycle dominated by propaganda, institutional manipulation, and global unrest, predictions are fragile. The only guide left: the chart.
Technically, we’re in correction mode again. Comparing with past cycles, potential pullback targets are:
$101K, $97.5K, $94K, $87K
There’s massive support at $74K, but it's unlikely we revisit it soon.
Stay cautious. DYOR.
#Bitcoin #CryptoMarket #BTCUpdate #Geopolitics #Altseason #CryptoCorrection #MacroView #CryptoFOMO #RiskAssets #DYOR

BTCUSDTHello traders. Wishing each of you a great weekend ahead!
Even though it's the weekend, I’ve spotted a sell opportunity on the BTCUSDT pair and decided to share it with you. However, we should also keep in mind that weekend markets tend to have lower volume. That said, I will still proceed with this trade based on my own risk parameters and trading strategy.
🔍 Trade Details
✔️ Timeframe: 30-Minute
✔️ Risk-to-Reward Ratio: 1:2
✔️ Trade Direction: Sell
✔️ Entry Price: 103815.32
✔️ Take Profit: 102640.12
✔️ Stop Loss: 104402.06
🕒 If the trade does not continue with strong momentum, I will keep the position open only until 23:00 today. Otherwise, I will close it either in profit or at a loss depending on the price action.
🔔 Disclaimer: This is not financial advice. I’m simply sharing a trade I’ve taken based on my personal trading system, strictly for educational and illustrative purposes.
📌 Interested in a systematic, data-driven trading approach?
💡 Follow the page and turn on notifications to stay updated on future trade setups and advanced market insights.
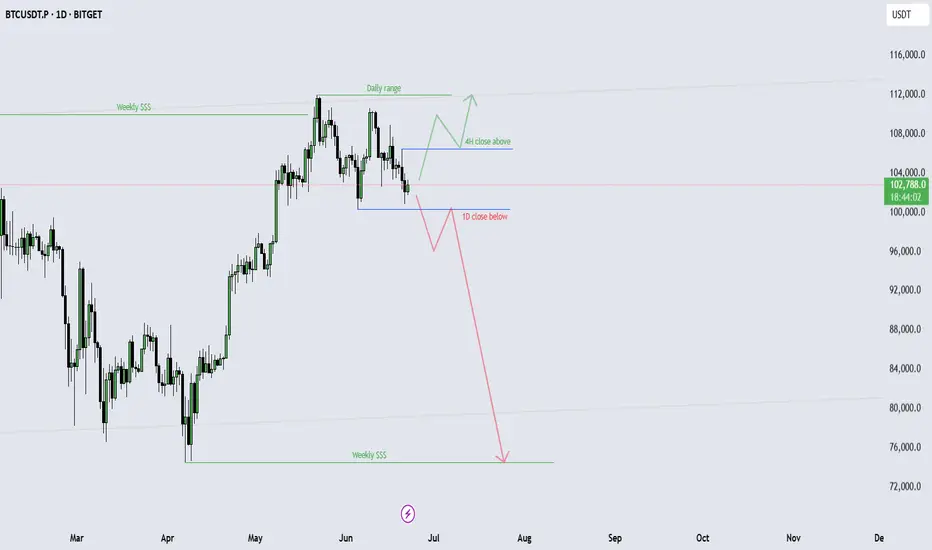
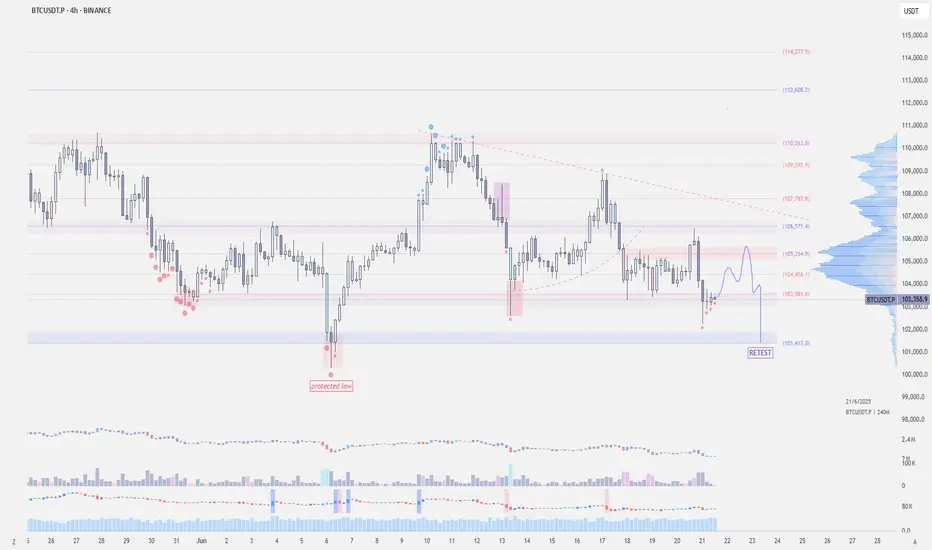
Bitcoin### Bitcoin Price Analysis (June 21, 2025)
#### **Current Price**: $103,236.15 (as of the snapshot)
- The price is hovering near the lower end of the recent range, with key support at **$102,000** (marked as "S/s" on the chart).
- Resistance levels are visible at **$105,000**, **$107,000**, and **$110,000–$114,000**.
#### **Key Observations**:
1. **Support and Resistance**:
- **Strong Support**: $102,000 (critical level; break below could signal further downside).
- **Immediate Resistance**: $105,000 (previous entry point and psychological level).
- **Higher Targets**: $110,000–$114,000 (if bullish momentum returns).
2. **Price Action Context**:
- The price recently rejected the $105,250 level ("Entry") and is now testing lower support.
- The "Profit" markers at $105,000 and $105,026 suggest these were take-profit zones for traders.
3. **Trend and Sentiment**:
- The chart shows consolidation between $102,000–$110,000, with no clear breakout yet.
- A hold above $102,000 could lead to a retest of $105,000, while a break below may target $100,000 or lower.
4. **Volume and Timeframe**:
- The snapshot lacks volume data, but the date range (June–July) suggests a medium-term view.
- Key dates to watch: June 25–28 and early July for potential volatility.
#### **Conclusion**:
- **Bullish Case**: Hold above $102,000 and reclaim $105,000 to aim for $110,000+.
- **Bearish Risk**: Break below $102,000 could accelerate selling toward $100,000 or $99,000.
**Actionable Insight**: Watch the $102,000–$105,000 range for a breakout or breakdown. A rebound from support with volume could signal a buying opportunity, while a drop below $102,000 may indicate further downside.
*(Note: The analysis is based on limited data from the snapshot. For a full assessment, additional indicators like RSI, MACD, and volume would be needed.)*
BTC Consolidates 104000-105000: Bearish Breakdown Looming?BTC Technical Update: Bitcoin has been consolidating within the 104000-105000 range for an extended period, with the overall trend showing a downward bias. With the overall trend tilting bearish, traders should watch for a break below 103500 to confirm the next leg down. 📉
⚡️⚡️⚡️ BTCUSD ⚡️⚡️⚡️
🚀 Sell@ 105000 - 104500
🚀 TP 102500 - 101500
Accurate signals are updated every day 📈 If you encounter any problems during trading, these signals can serve as your reliable guide 🧭 Feel free to refer to them! I sincerely hope they'll be of great help to you 🌟 👇
$BTC - Protected LowBINANCE:BTCUSDT | 1D
Price got strongly rejected at 106.5k
It deviated below the 4-hour mini-range. We now need to see a reclaim of 105–105.1k. If not, a retest of the value area low at 101.4k is likely.
100k remains to be the protected low, and it would be critical if we won't get a valid retest at 101.4k
local resistance: 105-105.5k
local support: 101.4k
protected low: 100k
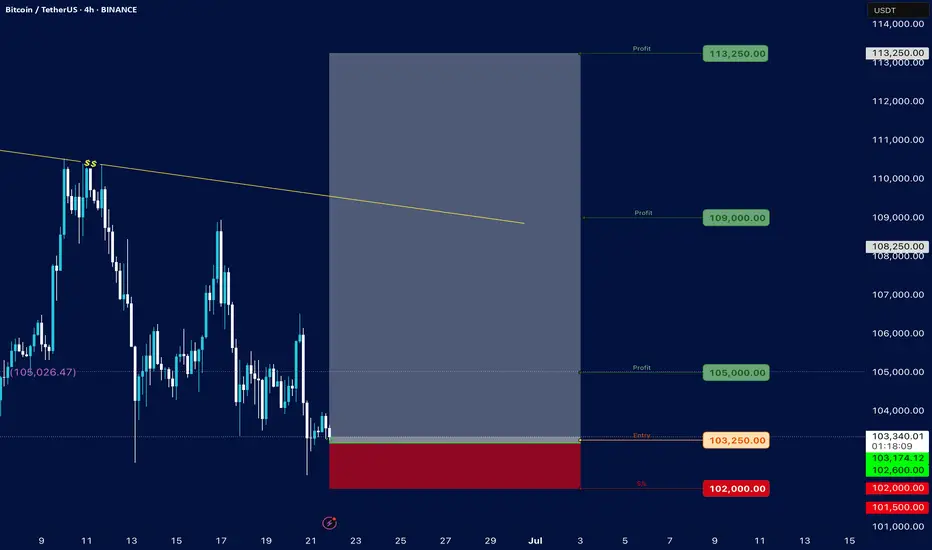
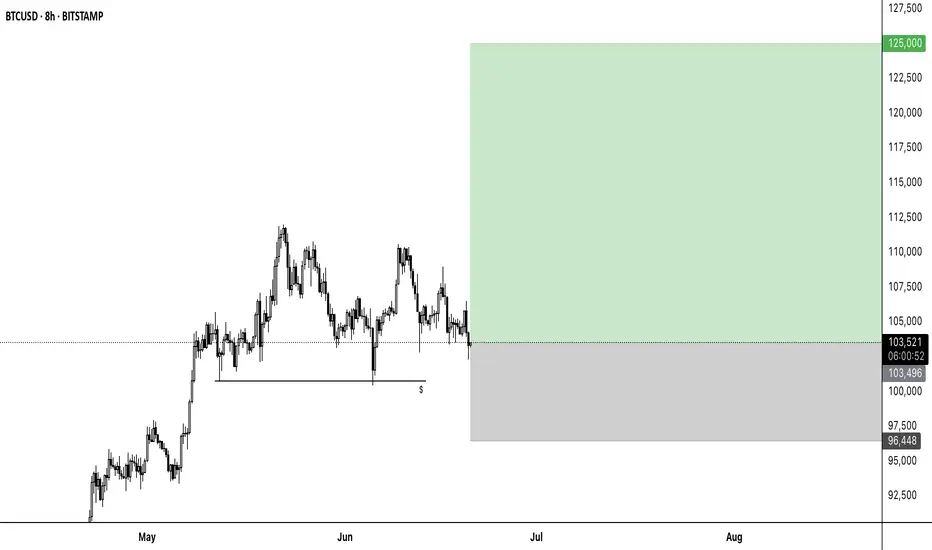
BTC to 125000📈 BTCUSD Long Setup – Maximum Fear Often Marks the Bottom
Timeframe: 8H
Entry: ~103,500
SL: 96,448
TP: 125,000
RR: ~3:1
🧠 Market Sentiment:
The current environment is dominated by extreme fear – sentiment is heavily bearish, and interest from retail investors is strikingly low. Most market participants appear to be short or sitting in hedged positions, which ironically sets the stage for a potential short squeeze if price breaks to the upside.
🔍 Technical Context:
BTC has been ranging for weeks – support has held repeatedly.
Liquidity has been swept below previous lows – possible spring formation.
A reclaim of the 104k–105k zone could act as a launchpad.
Setup anticipates a contrarian move against the prevailing bearish bias
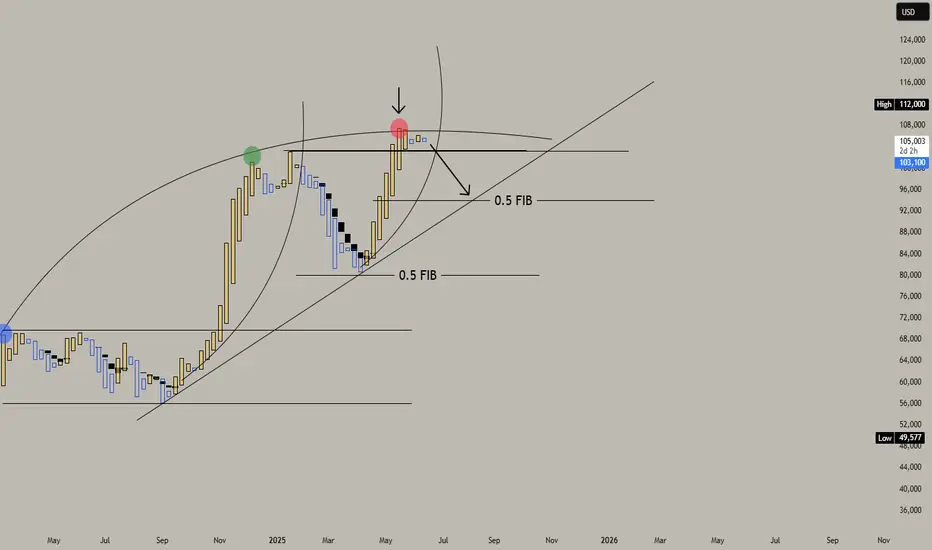
BTC, will hibernate for a few weeks from here to sub 100k.BTC rise has been impressive the last few weeks with market triggering excitement after hitting a series of ATH and finally punching the elusive100k levels, and pushing it further to 110k as a bonus.
But like with any overheated parabolic move, a cool down will need to transpire eventually. And that season is ripe now for the king of coins.
From the diagram we are seeing some curve fitting price action, with horizontal ranging at the upper channel -- indicating a bull saturation scenario.
A corrective phase to 0.5 fib levels maybe expected in the next few weeks. It did the same behavior last time. This hibernation would be healthy in the long run - and it needed to happen.
Spotted at 104k.
Target sub 100k levels / or 0.5 fib at 94k.
TAYOR.
Trade safely.
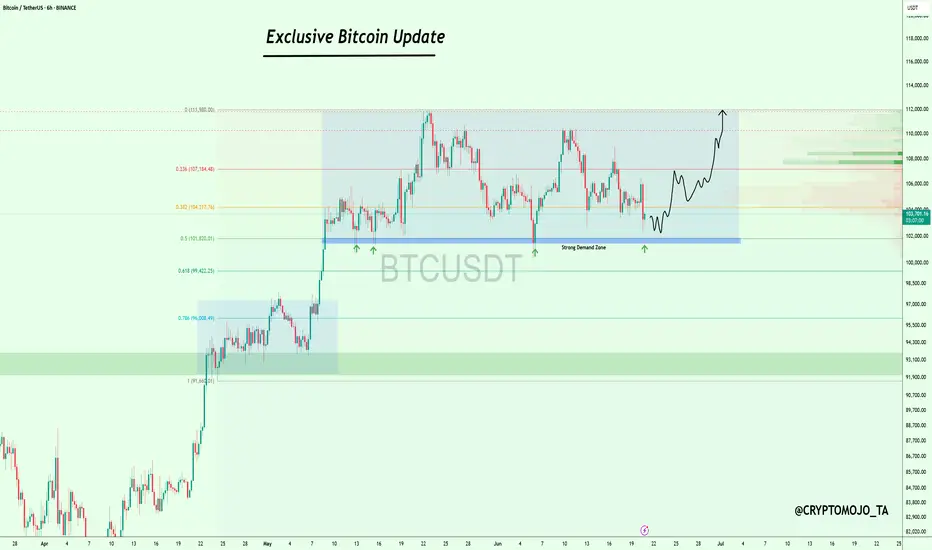
#Bitcoin is approaching a strong demand zone!#Bitcoin is approaching a strong demand zone!
This level has acted as solid support several times in the past.
According to the Fibonacci levels, we’re currently at the 0.5 level, which makes this area even more significant.
In my opinion, we’re likely to see a bounce from here.
However, if the price fails to hold this level, there’s a good chance we’ll retest the $92K zone.
But for that to happen, we need a daily close below $100K.
Until then, we’re still in a safe zone.
I’ll keep you updated as things develop.
If you find my updates helpful, don’t forget to like and follow for more!
DYOR, NFA
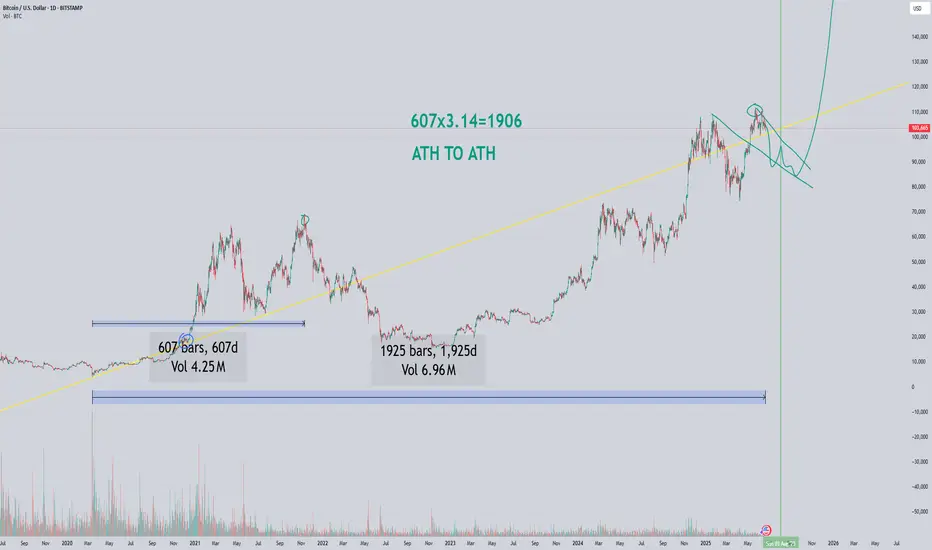
FROM ATH TO ATH BTC FRACTAL use 3.14The graph is fractal and cyclical. I used the number pi to predict where the atx plus might be, taking into account the fractals for bitcoin from previous ideas and the idea for xrp, where the number pi worked perfectly.
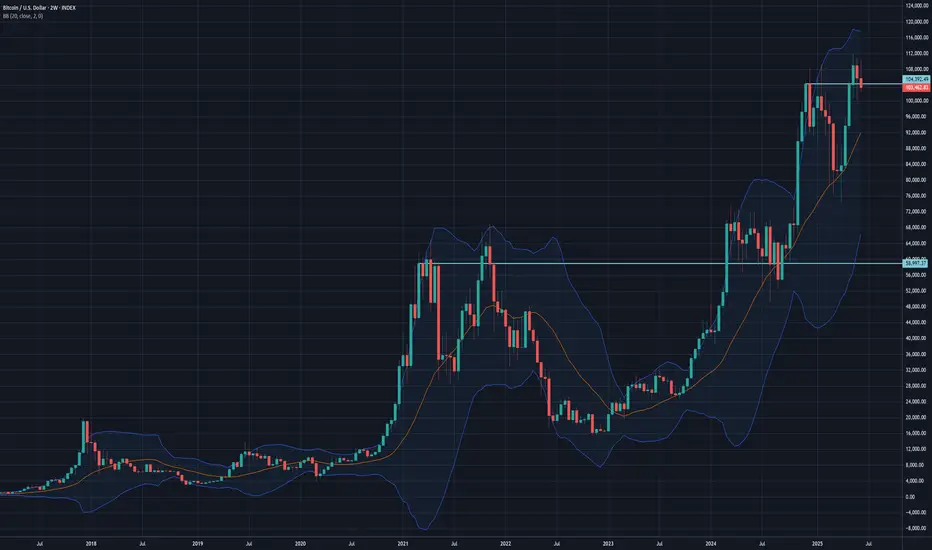
btcusd two weeks trump time scale bearishTrump TACO time scale two weeks looks reasonable time scale
2W candle of #Bitcoin closing this weekend.
If CRYPTOCAP:BTC will not hold the 104000 - game over we visit margin call level of Saylor's Strategy 60 000 and most possibly lower 30 000
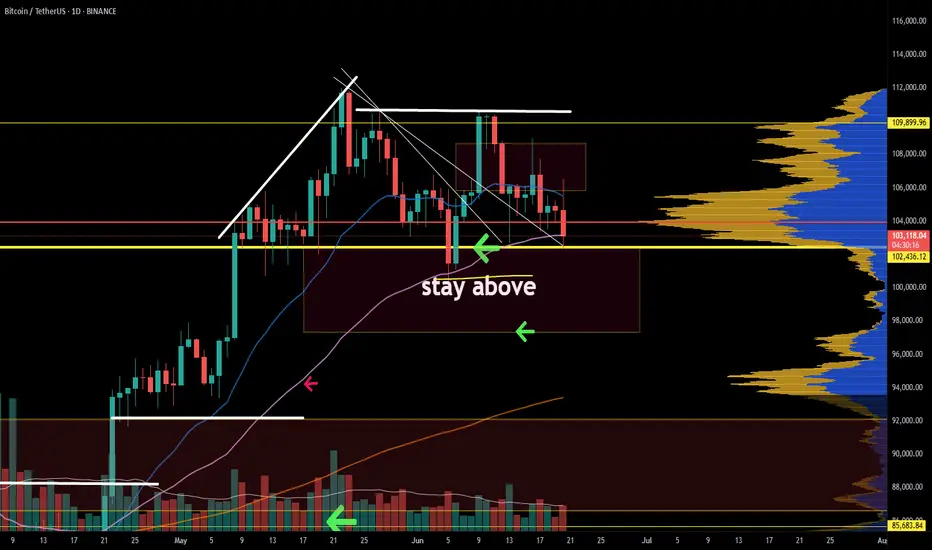
Become Rich Trading Bitcoin Strategy Simplified Correction NullIs this a shakeout or a rejection?
A rejection implies no bullish action short-term thus lower prices. It is still early on the current move.
A shakeout implies a bear-trap and bullish action soon to follow, as soon as the shakeout is complete.
Daily and weekly close
Let's be fair and honest, it is too early to say. To determine if the current move is either a rejection or a shakeout we have to wait for the close today.
Price action
Why are these two in question? Because the daily session moved higher today reaching $106,500 followed by lower prices. The low hit $102,309, lower than 13-June but higher than 5-June, a higher low. More information can be acquired once the trading session closes but, we can move ahead and see what the chart has to say based on other signals.
The volume is low on the bearish side, on all sides. The higher low so far is strong. As long as $102,000 holds Bitcoin is ultra-hyper bullish, very strong. Even if we are considering the short-term it doesn't matter, if the action is happening above this level the bulls are wining and that's what we have.
If the action is happening above $100,000 we already know what this means and this level is not in question right now. Being price oriented that is why I say is still early, do you agree?
So, more shakeouts, more sideways, more retrace—a non-event; short-term noise.
We are looking for the next major move, not the next $1,000 drop.
Market conditions do not change
Rest easy, Bitcoin will continue bullish even if it wicks below 100K. As long as it trades above this level, or the $100,000 to $102,000 price range, the action is safe (coming from the bulls).
If the week closes above this range but starts red next week and goes below, no need to panic because the week can start red just to recover and this would only be a continuation of the shakeout; we take information from the weekly close and not the intra-week action makes sense?
Questions —Leave a comment
So, what is your take?
Just let me know truly, what is your belief?
Do you think Bitcoin is bearish or bullish?
It can be looked at in many different ways.
The bull market
The trend is bullish, mid- to long-term. The action is happening above 100K.
The altcoins market is weak but we all know from the bottom we grow, we are entering the summer now... Ahhh, the beautiful summer, bring the heat. With the summer prices tend to grow.
You can call it a relief rally but that will be only the start. The relief will turn into a major bullish wave and this wave will transform into a major bull run.
Motivation
I love you again wishing you the best forever more.
You deserve the best now and always.
Keep at it and keep trying, persistence is the key. As long as we continue to trade, in the end we are sure to win.
Invest in Crypto, it is very easy.
Think of all the people that joined us (the market) 10 years ago. What are their holdings worth now? Millions upon millions... Now, think of yourself 10 years into the future. Put whatever money in you can afford and watch it grow.
The way to riches is not through frugality or savings, the way to riches is through buying and investing. This is the right market for us. It is fast, it is volatile, it is young; just like most of us. If not young of age, we are young at heart.
Namaste.

BTC has made the perfect market conditions for a trade. BTC setup is very clear. Why? Because the structure is clear. The current price is an inflection point; both bears and bulls are watching to make their next move. May the strongest of the two prevail. 95k or 110k?
Full TA: Link in the BIO
Current BTC Trend Analysis and Trading RecommendationsToday, U.S. markets are closed, leading to light trading activity and relatively limited overall market volatility. From a technical analysis perspective, the 4-hour K-line chart currently shows prices trading below the middle band of the Bollinger Bands, exhibiting a classic range-bound consolidation pattern. Bulls and bears are locked in a tug-of-war between key support and resistance levels, with K-line formations alternating between bullish and bearish patterns.
In terms of chart structure, the lower support zone has demonstrated strong buying conviction, while the upper resistance level has exerted clear restrictive force. Multiple failed upward breakouts have formed a short-term top. This box consolidation—characterized by resistance above and support below—is expected to sustain sideways trading through Friday.
Against the backdrop of no major positive catalysts, bearish momentum may gradually dominate if no substantial bullish triggers emerge. Maintain a trading strategy of selling into strength.
BTCUSD
105000-105500
tp:104000-103000
Investment itself is not the source of risk; it is only when investment behavior escapes rational control that risks lie in wait. In the trading process, always bear in mind that restraining impulsiveness is the primary criterion for success. I share trading signals daily, and all signals have been accurate without error for a full month. Regardless of your past profits or losses, with my assistance, you have the hope to achieve a breakthrough in your investment.

Evening BTC Market Analysis and Trading RecommendationsToday, U.S. markets are closed, leading to light trading activity and relatively limited overall market volatility. From a technical analysis perspective, the 4-hour K-line chart currently shows prices trading below the middle band of the Bollinger Bands, exhibiting a classic range-bound consolidation pattern. Bulls and bears are locked in a tug-of-war between key support and resistance levels, with K-line formations alternating between bullish and bearish patterns.
In terms of chart structure, the lower support zone has demonstrated strong buying conviction, while the upper resistance level has exerted clear restrictive force. Multiple failed upward breakouts have formed a short-term top. This box consolidation—characterized by resistance above and support below—is expected to sustain sideways trading through Friday.
Against the backdrop of no major positive catalysts, bearish momentum may gradually dominate if no substantial bullish triggers emerge. Maintain a trading strategy of selling into strength.
BTCUSDT
105000-105500
tp:104000-103000
Investment itself is not the source of risk; it is only when investment behavior escapes rational control that risks lie in wait. In the trading process, always bear in mind that restraining impulsiveness is the primary criterion for success. I share trading signals daily, and all signals have been accurate without error for a full month. Regardless of your past profits or losses, with my assistance, you have the hope to achieve a breakthrough in your investment.

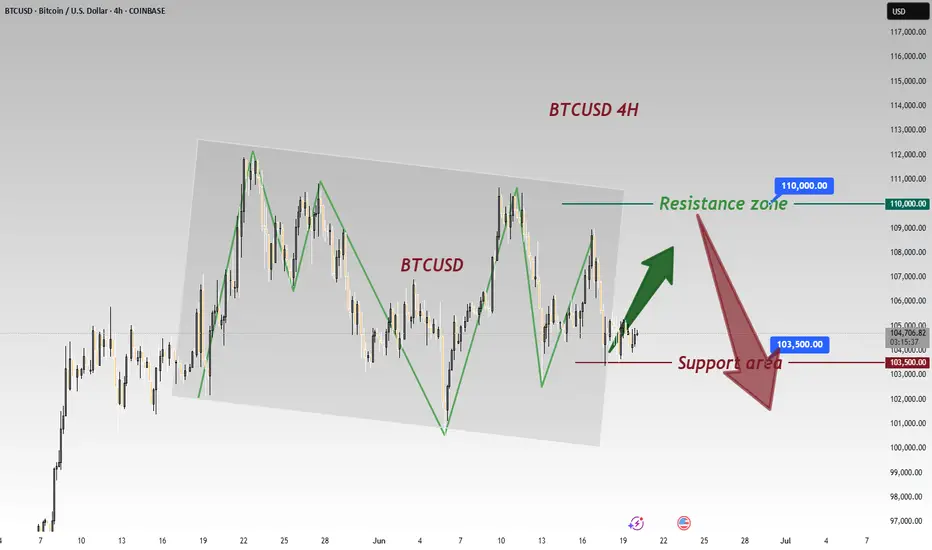
HelenP. I Bitcoin can correct to trend line and start move upHi folks today I'm prepared for you Bitcoin analytics. In this chart, we can observe how the price developed a gradual upward trend, respecting the trend line as dynamic support multiple times. After each interaction with this line, the price showed a consistent pattern of rebounding and continuing its upward movement. Recently, the price faced a notable correction, which pushed it back toward this trend line once again, a critical zone that has proven its relevance as a support area. Upon touching the line, the market reacted with a bounce, signaling that buyers are still active and defending the structure. The price began to climb again, regaining some momentum, though it hasn’t yet managed to break the previous highs. Now BTCUSD is hovering near the ascending trend line, preparing for what could be another retest. If the trend holds, we may see a short-term decline toward this line, followed by a bullish rebound. I expect the price to push higher from this level, targeting the resistance zone near 108300, which also acted as a rejection area in the past. If you like my analytics you may support me with your like/comment ❤️
Disclaimer: As part of ThinkMarkets’ Influencer Program, I am sponsored to share and publish their charts in my analysis.

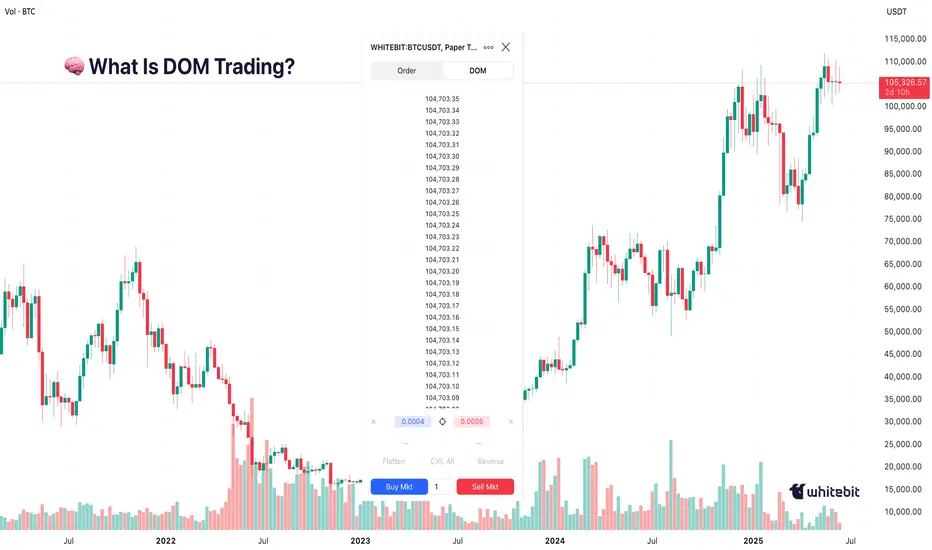
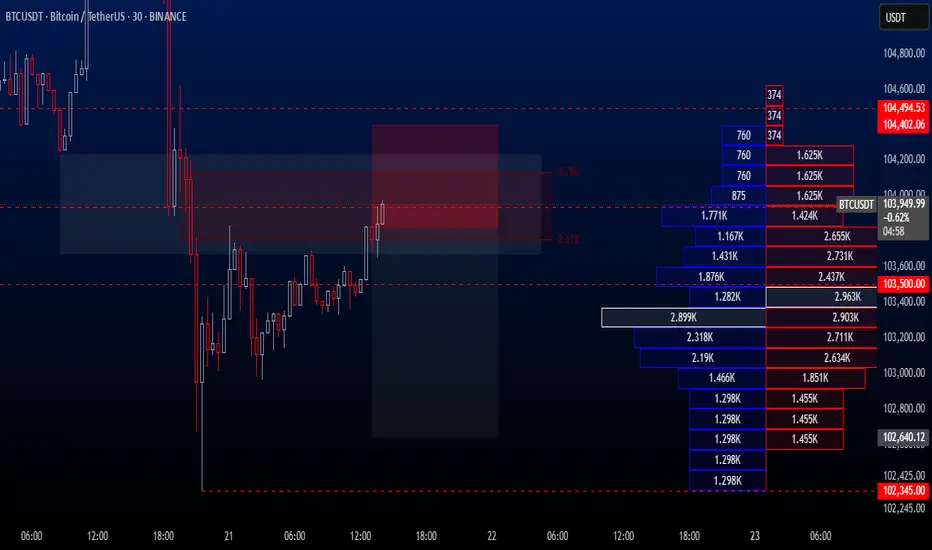
Everyone Talks Charts — But the Order Book Knows FirstHello, Traders! 🤓
Everyone watches the chart. But not everyone watches the market itself. If you’ve ever wondered why the price suddenly jumps or stalls just below resistance, you’re likely looking at the surface, not the structure underneath. And that’s precisely what DOM in trading helps to reveal.
What Is DOM Trading?
Let’s start with the basics. DOM stands for Depth of Market, which shows real-time limit buy and sell orders at different price levels. Some traders call this the trading DOM. Unlike a candlestick, which tells you what already happened, the DOM trading view shows what participants intend to do. This makes it useful for those trying to understand short-term moves, liquidity pressure, or even the psychology behind a specific level.
So if you’re asking, “What is DOM in trading?” or “How does DOM work in crypto?” – it’s essentially a live x-ray of the market’s limit order book.
Order Book Trading in Crypto
The order book, the live list of buy and sell orders, acts like a constantly updating roadmap of trader intentions. In order book trading, it’s not just the numbers that matter but how they shift. For example, traders often notice thick sell walls near round numbers (e.g., $70,000 BTC), sudden order pulls, which can fake out breakout traders, and absorption, where big buy/sell orders are filled silently, without noticeable price change… When analyzed properly, this behavior gives context to price action, something traditional indicators can’t always offer.
How to Use Crypto Trendlines… and Then Watch DOM
Drawing trendlines in crypto is common. Everyone has their version of a breakout setup.
But what happens when the price reaches that line? That’s where DOM trading shines.
It doesn’t predict whether the line will hold or break, but it shows whether liquidity is building or backing away right at the critical moment. The combination of crypto trendlines and DOM behavior often exposes subtle market dynamics, a large bid appearing just as price touches support, for instance, or offers vanishing before a breakout.
That’s not about strategy. It’s about market structure awareness, watching both the levels and the surrounding behavior.
Chart vs DOM: Two Sides of the Same Story
The crypto psychology chart tells you what’s happened — highs, lows, closes. The DOM, on the other hand, shows live trader psychology. And that’s where the psychology of crypto trading gets interesting.
When everyone’s waiting for BTC to hit $100K, for example, you might already see: Buyers are stacking bids at $95K, hoping for a retrace. Sellers layering offers at $99.9K, defending the level. And the sudden orders near $100K, a possible trap. In this way, round numbers in trading aren’t just emotional, they’re structurally significant. Especially in crypto, where the market cap is still heavily influenced by sentiment.
Final Thought
Some traders find it useful to spend a few sessions just observing the DOM. Psychological numbers in trading, like $10K, $20K, or even the famous 100K BTC milestone, are often surrounded by unusual order book behavior. So, the next time price seems to move “out of nowhere,” ask yourself: Was it really out of nowhere… or did the DOM in trading already whisper it?
You don’t need to trade based on it. But knowing how to draw trendlines in crypto and then pairing that with DOM behavior can offer a sharper view of where the market might hesitate, reverse, or run. Sometimes, seeing how others are placing their bets matters more than where. What do you think?