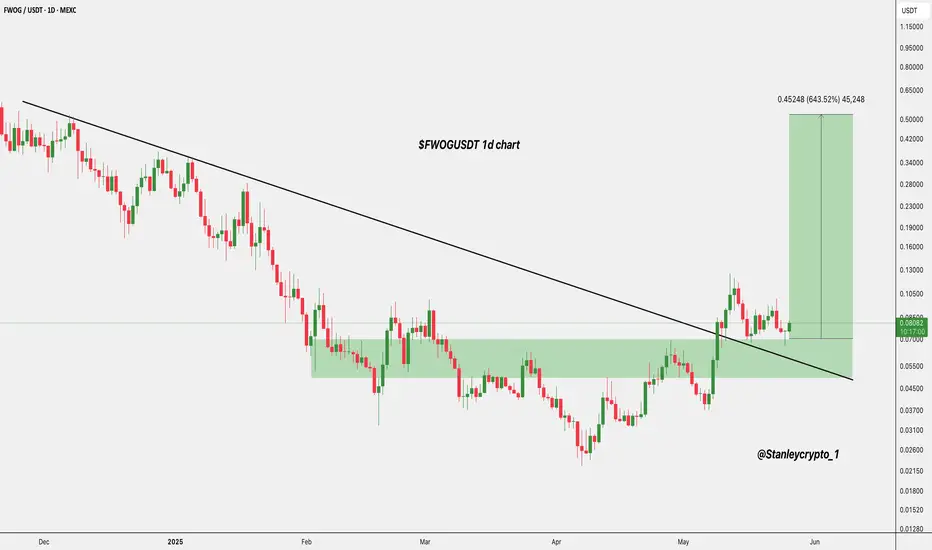
$FWOG/USDT Ready to Fly MEXC:FWOGUSDT has officially broken out of its long-term downtrend and flipped the key resistance zone into support.
After a clean retest of the breakout level around $0.07021, the price is showing strength again.
With bullish momentum building, this setup offers a solid potential upside, targeting the $0.52424 zone, a 643% move from here.
As long as the price holds above the green demand zone, this chart looks primed for a strong rally.
DYRO, NFA
BTCUSDT
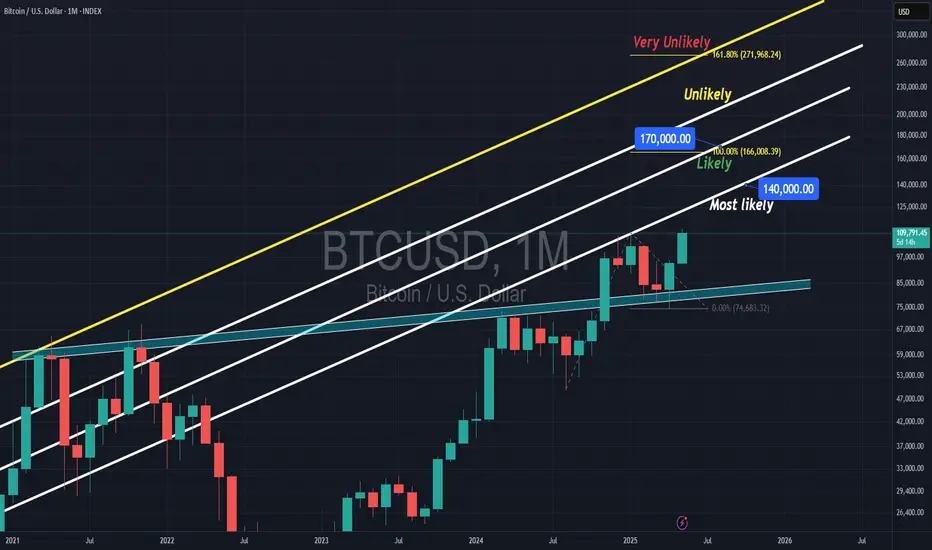
Bitcoin to 140k - 170k (26MAY2025)On monthly timeframe we have few trendlines which show us, 140 to $170,000 is likely according to the 100% of Fibonacci Extension as well, but above that is unlikely IMO.
BTC finds support around ATHsBitcoin is potentially finding support around $107k after making new ATHs last week around $112k.
Assuming these levels as S and R, a strong break could signal the direction of price in the coming days.
If local support is lost, we can expect price to at least test $104.9k.
Assuming the bullish momentum continues, breaking resistance would signal higher prices. Still in tact, a continued bull flag breakout from $104.9k (20 May) could still put BTC at around $115k.

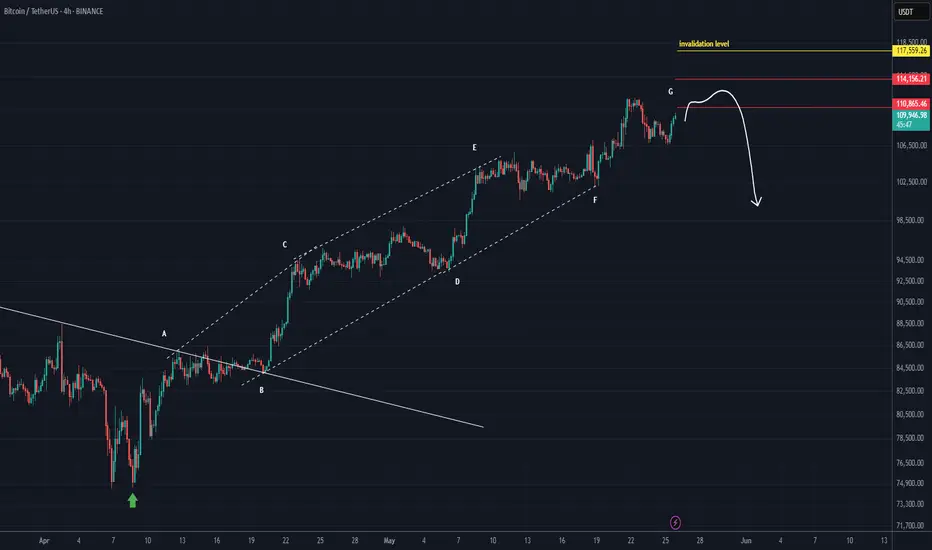
BITCOIN New Update (4H)This analysis is an update of the analysis you see in the "Related publications" section
In the previous analysis, we mentioned that you should avoid looking for sell/short positions, as Bitcoin's price pattern was designed to trap short positions. The price followed the direction of the previous yellow arrow as anticipated.
Currently, the major resistance zone for Bitcoin on the chart is the red area. In this zone, a complete bullish pattern could potentially form | or at the very least, one leg of a bullish pattern may be completed.
Let’s see how it plays out.
For risk management, please don't forget stop loss and capital management
Comment if you have any questions
Thank You
BTC/USD Long-Term Channel Targeting 120,721 – 136,849Bitcoin continues to trade within a well-defined ascending channel on the weekly timeframe. After a healthy corrective phase, price action is rebounding strongly off the channel’s lower boundary, aligning with the ongoing long-term bullish trend.
🔹 Wave Structure and Fibonacci Extensions:
The corrective structure suggests a completed ABC pattern, with the current move potentially initiating a new bullish impulse.
Key Fibonacci extension levels:
161.8% at 120,721
200% at 130,246
224% at 136,849
These levels correspond to the upper channel boundary, providing potential long-term upside targets.
🔹 Oscillator Confirmation:
The DTOsc indicator is rebounding from oversold territory, suggesting renewed bullish momentum.
📌 Trade Idea:
Long-term bias: Bullish, targeting upper Fibonacci levels within the channel
Invalidation: A weekly close below the channel’s lower boundary (~85,000) would challenge this scenario
This chart supports a patient, long-term bullish view for BTC/USD, with significant upside targets over the coming months.

Is It Time to Enter, or time to escape?One green candle is all it takes to trigger thousands of minds into thinking
Should I jump in now?
But is this truly a good entry point, or are you just afraid of missing the move?
Let’s break down how psychology tricks us into bad trades—and how to fight back with real chart data.
Hello✌
Spend 3 minutes ⏰ reading this educational material.
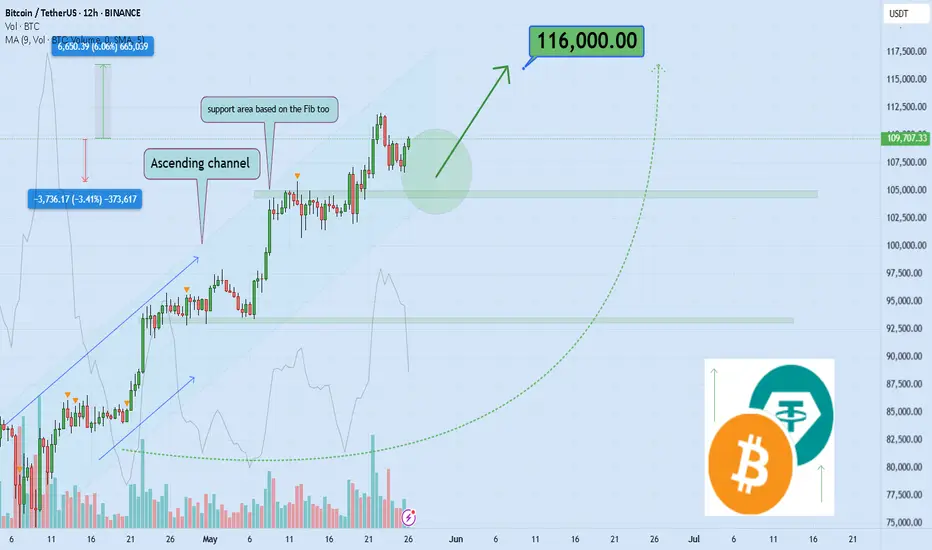
🎯 Analytical Insight on Bitcoin:
📈 Bitcoin is currently respecting a well-structured ascending channel, with price action aligning closely with a key Fibonacci retracement level and a major daily support zone—both acting as strong technical confluence. Given the strength of this setup, a potential short-term move of at least +6% seems likely, while the broader structure remains supportive of an extended bullish scenario toward the $116K target. 🚀
Now, let's dive into the educational section ,
📉 Why Do We Buy More When Markets Are High?
It’s a simple question—but the answer runs deep into our psychology. When a crypto pumps, and we’re not in it, our brain doesn’t analyze—it rationalizes:
"If I don’t buy now, I’ll miss out."
But most people who think like this enter at the top—and exit with regret .
🧠 The Psychology of FOMO and Poor Timing
In every rally, a large chunk of entries are triggered by FOMO (Fear of Missing Out).
But buying high means you're buying from those who bought lower.
And here's the trick: your brain loves the green candles—but ignores volume drops, RSI spikes, or exhaustion signals.
🛠 TradingView Tools to Spot Smart Entry Points
When it comes to entering a position, emotions are your worst advisor. Fortunately, TradingView offers powerful tools to help you act based on evidence, not instinct. Here’s how to use them:
🔹 Trend-Based Fib Extension: One of the best tools to estimate how much room a move still has. Plot it on the previous wave to identify realistic targets.
🔹 RSI (Relative Strength Index): When RSI is over 70 or under 30, you’re in emotional territory. Be careful—buying during peak RSI often means you're entering late.
🔹 MACD: Look for crossovers between lines and histogram patterns. Use it as confirmation—not a solo trigger—for entries.
🔹 Volume Profile: This hidden gem on TradingView shows you where most trading volume has occurred. Buying at volume-supported levels is way safer.
🔹 Alerts & Watchlists: Don’t glue yourself to the chart. Set alerts for your conditions and build smart watchlists to stay updated.
🔹 Replay Mode: Want to master entries without risking real capital? Use Replay Mode to test strategies and train your eyes.
If you want to replace "guessing" with "planning," these tools should be your daily companions.
🔍 5-Point Checklist Before You Hit "Buy"
Ask yourself these five questions before entering a trade:
Is the broader trend actually bullish—or is this just a short-lived bounce?
What does RSI or other indicators say about overbuying?
Are there major support/resistance zones nearby?
Is the volume confirming the move—or fading out?
Do you have a target and stop in place—or just a “need to be in”?
📊 No Plan Entry = Planned Loss
If you jump in without a clear plan, your only focus becomes: “Am I in profit yet?”
Not “Is my strategy playing out?”
And that’s the trap.
A solid entry means you have a signal, a plan, and controlled risk.
🧲 How to Avoid Getting Pulled Into Fake Rallies
Always check higher timeframes for confirmation
Don’t enter without volume agreement
Plan entries after pullbacks, not mid-hype
Think in probabilities, not dreams
🧭 Final Takeaway & Recommendation
Opportunities never end in the market.
Opportunities never end in the market.
Opportunities never end in the market.
Opportunities never end in the market.
Opportunities never end in the market.
Opportunities never end in the market.
Opportunities never end in the market.
i should write this thousand of time ☝️
But rushing in only guarantees missed ones.
Use your tools and stay calm.
The trader who plans always beats the one who panics.
always conduct your own research before making investment decisions. That being said, please take note of the disclaimer section at the bottom of each post for further details 📜✅.
Give me some energy !!
✨We invest countless hours researching opportunities and crafting valuable ideas. Your support means the world to us! If you have any questions, feel free to drop them in the comment box.
Cheers, Mad Whale. 🐋
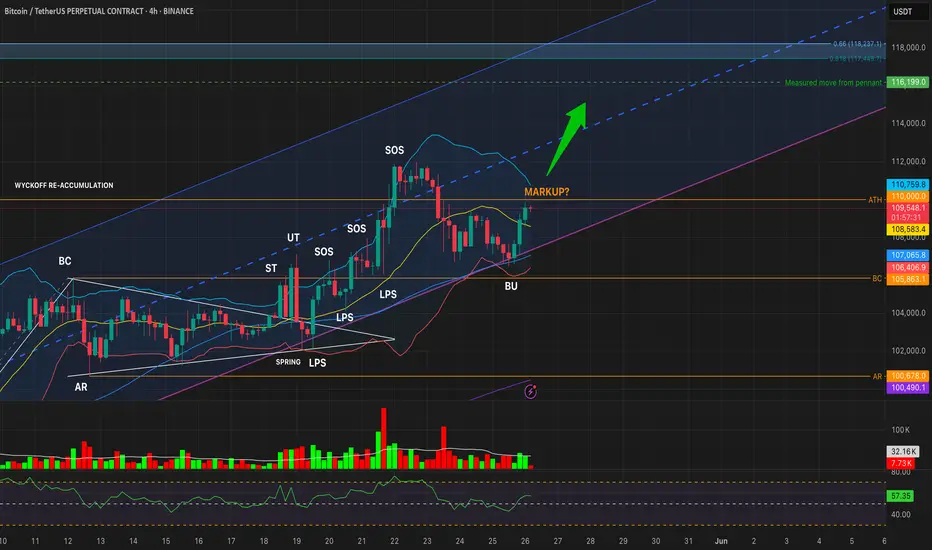
BTCUSDT – Reaccumulation Breakout or Bearish S/R Flip?Timeframes: 1W • 1D • 4H
Structure: Wyckoff Reaccumulation nearing Phase E — but ATH is acting as resistance
🔹 WEEKLY OUTLOOK: Macro Structure Points to Markup
Last weekly candle closed above the reaccumulation Buying Climax (BC), showing bullish intent
Weekly upper Bollinger Band is rising toward 113k
RSI at 67, strong but not overbought
Structure suggests we’re entering Wyckoff Phase E
Weekly Targets:
🟢 TP1: 113,049 (Upper BB)
🟢 TP2: 116,199 (measured move)
🟢 TP3: 118,237 (Fib 0.66 extension)
🔹 DAILY OUTLOOK: Still Holding Above Reaccumulation Range
Multiple daily closes above the BU (backup) zone, but all below 110k ATH
RSI is strong (~66), and price is tracking near the upper BB, but volume is not convincing
Until a daily close above 110,000, breakout remains unconfirmed
🔹 4H OUTLOOK: Structure Valid, Momentum Rising
BU zone held; price made two lower lows followed by a higher high
RSI has reclaimed 57+, and volume is picking up modestly
4H structure looks like an early Phase E breakout attempt, but...
⚠️ Caution: Is This a Bearish S/R Flip?
While the broader Wyckoff structure suggests a transition into markup, we must also consider the bearish scenario:
BTC may be failing a support/resistance flip at 110k
All timeframes have rejected at or below 110k, despite multiple attempts
If we see a lower high under 109k + 1D close below 105,863 with red volume and RSI < 45 → this becomes a confirmed bull trap
📊 TL;DR:
BTC is structurally bullish — but we are at the final test zone.
🔓 Breakout confirmed: Daily close above 110k
🔒 Failure confirmed: Close below 105,863 + red volume + RSI breakdown
Stay nimble. This is either the last shakeout before markup… or the top of the range before reversal.
#Bitcoin #BTCUSDT #Wyckoff #CryptoTrading #TechnicalAnalysis #Reaccumulation #Breakout #SupportResistance
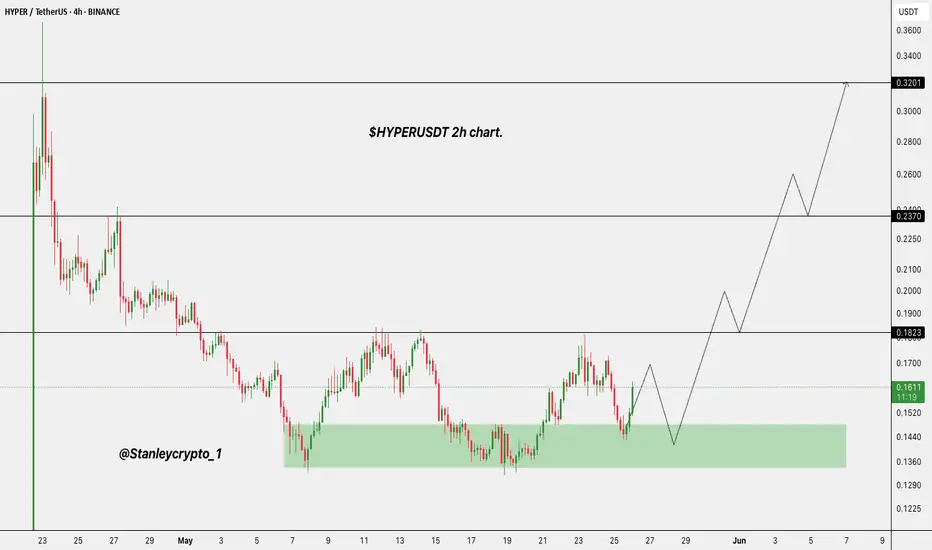
$HYPERUSDT Breakout in Progress Eyes on Key Levels!BINANCE:HYPERUSDT is bouncing from a strong demand zone.
If support holds, the price could target $0.1823, $0.2370, or $0.3201.
Watch for a clean retest around $0.170 to confirm the move.
It looks bullish for now.
DYRO, NFA
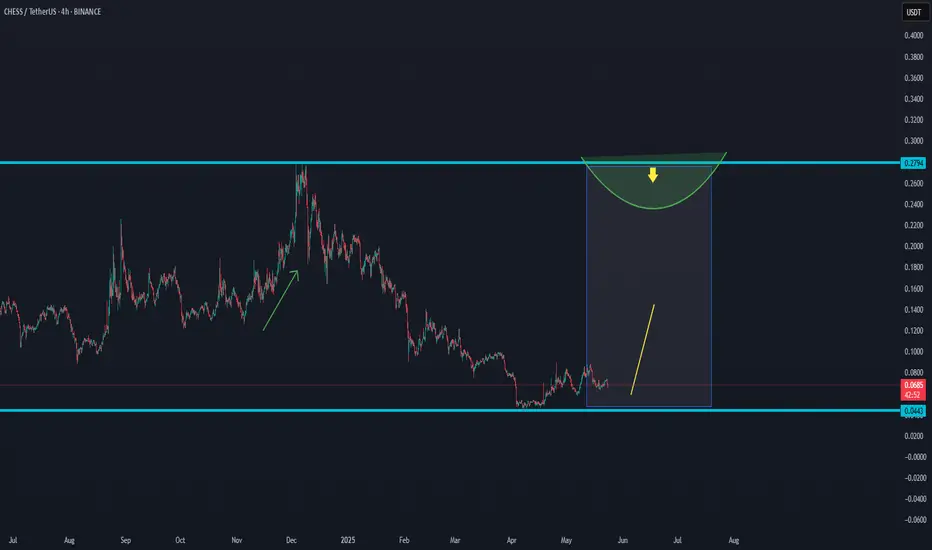
CHESS.USDT NEW INCREASE ROUNDEAs a trader, it's important to follow the market and the unexpected trends.
CHESS/USDT shows a possibility for a new increase in the coming time frames, after the long-term breakdown.
Let's follow the data and see if this coin is able to increase as the chart shows.
interesting to follow for the coming time frames for new confirmations.
$0,10 is an important target that this coin could hit in the coming time.
If the cycle gets confirmed, this coin could go to $0,25 as a high target and $0,35 as a best target.
In trading, never expect instant results; the market goes as it needs to go.
Risk management is the key.
SUSDTAfter forming a Diametric pattern and then correcting after that, the price is now ready to move to the specified range...
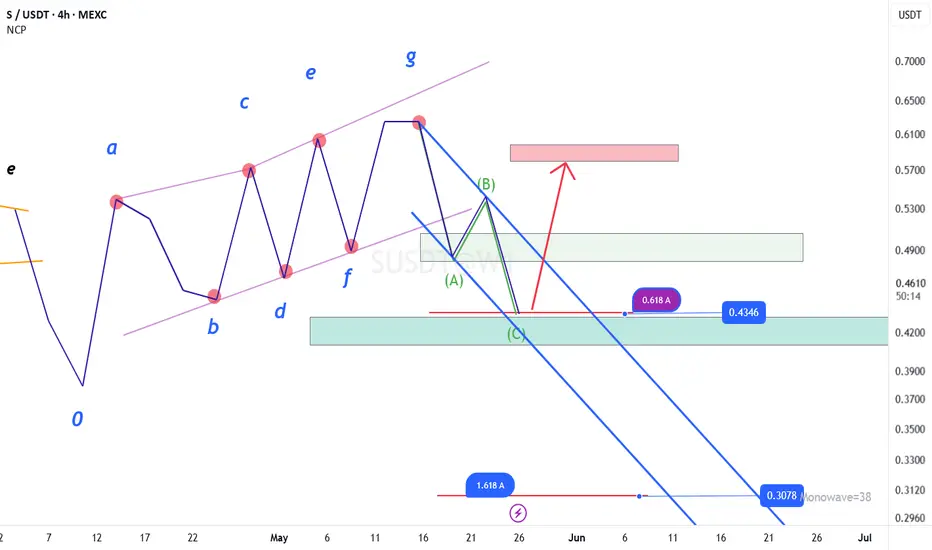
Volatility Period: Up to May 29
Hello, traders.
If you "Follow", you can always get the latest information quickly.
Have a nice day today.
-------------------------------------
(BTCUSDT 1D chart)
It is showing a downward trend below the previous ATH range.
Accordingly, we need to see if it can rise to around 109588.0 and receive support.
However, since it is currently going through a period of volatility, we need to be careful about trading until May 28th.
-
If it falls further, we need to check if it can receive support near the Fibonacci ratio range of 1.902 (101784.54) ~ 2 (106178.85).
In particular, whether it can receive support near the M-Signal indicator on the 1D chart is key.
If it falls below the M-Signal indicator on the 1D chart, there is a possibility that it will touch the M-Signal indicator on the 1W chart, so we need to think about a response plan for this.
Therefore, if it shows support near the M-Signal indicator on the 1D chart, there is a possibility that it will show a pull back pattern.
The HA-High indicator of the 1D chart is formed at 102302.08, so it is important to see if there is support around this point.
-
The OBV indicator shows that OBV is falling below the High Line, and the StochRSI indicator is also showing that it has switched to a state of K < D.
Therefore, it is necessary to check whether OBV can touch the previous High Line or OBV EMA and rise.
If it falls below that, it is highly likely to lead to further decline.
I compared the previous OBV movements, that is, A, B, C, and the current movement, and the difference can be distinguished by whether it fell below the previous candle or not.
You can see that there is a difference from the previous movement because it is highly likely to close below the previous candle.
Therefore, the point to watch is whether it falls below 102302.08 after the volatility period or rises above 109588.0-110787.38.
If it falls below 102302.08 and receives resistance, it will turn into a short-term downtrend, and if it rises above 109588.0-110797.38, it is likely that the uptrend will resume, so it is a meaningful section.
-
Thank you for reading to the end.
I hope you have a successful trade.
--------------------------------------------------
- This is an explanation of the big picture.
(3-year bull market, 1-year bear market pattern)
I will explain more details when the bear market starts.
------------------------------------------------------

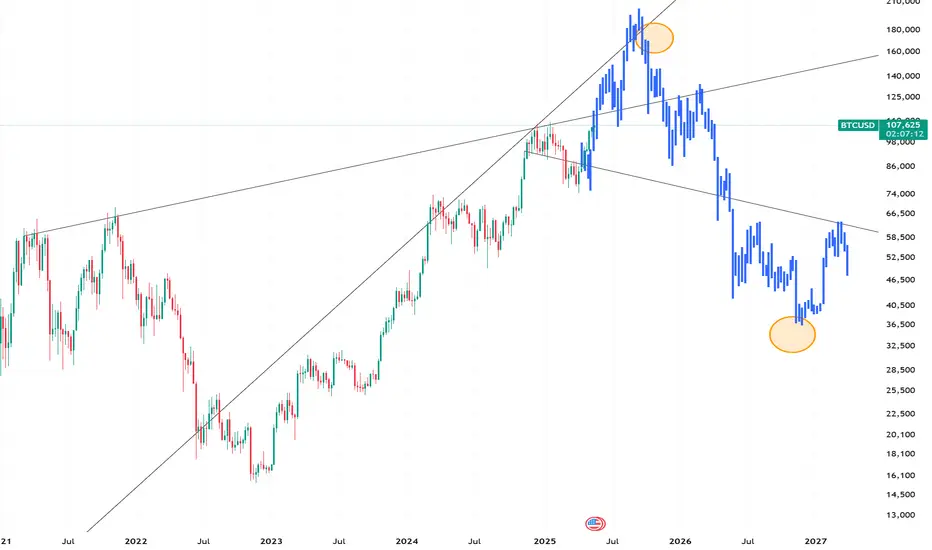
2 year Bitcoin roadmapThis is the way.
In time, you will understand the power of simple lines and the cyclical nature of markets across time. It all repeats, whether it is algorithms or human action; 80% of things follow patterns.
Randomness and outliers are always a minority.
BTCUSDT to bounce from 4h supportHere is an idea for trade on BTCUSDT. The price is coming close to the 4h support zone 4HS1.
It is likely that it will find support there and bounce from there towards 4h resistance 4HR1 and possibly towards 4HR2.
We will take some profit at 4HR1 level if the price reaches there and look to refill the position on any pullback.
We will also reevaluate if the price is really heading towards 4HR2 or likely to go around 96k-97k before fueling up for upward move.

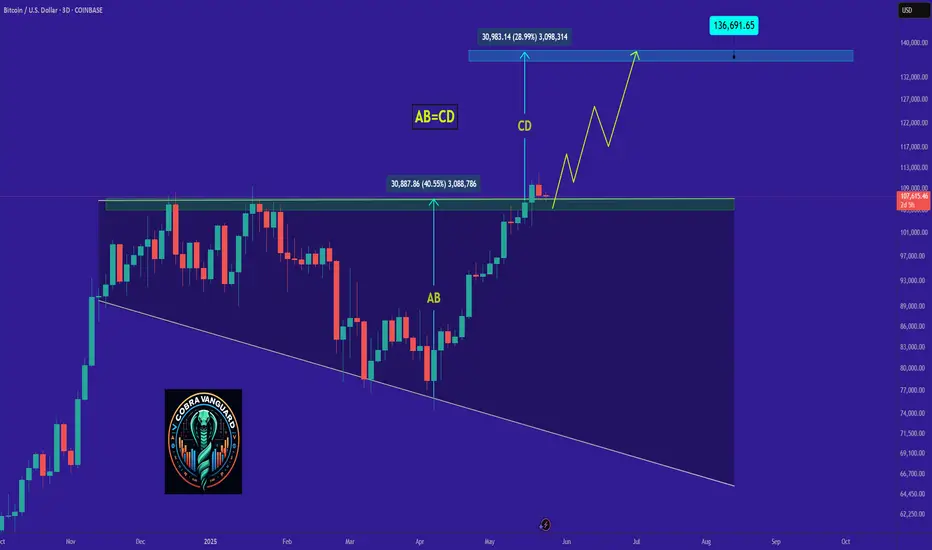
"BTC - Time to buy again!" (Update)As mentioned in the previous analysis, the price reached the top of the wedge and broke out with a price increase. Now that Bitcoin's price is above the wedge, it can be said that with a slight price correction, it could follow the pattern and make a measured move where AB = CD.
PREVIOUS ANALYSIS
Give me some energy !!
✨We spend hours finding potential opportunities and writing useful ideas, we would be happy if you support us.
Best regards CobraVanguard.💚
_ _ _ _ __ _ _ _ _ _ _ _ _ _ _ _ _ _ _ _ _ _ _ _ _ _ _ _ _ _ _ _
✅Thank you, and for more ideas, hit ❤️Like❤️ and 🌟Follow🌟!
⚠️Things can change...
The markets are always changing and even with all these signals, the market changes tend to be strong and fast!!
Bitcoin Potential UpsidesHey Traders, in today's trading session we are monitoring BTCUSDT for a buying opportunity around 105,000 zone, Bitcoin is trading in an uptrend and currently is in a correction phase in which it is approaching the trend at 105,000 support and resistance area.
Trade safe, Joe.

Gold Surges, Euro Plunges, BTC at RiskOn May 23rd's U.S. session, Trump's EU/Apple tariff plans sparked market chaos:
Gold surged 💥 as a safe haven.
The euro plunged on EU tariff fears.
If tariffs persist, capital may flood into gold/forex, likely triggering a BTC crash.
⚡⚡⚡ BTCUSD ⚡⚡⚡
🚀 Sell@109500 - 108500
🚀 T P 106500 - 104500
👇Accurate signals are updated every day 📈 If you encounter any problems during trading, these signals can serve as your reliable guide 🧭 Feel free to refer to them! I sincerely hope they'll be of great help to you 👇
Bitcoin is still in an uptrend that is your friend.... but...BTC has taken a pullback after the orange swan event. Now that volatility has pushed down, I want to see the bullish response. If the bulls can't maintain the uptrend, the market structure defines a lower high. A CHOCH usually begins with a lower high followed by a lower low.
Full analysis: Link in the BIO

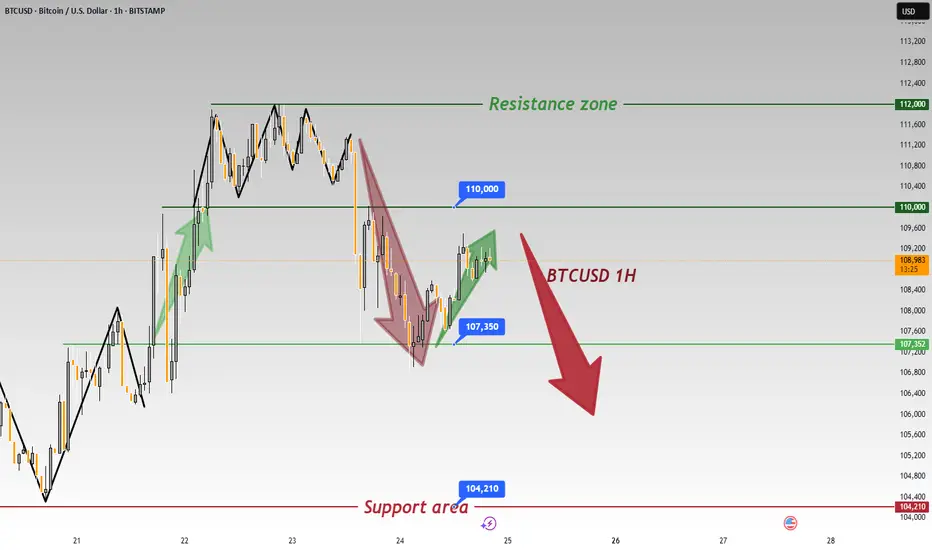
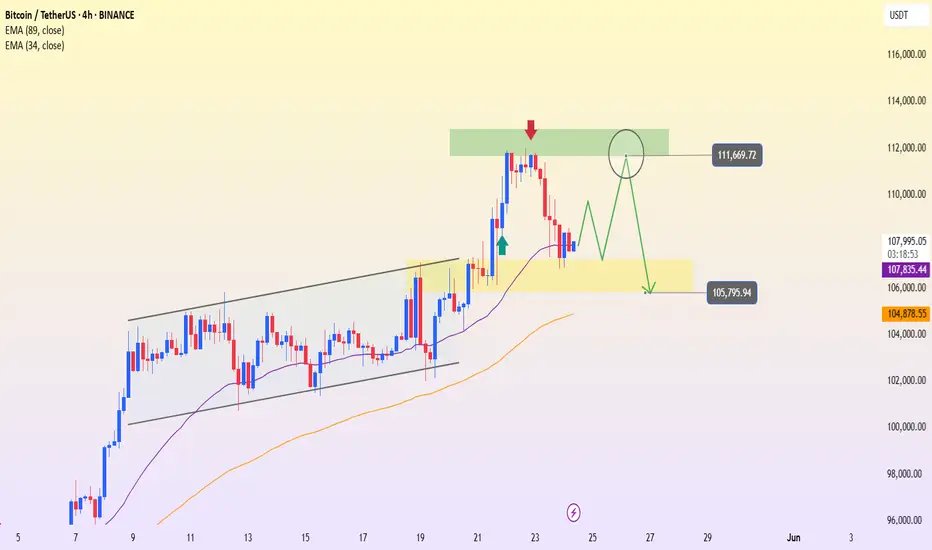
BTCUSDT – Hitting resistance, is selling pressure returning?Bitcoin is showing signs of losing momentum after touching the resistance zone around 111,669. On the H4 timeframe, the previous bullish structure has stalled with a series of red candles and a clear pullback, bringing price back to test the EMA 34 zone.
In terms of news, although the market remains excited due to expectations surrounding a Bitcoin spot ETF, many large investors are starting to take profits after the recent sharp rally. This is causing selling pressure to slightly outweigh buying in the short term.
The most likely scenario now is that BTC could make a mild upward move to retest the 111,600 area – but if it fails to break above, a reversal back toward the support zone at 105,800 is highly probable. This area aligns with the EMA 89 and a previous accumulation zone.
Current strategy: don’t get caught in a false breakout. Instead, watch the 111,600 area and wait for a clear signal. If a reversal candlestick pattern appears, short-term sell entries may be considered with a target near the lower support.
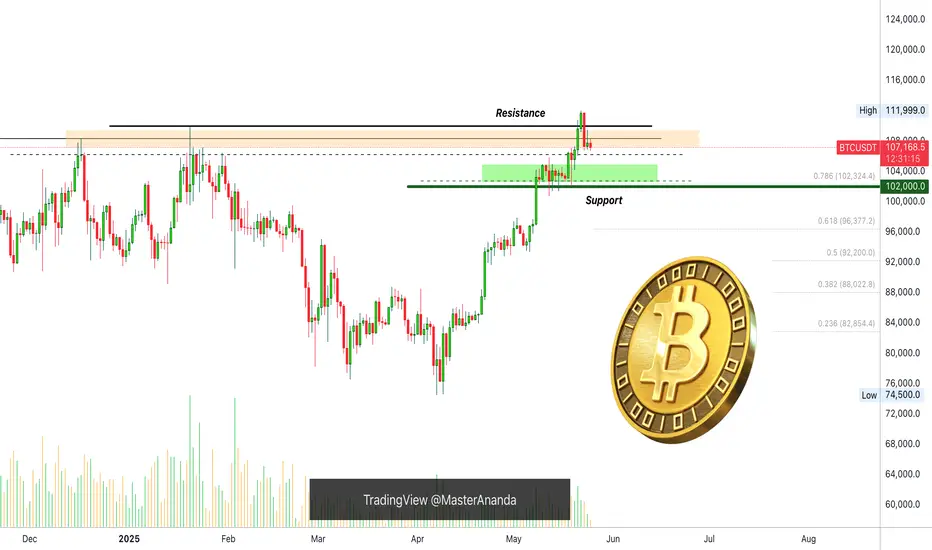
Bitcoin Double-Top & $60K Correction ExplainedPeople are showing Bitcoin producing a double-top or shy higher high and then crashing down to new lows. This is a strong fallacy. Here we can see Bitcoin trading above $102,000 for 12 days before moving higher, this creates a support zone. (Green on the chart.) Bitcoin can easily consolidate above this level before moving higher. All the action in mid-December 2024 and late January 2025 also makes this zone a very strong support zone.
Before Bitcoin trades at $60K or $70K for example, it needs to break below $100,000. For Bitcoin to break below $100,000, it first needs to challenge $102,000 which is a super strong long-term support.
For Bitcoin to move below $102,000, it needs to break below $105,000. What Bitcoin is doing now, is simply consolidating the last advance, preparing for additional growth.
Notice that there is no huge bear volume candle after the new ATH. Also notice that the red candle happened the day after the ATH and not the same day. Bitcoin is not set to crash. Bitcoin will continue growing.
Remember, the FED will lower interest rates next month and this will be the boom (catalyst) that will push the Cryptocurrency market to the stars.
Namaste.
BTC/USD) Make some trand analysis Read The ChaptianSMC trading point update
Technical analysis of Bitcoin (BTC) against USDT on a 4-hour timeframe using key price action concepts. Here's a breakdown of the idea conveyed:
Key Elements in the Chart:
1. Support and Resistance Zones:
Support Level (Yellow Boxes): Indicate areas where buying interest is strong enough to prevent the price from falling further.
Resistance Level: Zones where selling interest is strong enough to halt upward price movement.
These zones have been respected multiple times and serve as potential trade entry or exit points.
2. Breakout Strategy:
The chart highlights breakout points (black circles) above resistance zones, signaling strong bullish momentum.
After breaking resistance, price typically retests the zone as new support before moving higher—this is a classic breakout and retest structure.
3. Target Projection:
The vertical lines represent measured move projections, likely using the height of the prior consolidation range to estimate the next move.
The target point is marked around $112,559.59, indicating a bullish target following the breakout.
4. 200 EMA (Exponential Moving Average):
The 200 EMA at $96,827.38 acts as dynamic support, showing the overall bullish trend is intact.
5. RSI (Relative Strength Index):
RSI values (54.97 and 52.87) suggest neither overbought nor oversold conditions, implying room for further upside.
Mr SMC Trading point
---
Conclusion:
The analysis suggests a bullish continuation setup:
BTC has broken out from a consolidation range.
Retesting previous resistance as support.
The bullish target is $112,559.59 based on the breakout projection.
The trend remains bullish as long as price stays above the support zone and 200 EMA.
Pales support boost 🚀 analysis follow)

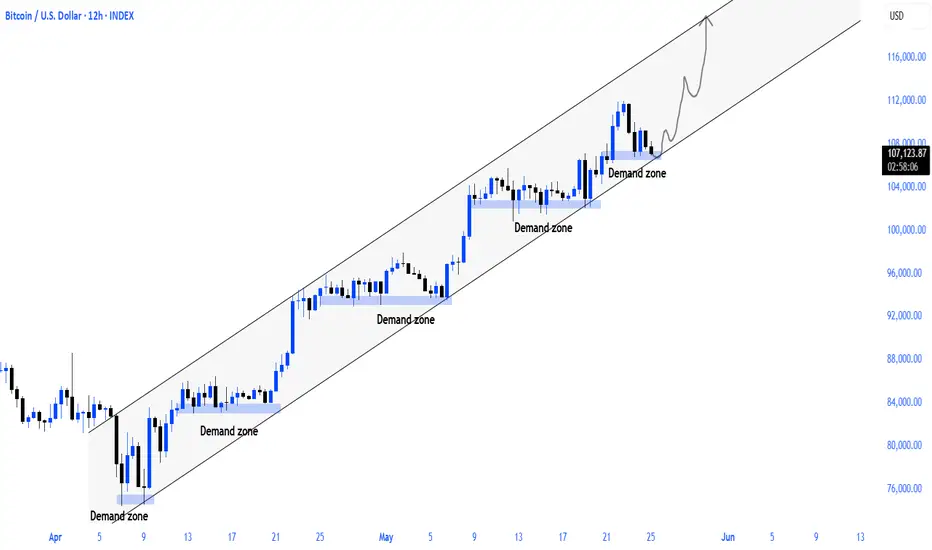
btc 12hbitcoin continues to maintain its rising trend support starting with 74k. i think it will start to move upward from the trend support equivalent to the current demand zone
BTCUSD | IntradayAlthough we have a buy direction on the daily time frame, there is a small correction in it, and we can try to take advantage of its movement!
Feel free to discuss
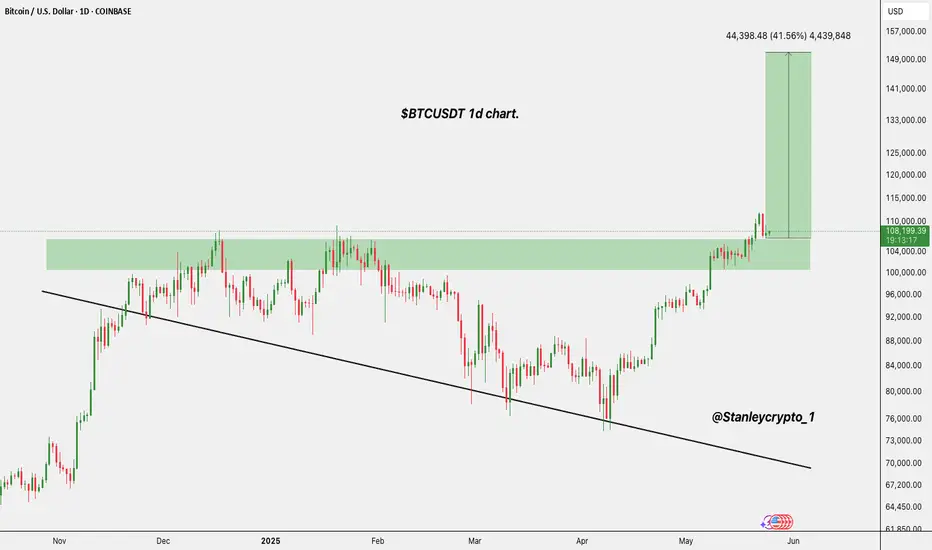
$BTC/USDT 1D UpdateBitcoin Aescending broke out above the key $104k, $110k zone, flipping it into support.
With strong bullish momentum, the next target is around $152k.
As long as it holds this level, upside remains in play.
DYRO, NFA