Bitcoin Hits New High Thanks Mars & Saturn: Bearish Or Bullish?Based on new data that is available just now, the daily action and the Altcoins market is Bitcoin considered to be bullish or bearish coming from TA?
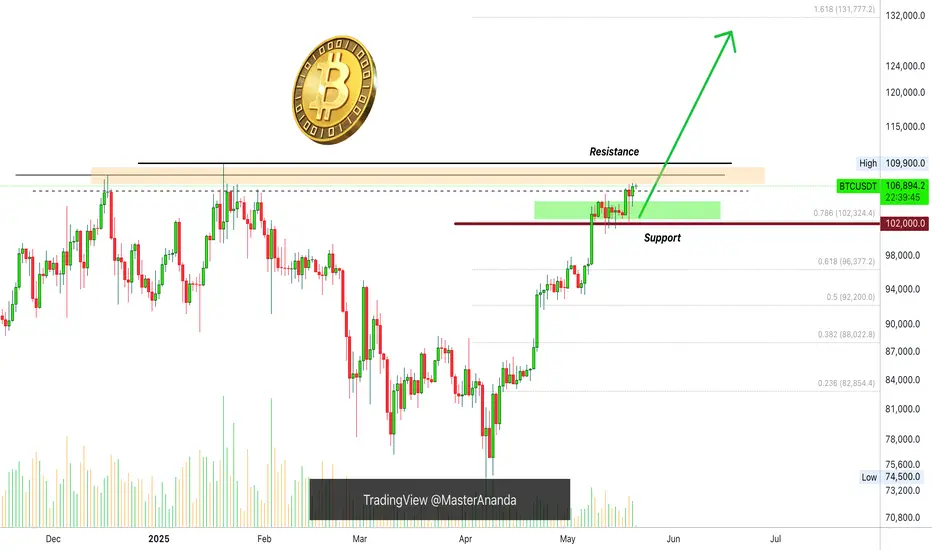
Bitcoin just produced a new ATH based on candle close, 20-May, higher than 18-May at $106,855. Resistance continues to be challenged, the more challenge the weaker it becomes.
Market conditions are bullish of course, we have now the same situation as in late April and in late April we were witnessing a bullish continuation and prices moved up. Remember late May? That's the time when everything Crypto goes bullish and bullish it is already just hyper-bullish not yet.
A new All-Time High is bullish enough I guess but Bitcoin will continue growing we have very good dates 22 and 24 May. And then the rest of the month for additional growth. This is only the start.
But, will Bitcoin continue straight up or is there room for a retrace?
That's being a bit too greedy but ok, let's study the chart an answer. There is room for a small retrace but this type of retrace is low probability, why? Many people would be waiting for such a move and since this is easy to see and expect the market movers tend to move in a way that people cannot predict, which means straight up. Most people would think that straight up is too much, there must be some relief and so, instead of betting up they bet down short-term but this never works because all the bears are thinking the same. The whales are smart and know how to play. Once the "go" button is on, it is on and Bitcoin grows non-stop until the next major resistance zone.
I identified for you the most strong support level ultra long-term, based on numbers from 2022-2021 and that's $102,000. This level cannot fail weekly/monthly timeframes.
Now, my idea is that Bitcoin will continue growing straight up. There is just no time for retrace, Bitcoin is being magnetized by an incredible force. Bitcoin is being guided by Mars and Saturn and both of these planets are saying up!
Namaste.
BTCUSDT
Bitcoin’s Breakout Pattern Continues – Is $120K Next?MARKETSCOM:BITCOIN Quick Update
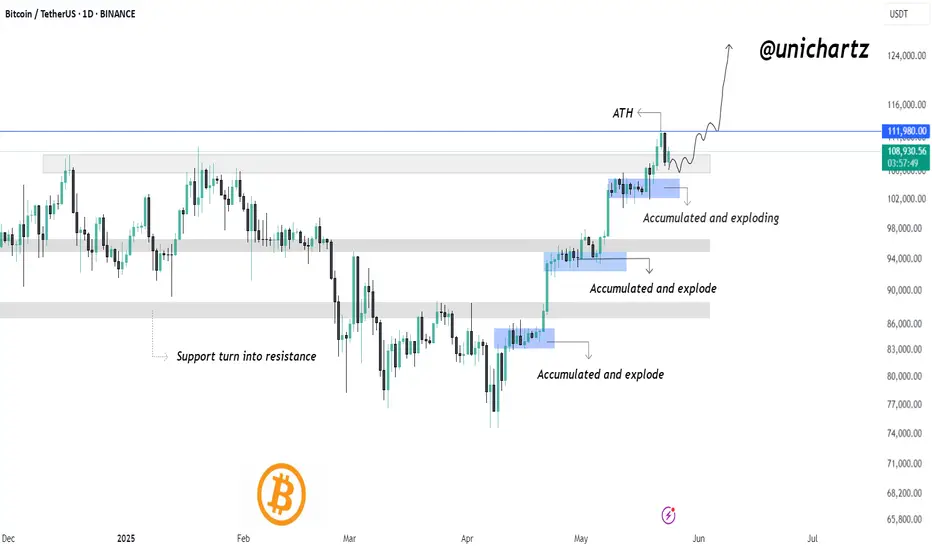
Bitcoin is showing strong momentum — each time it accumulates, it breaks out to a new level. This "accumulate and explode" pattern has played out cleanly three times already.
Now, BTC is consolidating just under its all-time high. If this range holds, another breakout could be coming soon.
The structure remains bullish as long as price holds above the $103K zone. A clear break above ATH could send it toward $120K and beyond.
Bitcoin: LEVELS LOOKOUT!If you find this information inspiring/helpful, please consider a boost and follow! Any questions or comments, please leave a comment!
BTC on Watch: Short-Term Levels That May Show the Market’s Hand
#Bitcoin is hovering around all-time highs, but traders should be on high alert. There’s a visible level just beneath price that’s acting as the current line in the sand.
What to Look At
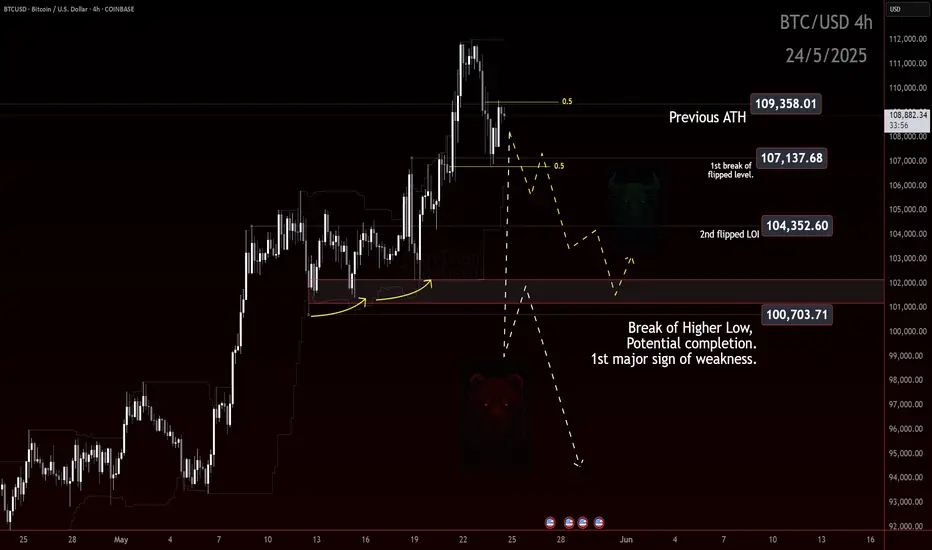
Rather than overanalyze, just focus on the chart. A clean level around $100k is marked — if that gives way, it may not just be a smaller degree pullback on news. It could be the start of something more revealing and deeper.
What Comes Next?
If price breaks that 107k zone, watch what the market prints in response. Does it flush impulsively? Does it grind? Those reactions will show intent — and possibly confirm or deny a larger corrective wave unfolding.
Outlook
We’re not guessing the future — we’re waiting to observe the market’s decision point. Eyes on that level. If it breaks, the chart will speak louder than words.
Trade Safe!
Trade Clarity!
Bitcoin - Confirmed Breakout#BTC/USDT #Analysis
Description
---------------------------------------------------------------
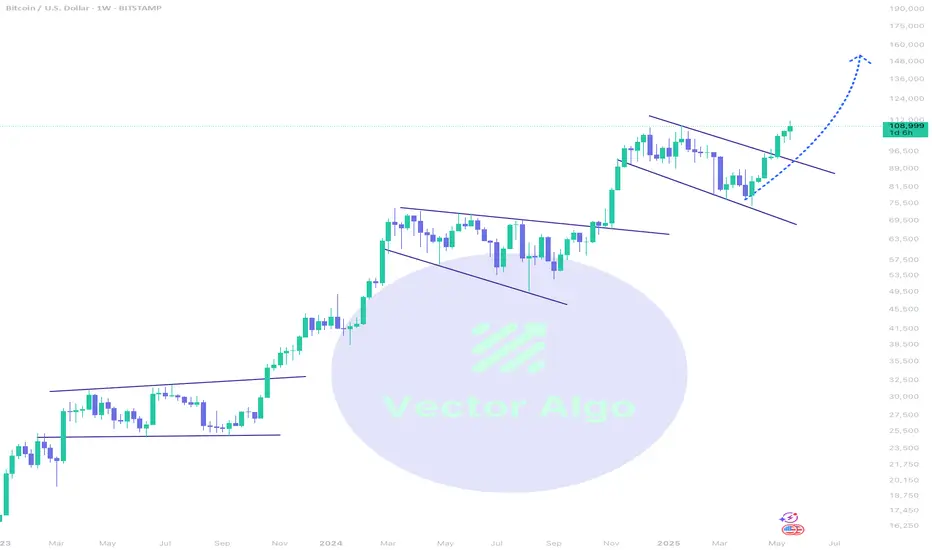
+ Bitcoin has successfully broken out from the resistance, this is the third time bitcoin has broken out from the resistance line, in the previous two breakouts bitcoin had significant growth and we can expect similar growth this time.
+ the next target for bitcoin is around 150k and this is an easy target for bitcoin.
+ Bitcoin can see some consolidation around previous resistance (around 109k) but this can be broken easily.
+ Lets see how this plays out.
---------------------------------------------------------------
Enhance, Trade, Grow
---------------------------------------------------------------
Feel free to share your thoughts and insights. Don't forget to like and follow us for more trading ideas and discussions.
Best Regards,
VectorAlgo
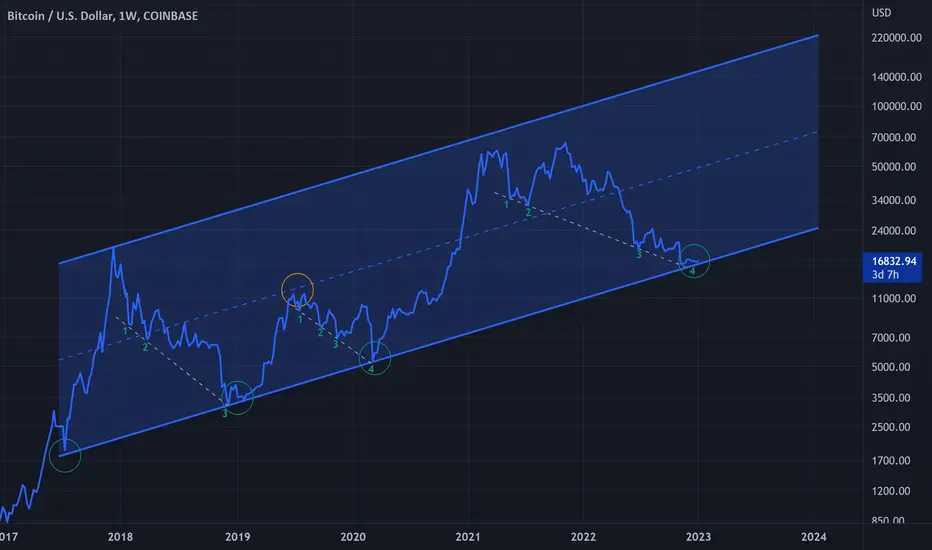
Bitcoin Lines- What you can see if you remove Bars and replace them by Lines ?
- Congratulation, you just removed the noise in the chart.
- Everything is in graph.
- Covid19 Black Swan included.
- Not a price prediction.🤷♂️.
Happy Tr4Ding !
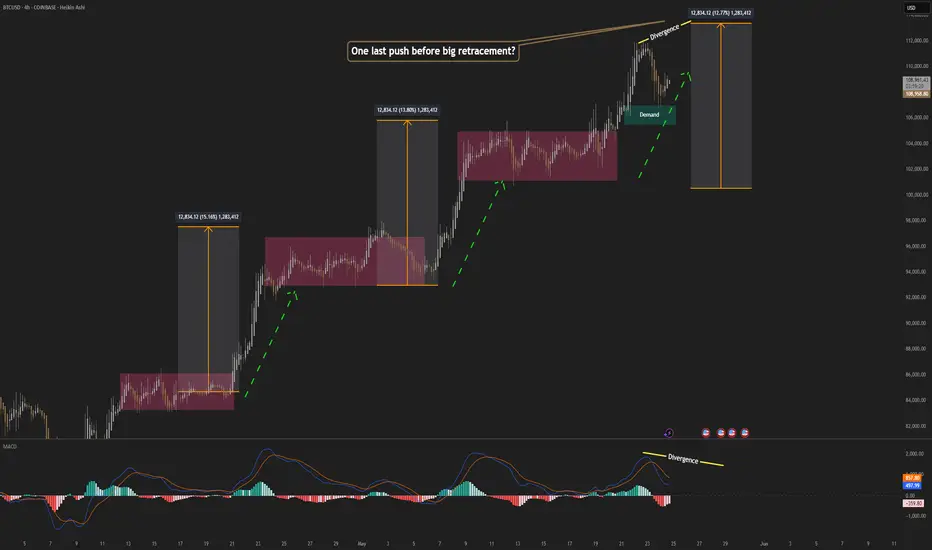
BItcoin; Heikin Ashi Trade IdeaCOINBASE:BTCUSD
Picture tells more than 1000 words!
Thank you for checking out!
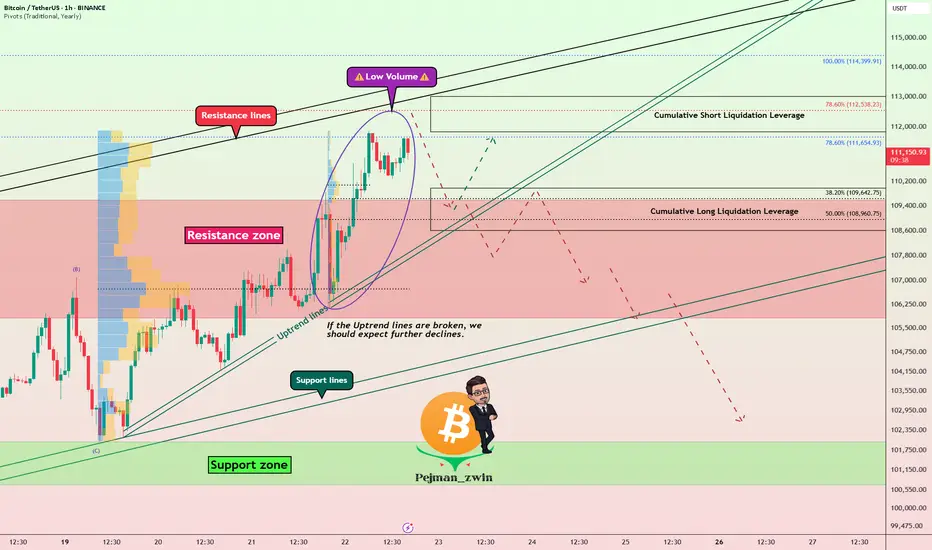
Bitcoin Be Setting Bull Trap?_Breakout Without High VolumeBitcoin ( BINANCE:BTCUSDT ) started to fall yesterday after forming a new All-Time High(ATH) with high volume , but started to rise again. One of the reasons for Bitcoin’s sudden drop yesterday was the sharp drop in the S&P 500 ( SP:SPX ) index .
First of all, I must say that Bitcoin’s situation is a bit complicated and difficult to analyze , so pay more attention to money management. Be prepared for any scenario.
Bitcoin is trading above the Resistance zone($109,588-$105,820) and near the Resistance lines and Cumulative Short Liquidation Leverage($113,020-$111,833) . What is worrying is that the break of the Resistance zone($109,588-$105,820) was NOT accompanied by high volume , suggesting a bull trap is possible .
I see a correction to at least Cumulative Long Liquidation Leverage($109,972-$108,609) given the low breakout volume for Bitcoin and the large sell orders in the upper prices for Bitcoin .
--------------------------------------------
Today, the Flash PMI data from the U.S . came in stronger than expected:
Flash Manufacturing PMI: 52.3 (vs. forecast 49.9, previous 50.2)
Flash Services PMI: 52.3 (vs. forecast 51.0, previous 50.8)
Analysis :
Both numbers exceeded expectations, signaling stronger economic activity in the U.S. This is bullish for the USD( TVC:DXY ) and could put short-term downward pressure on Bitcoin, as it lowers the chances of near-term Fed rate cuts.
--------------------------------------------
Do you think Bitcoin is completing a Bull Trap or should we expect Bitcoin to increase further?
Note: If Bitcoin breaks above $114,500 with high momentum, we can expect Bitcoin to rise to near $119,000.
Please respect each other's ideas and express them politely if you agree or disagree.
Bitcoin Analyze (BTCUSDT), 1-hour time frame.
Be sure to follow the updated ideas.
Do not forget to put a Stop loss for your positions (For every position you want to open).
Please follow your strategy and updates; this is just my Idea, and I will gladly see your ideas in this post.
Please do not forget the ✅' like '✅ button 🙏😊 & Share it with your friends; thanks, and Trade safe.
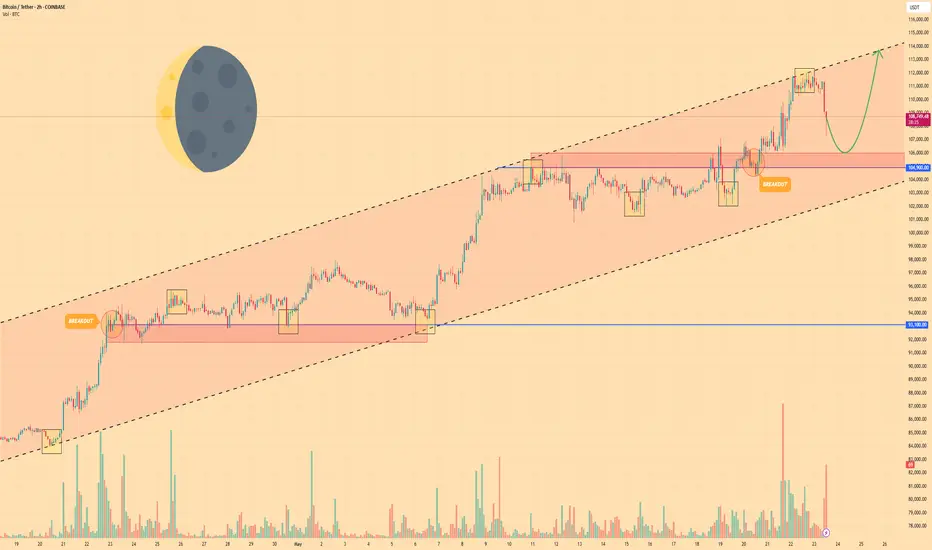
BITCOIN - Price will continue to grow inside rising channelHi guys, this is my overview for BTCUSDT, feel free to check it and write your feedback in comments👊
Price started to grow inside rising channel, where it declined to support line and then bounced up to $93100 level.
BTC broke this level at once and then some time traded near, after which bounced and continued to grow.
Soon BTC made a correction, but quickly turned around and later rose to $104900 level, after which started to decline.
After price fell a little, it made an upward impulse to resistance line of channel, breaking $104900 level.
But not long time ago, BTC bounced from this line and started to decline, so I think that price can continue to fall.
Also, I expect that price will fall to support area and then turn around and continue to grow in channel to $113700
If this post is useful to you, you can support me with like/boost and advice in comments❤️
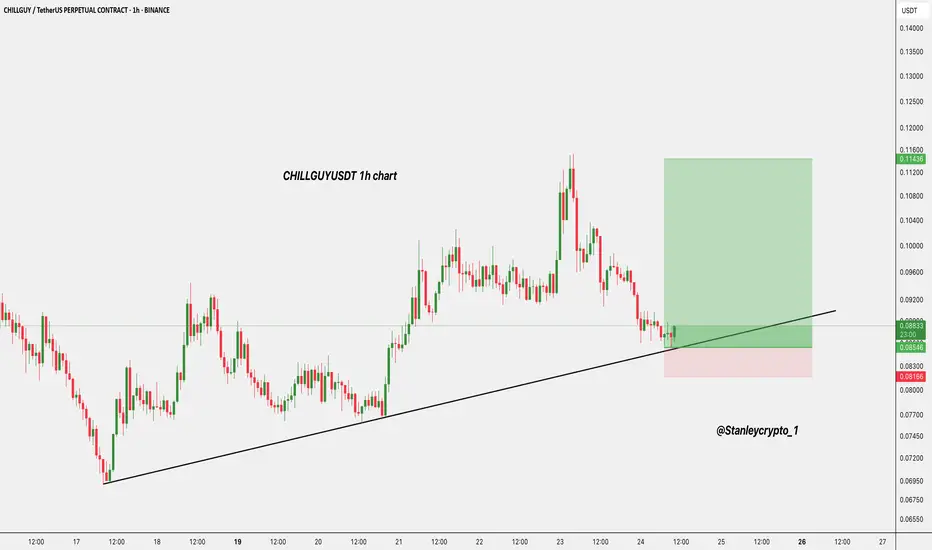
$CHILLGUYUSDT Trede Setup$CHILLGUY is respecting its ascending trendline on the 1H chart and showing signs of a bounce.
- Entry Zone: $0.086–$0.088
- Stop Loss: $0.081
Targets:
• TP1: $0.100
• TP2: $0.116
As long as the price holds above the trendline, continuation is likely.
DYOR. NFA.
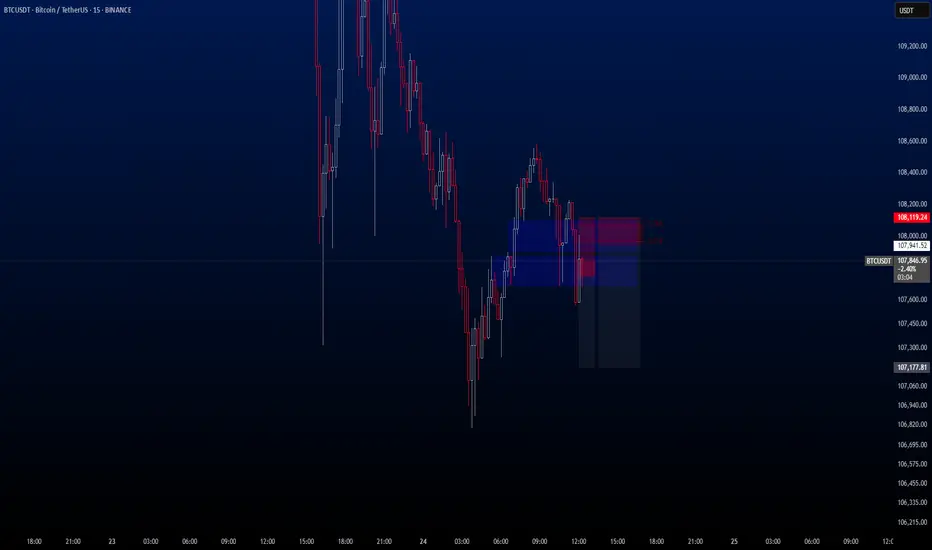
BTCUSDTHello Traders,
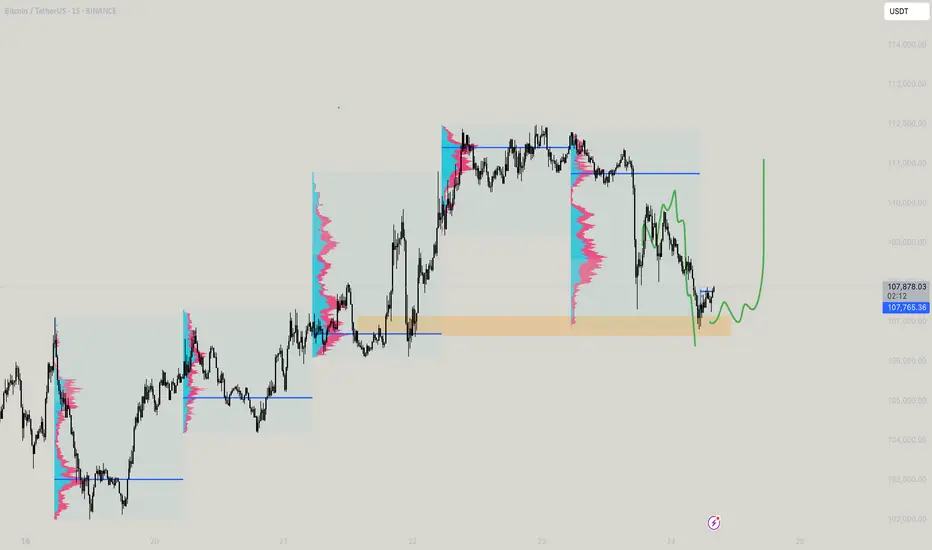
Despite it being the weekend, I’ve identified a short trade opportunity on BTCUSDT. The trade is currently active on my end, and anyone interested is welcome to consider entering as well.
🔍 Trade Details:
✔️ Timeframe: 15-Minute
✔️ Risk-to-Reward Ratio: 1:2 / 1:4
✔️ Trade Direction: Sell
✔️ Entry Price: 107,743.42
✔️ Take Profit: 107,181.56
✔️ Stop Loss: 108,119.24
🔔 Disclaimer: This is not financial advice. I’m simply sharing a trade I’ve taken based on my personal trading system, strictly for educational and illustrative purposes.
📌 Interested in a systematic, data-driven trading approach?
💡 Follow the page and turn on notifications to stay informed about upcoming trade ideas and advanced market insights.
RIP Bitcoin Sell to 45K ?Bitcoin broke the weekly channel last week. I expect a decline to 45K
Stop loss: 97600
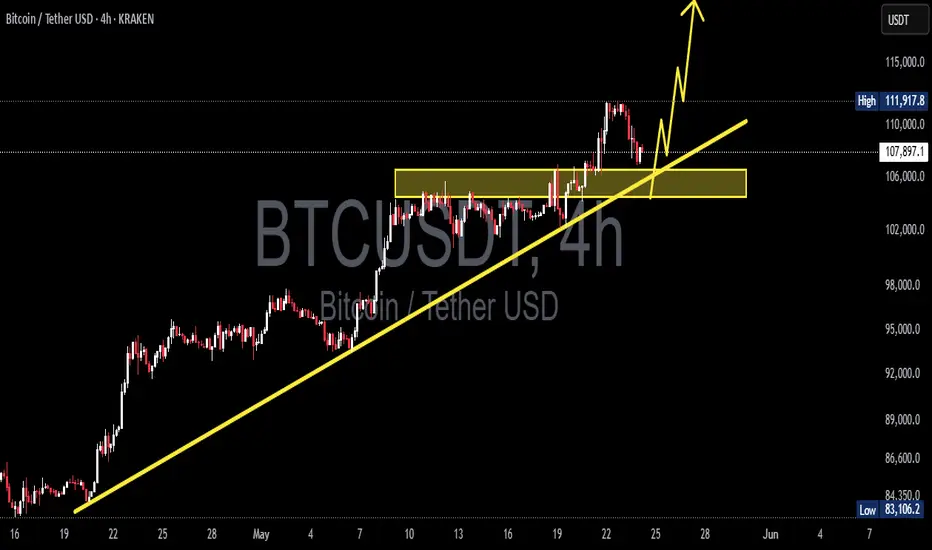
BTCUSDT 4H Analysis BTC ~ 4H Analysis
#BTC Let's start Long/Buy back at this support block with long term target of $120K - $130K - $140K - $150K above this is just bonus for you.
Trump Tariffs Risk Triggering BTC Crash as Capital Flows to GoldOn May 23rd's U.S. session, Trump's EU/Apple tariff plans sparked market chaos:
Gold surged 💥 as a safe haven.
The euro plunged on EU tariff fears.
If tariffs persist, capital may flood into gold/forex, likely triggering a BTC crash.
⚡⚡⚡ BTCUSD ⚡⚡⚡
🚀 Sell@110000 - 109000
🚀 TP 106500 - 104500
👇Accurate signals are updated every day 📈 If you encounter any problems during trading, these signals can serve as your reliable guide 🧭 Feel free to refer to them! I sincerely hope they'll be of great help to you 👇

BTC - back to 110k?Oh yeah the movement is precedented by the OB and this is a pretty dope move one can play to outplay the others, Funding fee overheated hence the news gave them a gasm to remove the buy load!!
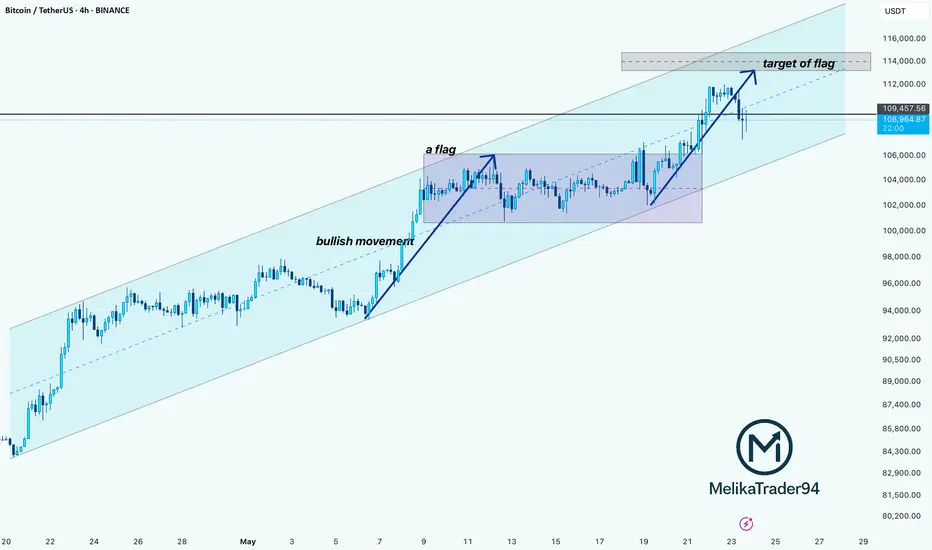
Bitcoin: Bullish Flag Breakout Targeting $114K Zonehello guys!
Bitcoin has been riding nicely inside an ascending channel, and it just broke out of a clean bullish flag on the 4H chart (classic continuation setup).
The move looks strong, and the target for this flag breakout sits around the $114,000–$115,000 zone (gray area). There’s a chance BTC pushes straight into that target if momentum holds, but we should also be ready for a possible pullback to the channel’s lower trendline before the next leg up.
That lower boundary would be a spot to watch for bullish reactions if the market cools off short term.
What I see:
Pattern: Bullish Flag within Ascending Channel
Breakout Confirmed: Strong momentum after flag breakout
Target Zone: $114,000–$115,000
Scenarios:
Direct move to target
Retest of channel support (~$106,000–$107,000) before continuation
Invalidation: A Break below the channel support would invalidate the bullish setup
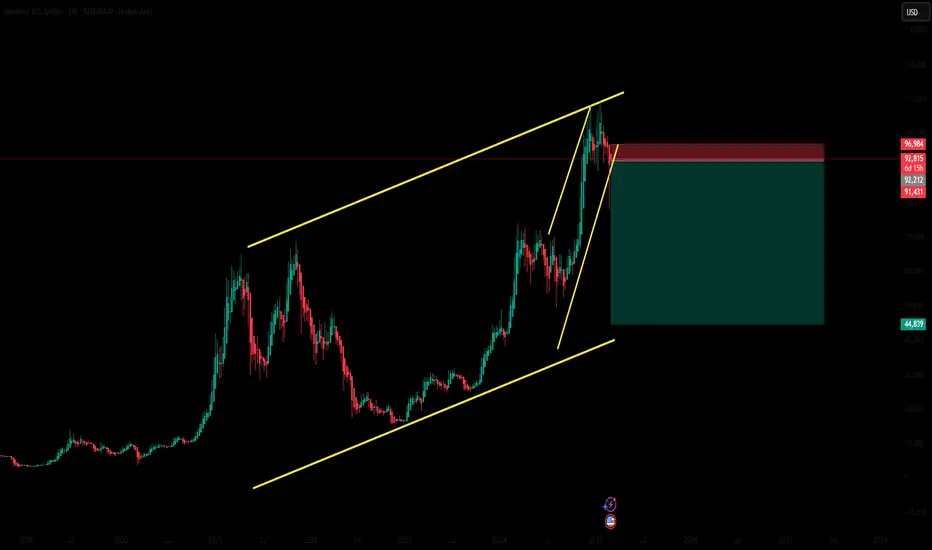
Bitcoin has the potential to return to $30,000A simple idea:
The Bitcoin price trend has clearly weakened, as you can see in the image above, the upward waves are getting weaker (the angle of the blue lines is getting smaller).
The price is moving in a curved channel and has the potential to reach $30,000.

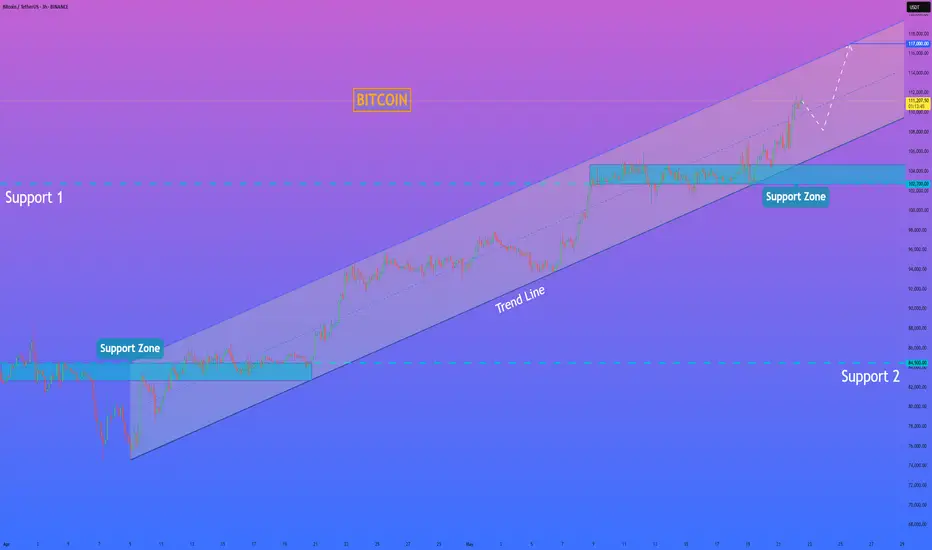
HelenP. I Bitcoin may continue to grow inside upward channelHi folks today I'm prepared for you Bitcoin analytics. In this chart, we can see how the price has been steadily moving within a well-defined upward channel, respecting its trend structure with clean rebounds from the lower boundary. The price has shown signs of a minor pullback after reaching the upper part of the consolidation range. However, it remains well-supported above the 102700 - 104700 zone, which aligns closely with both the trend line and a previous accumulation area. This confluence strengthens the case for a bullish continuation. Given the consistently higher lows, strong reaction from buyers near the channel support, and the overall bullish momentum, I believe this correction will be short-lived. The market appears to be gathering liquidity before attempting another leg upward. If the current structure holds, BTCUSDT is likely to continue climbing along the lower edge of the channel, gradually pushing toward the next significant target. My current goal remains at 117000 points, a level that aligns with the channel’s upper resistance and reflects the natural extension of the ongoing bullish movement. If you like my analytics you may support me with your like/comment ❤️
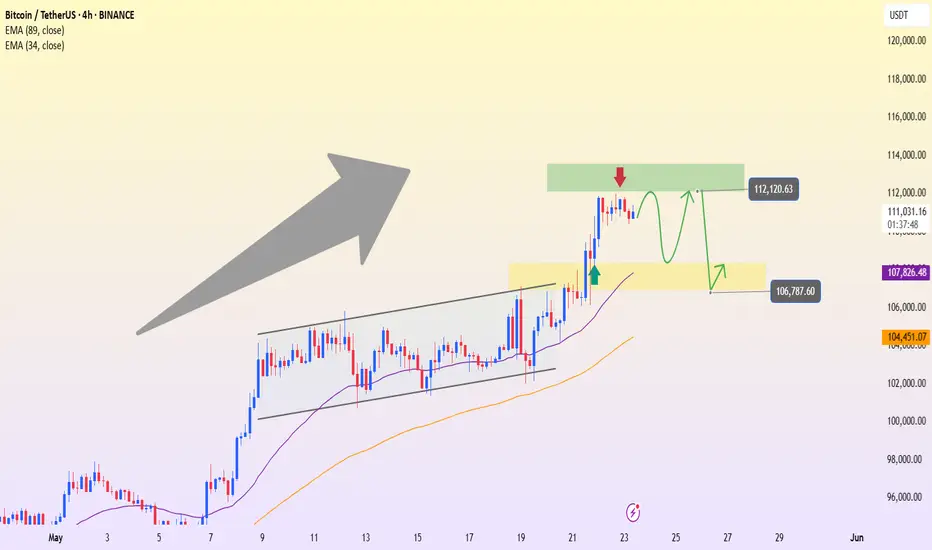
BTCUSDT – Mild Pullback, Support Holds FirmBTCUSDT remains in a clear uptrend with a structure of higher highs and higher lows, after breaking out of a prolonged consolidation pattern since early May.
The price has surged from the 106,000 resistance zone and approached the technical target around 112,000 – an area that is currently triggering a slight pullback.
At the moment, the support zone around 106,700–107,800 aligns with a demand area and the EMA34, likely serving as a springboard for the next upward move.
If BTC continues to consolidate around this zone without breaking below 106,700, the 112,000 level could be breached, paving the way for a move toward higher targets.
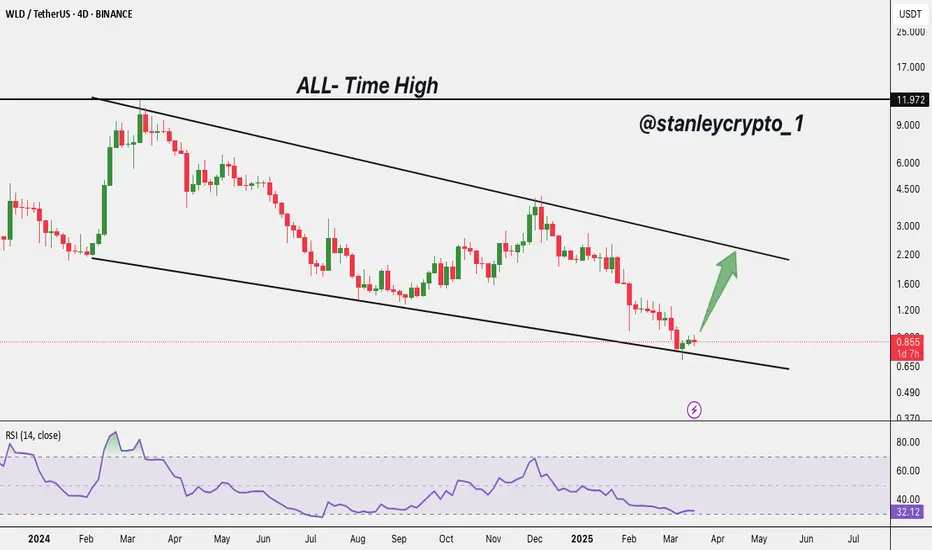
$WLD Price Update The downtrend continues, but we’re seeing signs of a potential bounce! 🚀
RSI at 32.15 approaching oversold levels!
Price hitting the bottom trendline of the descending channel.
Possible reversal to $2.20
Could this be the breakout we've been waiting for? 👀
BTCUSDT Hello everyone!
Today's first signal came from the BTCUSDT pair. After reaching an all-time high of $112,000 yesterday, BTC formed an ABCD pattern and retraced down to the Fibonacci extension level 1.000. In this pattern, a buy trade is typically initiated after the price retraces to the 1.000 level, and the Take Profit is set at the 0.618 Fibonacci level drawn from the B wave to the D wave.
Although I didn’t open this trade based on the ABCD strategy, I noticed the pattern forming and wanted to share it with you purely for educational purposes.
As for the current active trade, here are the detailed parameters:
🔍 Trade Details:
✔️ Timeframe: 15-Minute
✔️ Risk-to-Reward Ratio: 1:1.50
✔️ Trade Direction: Buy
✔️ Entry Price: 110844.19
✔️ Take Profit: 111497.09
✔️ Stop Loss: 110408.00
🔔 Disclaimer: This is not financial advice. I'm sharing a trade I'm personally taking based on my own system, strictly for educational and illustrative purposes.
📌 Interested in a systematic, data-driven approach to trading?
💡 Follow the page and turn on notifications to stay informed about future trade ideas and advanced market insights.
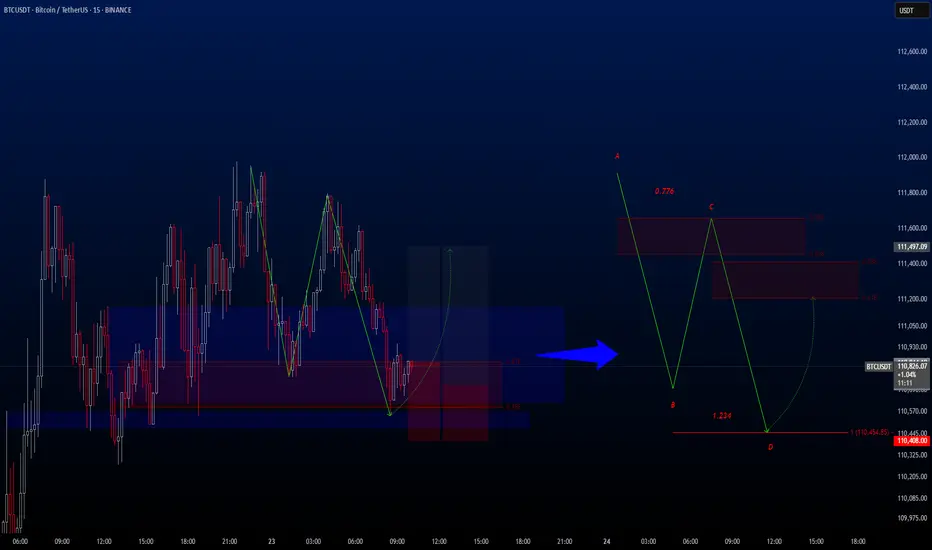
Next Target: Right Fibonacci Ratio 2.24 (116940.43)
Hello, traders.
If you "Follow" me, you will always get the latest information quickly.
Have a nice day today.
-------------------------------------
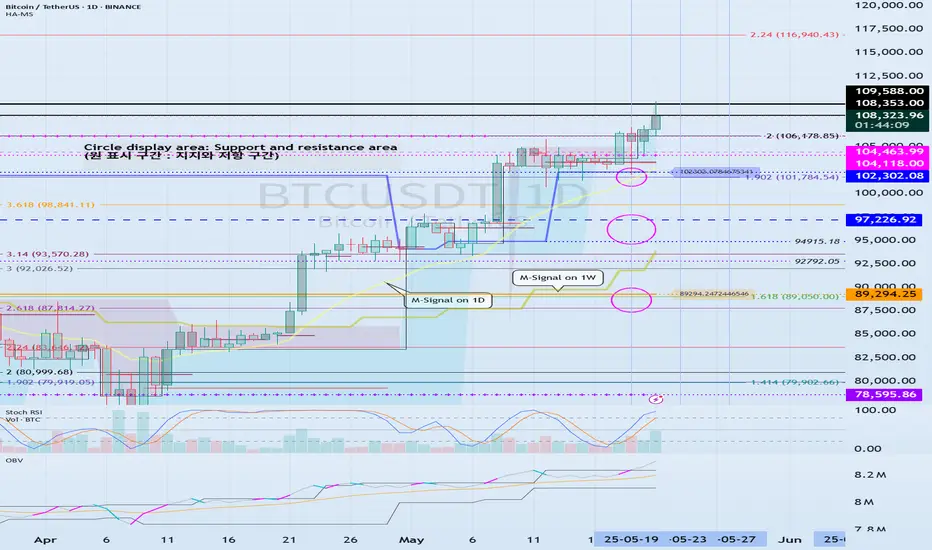
(BTCUSDT 1D chart)
It was supported near the Fibonacci ratio 2 (106178.85) and rose to renew the new high (ATH).
If this upward trend continues, it is expected to rise near the Fibonacci ratio 2.24 (116940.43).
-
If it falls,
1st: 102302.08
2nd: 97226.92
3rd: 89294.25
You need to check which of the 1st and 3rd areas above is supported.
Since the M-Signal indicator on the 1D chart is passing near the 1st area, if it falls below this, there is a possibility that it will turn into a short-term downtrend.
The M-Signal indicator on the 1W chart is still rising around 94K, but since the 97226.92 point is the HA-High indicator point on the 1W chart, I think it is likely to continue the upward trend if it receives support around this area.
The 89294.25 point is the HA-Low indicator point on the 1D chart, so if it receives support around this area, it is a good time to buy.
-
(30M chart)
If the price continues to rise by renewing the ATH, it is difficult to set support and resistance points.
Therefore, you need to be careful when trading coins (tokens) that are renewing the ATH.
Therefore, I think it is better to trade in a short-term trading (day trading) method, but to leave the number of coins (tokens) corresponding to the profit for the profit realization method.
In other words, when the price rises and then falls by the purchase price, the method is to sell only the purchase amount (+ transaction fee) to leave the coin (token) corresponding to the profit.
When selling, you should not sell the number of coins (tokens), but you should sell only the purchase amount.
You do not necessarily have to sell all of the purchase amount, but if possible, it is better to sell close to the purchase amount.
The reason is that when the price plummets or turns downward, there is a possibility of psychological pressure.
In my chart, the trading strategy is when the HA-Low and HA-High indicators are touched.
If it is supported near the HA-Low indicator, it is the time to buy, and when it meets the HA-High indicator, it is the time to sell.
However, if it is supported near the HA-High indicator, there is a possibility that a stepwise upward trend will continue, so a split selling strategy is necessary.
On the other hand, if it falls after receiving resistance from the HA-Low indicator, it is likely to show a stepwise downtrend, so a split buying strategy is needed.
-
When you meet the HA-Low and HA-High indicators, if you check the movement of the OBV indicator, it can help you create a trading strategy.
That is, when the OBV indicator breaks upwards through the Low Line, High Line, and OBV EMA, the price is likely to rise, and if the opposite happens, the price is likely to fall.
-
Thank you for reading to the end.
I hope you have a successful trade.
--------------------------------------------------
- This is an explanation of the big picture.
(3-year bull market, 1-year bear market pattern)
I will explain more details when the bear market starts.
------------------------------------------------------
Bitcoins LinesPrice is approaching previous highs with strong bullish momentum and no major resistance until the red-marked level around 240,000. Given the breakout structure and Fibonacci confluence, the most likely scenario is continuation toward the 140,000–160,000 range before facing any significant rejection. A stop loss would be prudent just below 91,000, with the initial target set at 139,000, and extended TP zones at 155,000 and 239,000. This trade aligns with a longer-term macro trend.
