At ATH, blast continuation or tap and turn?If you find this information inspiring/helpful, please consider a boost and follow! Any questions or comments, please leave a comment!
🚀 Tap & Turn… or Blast?
Bitcoin is reacting well to mapped levels, maintaining structure and respecting key zones. Price action continues to print HLs and HH keeping the bulls confident, atm.
💥 Levels Still Respecting
Recent price action has shown solid reactions at prior resistance and support zones. Nothing overly aggressive, but clean enough to keep structure traders engaged.
🐂 Bulls Still in Control (for Now)
Higher lows remain intact, keeping the bullish structure alive. I did take a lower-degree short, but without a clean break of those HLs, there's no reason to call a shift yet. A break of that pattern would be the first real sign of momentum fading.
🚧 Key Watch Zone: 106K–104K
This is where things get more critical. A clean break below that zone could tilt the balance.
Trade safe, trade smart, trade clarity.
BTCUSDT
Trading balanceTrading balance The price of the asset has rebounded from the balance zone. With the prospect of growth into the resistance zone.
$INITUSDT Breakout AlertINIT just broke out of a falling wedge, a strong bullish signal.
Targeting a 58% move toward $1.4488.
Momentum looks solid. Watch for follow-through!
DYOR. Not financial advice.

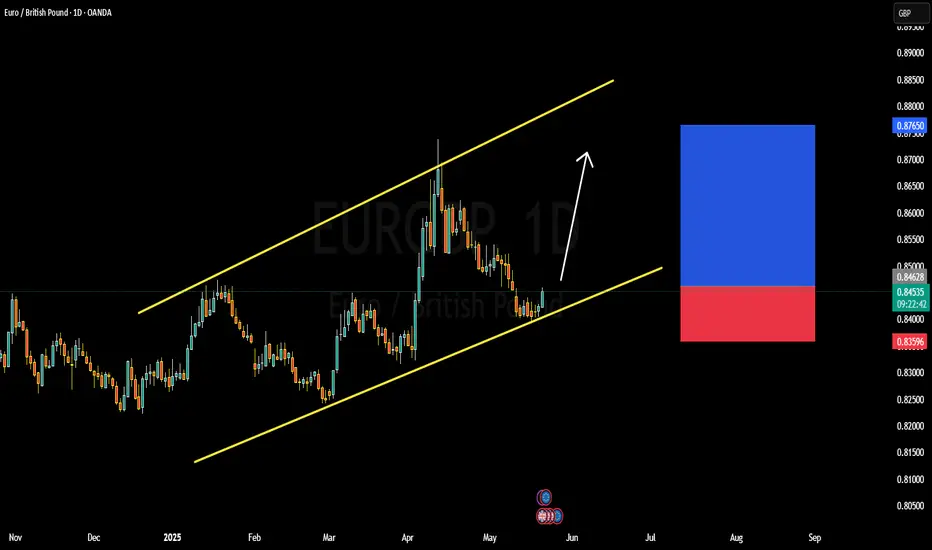
EURGBP BULLISH OR BEARISH DETAILED ANALYSISEURGBP is currently respecting a well-defined rising channel structure on the daily timeframe, and the pair has just delivered a strong bounce off the lower trendline support. This fresh reaction suggests renewed bullish momentum from the bulls stepping in at a key zone. The current price is hovering around 0.84–0.8450, and I’m targeting a move towards the 0.87 area, aligning perfectly with the upper boundary of the channel and a clean resistance level from previous market structure.
From a fundamental standpoint, euro sentiment is being supported by sticky inflation across the Eurozone. The ECB remains cautious with any premature easing, with policymakers signaling a data-dependent approach to rate cuts. Meanwhile, the UK economy is under pressure after the latest GDP figures confirmed weak growth, adding weight to the Bank of England’s dovish leanings. Traders are now increasingly pricing in rate cuts from the BOE in the coming quarter, creating a clear divergence in monetary policy outlooks — a bullish driver for EURGBP.
This technical setup is further reinforced by bullish candlestick formations on the daily chart, signaling a potential reversal from recent weakness. RSI is bouncing off mid-levels, and there's early crossover potential in MACD favoring upward momentum. Price has also reclaimed key support near 0.8400, now likely to act as a floor going forward. As long as price remains above this zone, the path of least resistance remains to the upside.
With this combination of a rising channel pattern, supportive euro fundamentals, and GBP macro weakness, EURGBP presents a high-probability long opportunity. I remain bullish on this pair with a clean 0.87 target in view. Momentum is building, and this setup fits perfectly into a swing trading model with trend continuation potential.
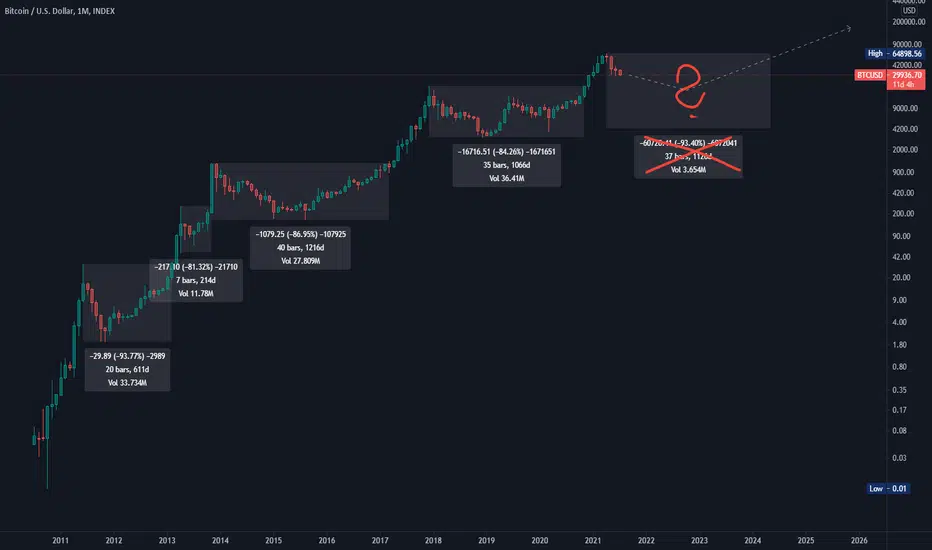
Lifetime Bitcoin ATH --> ATH chartHere you can see a historical, 1M graph of Bitcoin, time needed for overcoming of its ATH and biggest low in this period.
Maybe discount around 80 % comming again?
What you think.. How long now?
Anyway, Iam long! HODL!
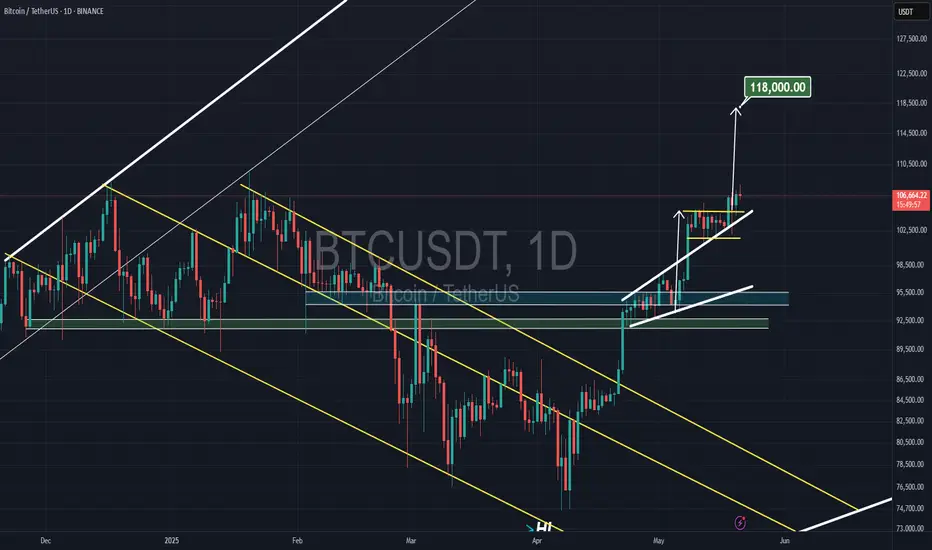
Bitcoin BULLFLAG on daily ( 21MAY2025 )It looks like Bitcoin has bull-flag on daily time frame and the yellow resistance line already has broken.
Now the target of this bull-flag is about $118k so far.
Shorting Analysis on Bitcoin - Fxdollars- {15/04/2025}Educational Analysis says that BTCUSD may give countertrend opportunities from this range, according to my technical analysis.
Broker - BITSTAMP
So, my analysis is based on a top-down approach from weekly to trend range to internal trend range.
So my analysis comprises of two structures: 1) Break of structure on weekly range and 2) External pushback to fill the remaining fair value gap
Let's see what this pair brings to the table for us in the future.
Please check the comment section to see how this turned out.
DISCLAIMER:-
This is not an entry signal. THIS IS ONLY EDUCATIONAL PURPOSE ANALYSIS.
I have no concerns with your profit and loss from this analysis.
I HAVE NO CONCERNS WITH YOUR PROFIT OR LOSS,
Happy Trading, Fx Dollars.

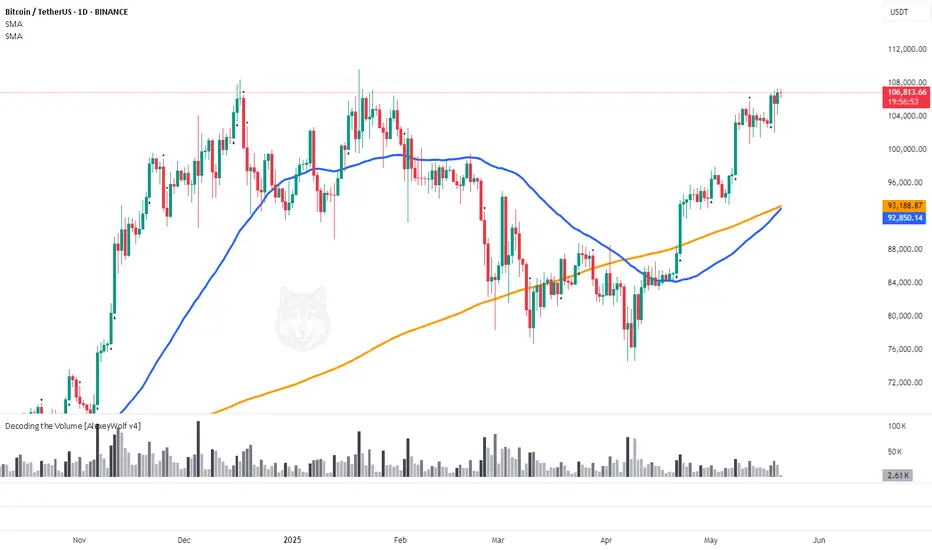
Bitcoin is approaching a “Golden Cross”🚀 Bitcoin is approaching a “Golden Cross”
(the 50-day moving average is about to cross above the 200-day)
What does that mean, and what might come next?
📍 What’s happening right now
BTC is squeezed in a $101 K – $107 K range.
The 50-day SMA is racing toward the 200-day SMA; the bullish crossover (the “Golden Cross”) is expected within the week.
On Deribit, more than 60 % of the 30 May option series are $110 K call options.
When traders buy these calls, market-makers hedge by buying spot BTC. The nearer the price gets to $110 K, the more spot BTC they have to buy.
📈 How the market behaved before
The 10-day chart shows the 50-day (blue) and 200-day (orange) SMAs.
In the last three cycles, a bullish Golden Cross appeared 50–90 days after a bearish “Death Cross.” Each time, the cross formed inside a buyer zone (marked with blue rectangles).
In the 2nd and 3rd cycles, price never came back to retest that buyer zone.
Right now, the buyer zone is already in place, the Golden Cross is only about $300 away, and 50 days have passed since the last Death Cross. Some traders seem to be buying early, betting on a break to a new all-time high (ATH).
Wishing you profitable trades!
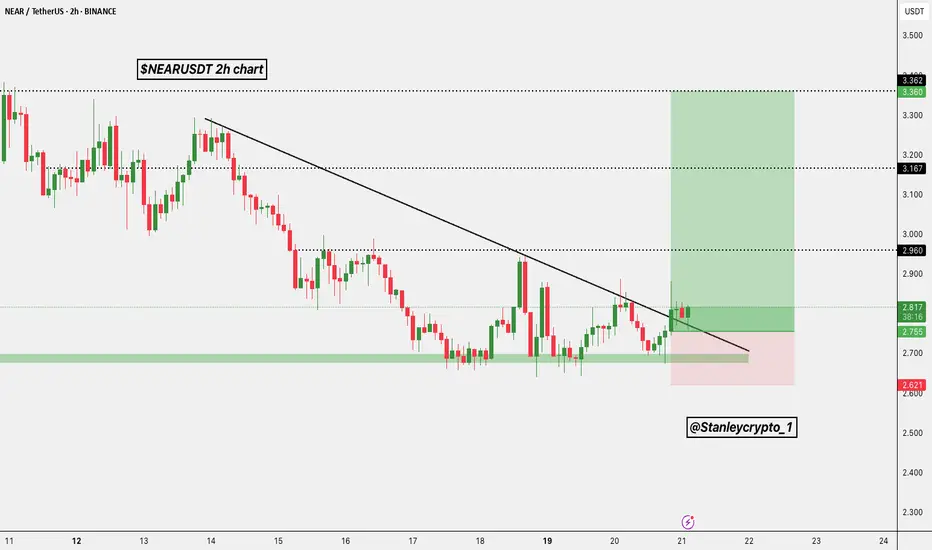
$NEAR 2H Trade Setup.Breakout from descending trendline, bounce from demand zone
. Entry: CMP
. SL: $2.62
. TP: $2.96 / $3.17 / $3.36
Clean breakout. Watching for follow-through.
DYRO, NFA
#BTC/USDT Highest Daily Close! What it Means? $117k on cards?Bitcoin Daily Update – Bulls Take the Lead
Bitcoin just recorded its highest daily close in history at $106,849.99 (Binance), surpassing the previous record of $106,143.82 set on January 21st. While the difference is minor in percentage terms, it's still a meaningful win for the bulls.
The next key level to watch is $113k to $117k, based on the Fibonacci extension target.
For confirmation, we need another solid daily candle close above the current range. The $106K resistance has already been broken, and BTC is holding above it, indicating strong bullish momentum.
To avoid getting trapped in a fakeout, consider adding the 14 EMA to your chart. As long as BTC holds above this EMA, the uptrend is likely to continue.
Once BTC's show is over, Altcoins will likely follow suit.
INVALIDATION OF THIS CHART: A close below $102k in confluence with 14EMA in Daily.
I hope this update gives you actionable insight. If it did, feel free to follow and like. Let me know your thoughts or questions in the comments, I read every one.
Thank you
#PEACE

Bitcoin (BTC) Market Update – May 19, 2025📅 Bitcoin (BTC) Market Update – May 19, 2025
BTC is trading at $105,488 with a slight +0.0115% 24h uptick.
📊 Technical Snapshot:
• Price Range: $102,381 – $106,540 (Moderate volatility)
• Support: GETTEX:97K – $98.5K | Resistance: $110K – $115K
• Trend: Consolidation Phase – Awaiting breakout
🔗 On-Chain Highlights:
• 87% of supply in profit = Potential for sell pressure
• Accumulation increasing across wallet cohorts
• Improved investor sentiment
🧭 Fundamentals to Watch:
• Sharpe Ratio: 1.72 – High risk-adjusted returns
• ETF inflows rising = Institutional demand
• Macro Index flashing Buy signal
📈 BTC Price Outlook:
• Short-Term: $100K – $110K
• Mid-Term: $110K – $129K
• Long-Term: $174K – $462K 🚀
✅ Summary:
Bitcoin remains range-bound but shows strength in accumulation and fundamentals. Keep an eye on $110K resistance for a possible breakout.
#Bitcoin #BTC #CryptoAnalysis #SorooshX

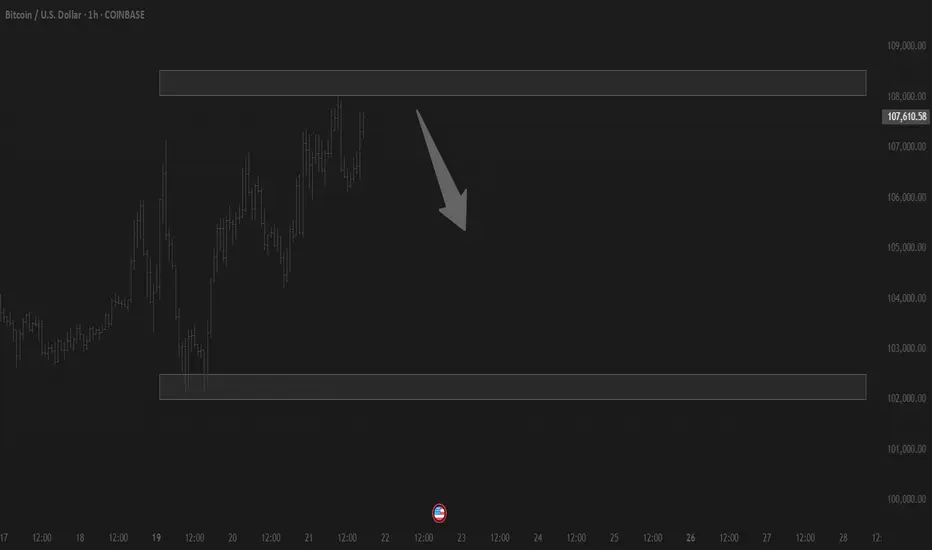
BTC Volatility Range Shifts Upward: Focus on Shorting The volatility range is moving upward, rising from 101,500–105,000 to 104,000–107,000 📈. It’s advisable to focus on shorting at higher levels ⏬. Currently, BTC is still in a range-bound fluctuation—just control your trade position sizes properly, and there won’t be any major issues essentially 😊!
⚡⚡⚡ BTCUSD ⚡⚡⚡
🚀 Sell@107000 - 106000
🚀 TP 104500 - 103500
👇Accurate signals are updated every day 📈 If you encounter any problems during trading, these signals can serve as your reliable guide 🧭 Feel free to refer to them! I sincerely hope they'll be of great help to you 👇

#BTC/USDT#BTC
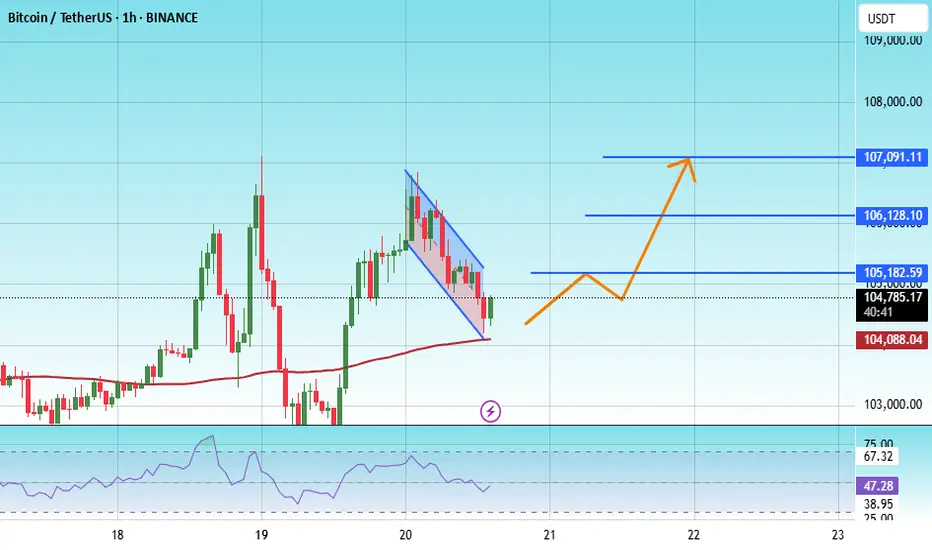
The price is moving within a descending channel on the 1-hour frame, adhering well to it, and is on its way to breaking it strongly upwards and retesting it.
We are seeing a rebound from the lower boundary of the descending channel, which is support at 104090.
We have a downtrend on the RSI indicator that is about to break and retest, supporting the upward trend.
We are looking for stability above the 100 moving average.
Entry price: 104619
First target: 105128
Second target: 106128
Third target: 107091
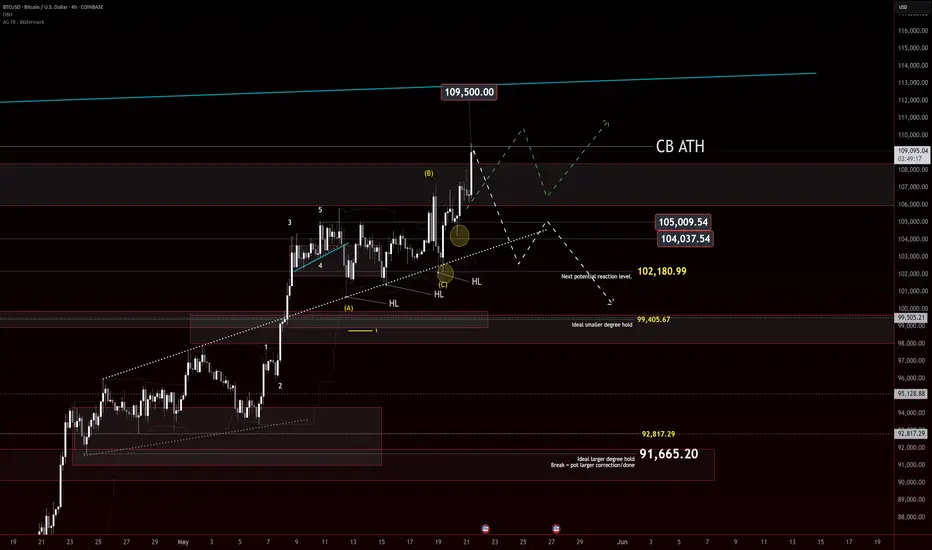
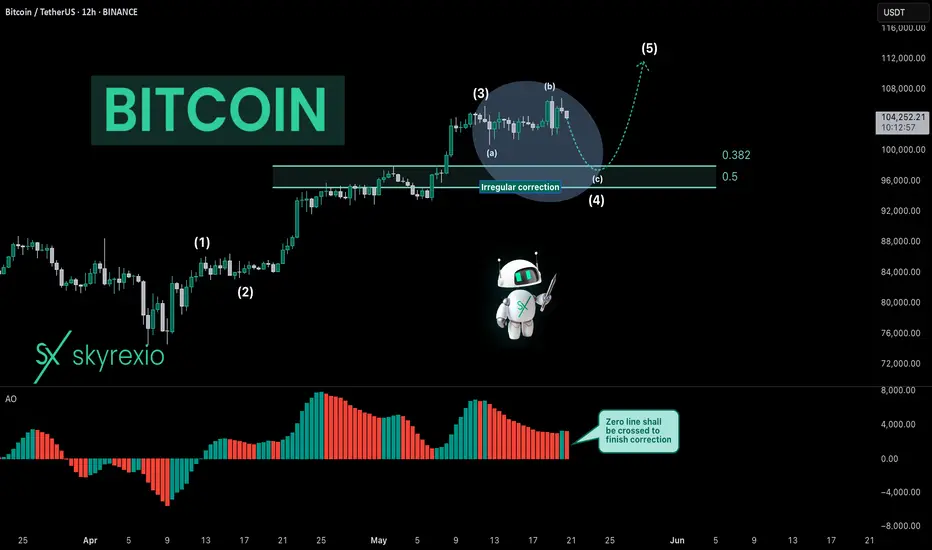
Bitcoin Is Printing Irregular CorrectionHello, Skyrexians!
Despite the negative comments that BINANCE:BTCUSDT will pump instead of my bearish prediction and Saylor's Bitcoin purchases I am going to follow my scenario - nothing has changed. Based on my experience price now is printing the most difficult shape of correction - irregular ABC.
In recent analysis I explained why we shall use now 12 hours time frame. On this time frame Awesome Oscillator shall cross zero line to finish correction. Target for irregular correction usually at 0.38 Fibonacci at $97.5k, but also can touch $95k with the wick.
Best regards,
Ivan Skyrexio
___________________________________________________________
Please, boost this article and subscribe our page if you like analysis!
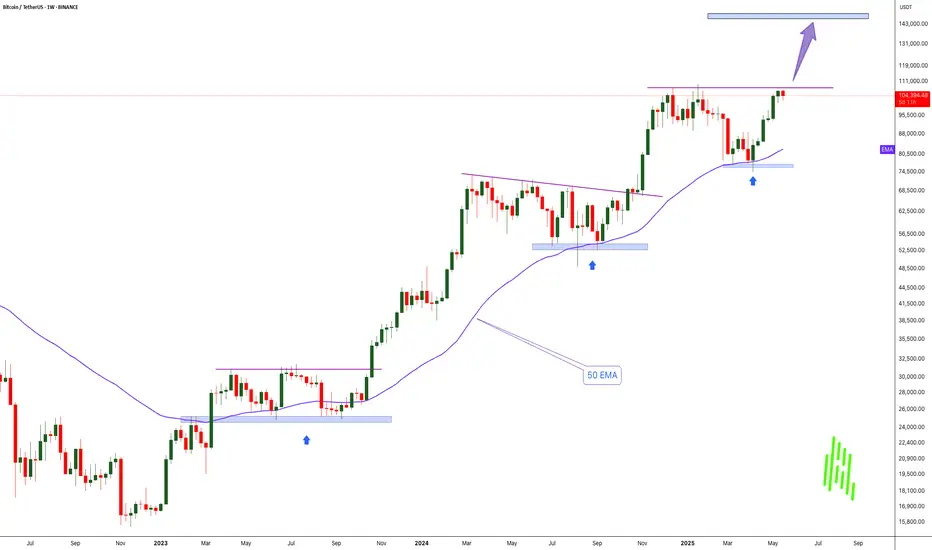
History Repeats: Bitcoin Bounces from Weekly 50 EMA-$150K Next!!MARKETSCOM:BITCOIN continues to show exceptional strength and bullish momentum. If we look back at the charts from 2023 and 2024, a clear pattern emerges — every time BINANCE:BTCUSDT touched the 50 EMA on the weekly chart, it led to a significant rally and eventually new all-time highs. That same setup seems to be unfolding again right now.
Recently, COINBASE:BTCUSD tested the 50 EMA around the $75,000 level and has since bounced strongly. The price has reclaimed the $100,000 mark and is now challenging previous all-time high resistance. Historically, after a successful bounce from this key moving average, Bitcoin hasn’t just recovered — it’s exploded to new highs.
Based on this repeating pattern, our current cycle target is set at $150,000. A clean breakout above the current resistance zone could be the catalyst that propels BYBIT:BTCUSDT Bitcoin into uncharted territory once again. The structure remains bullish, momentum is building, and the trend clearly favors the upside.
This is a classic “Buy and HODL” moment. The technicals are aligning, the market psychology is shifting, and all signs point toward a continued bull run. Buckle up — it looks like we’re in for another legendary Bitcoin rally.
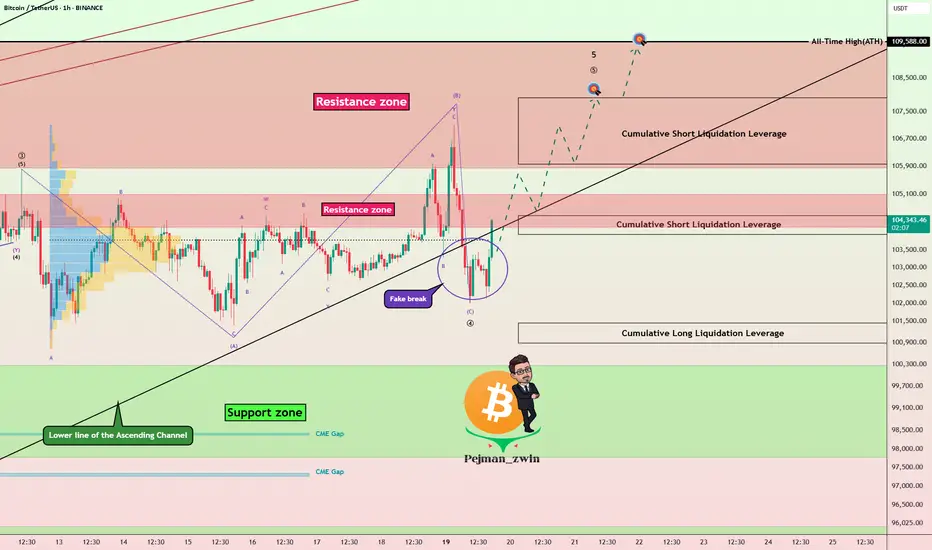
Bitcoin vs Resistance Zones | Fake Breakdown Below the Channel!Bitcoin ( BINANCE:BTCUSDT ) has been moving up and down with high momentum over the past 24 hours and finally fell below the lower line of the ascending channel . Is this break of the lower line of the ascending channel valid?
Bitcoin is trading near the Resistance zone($105,100-$104,140) , Cumulative Short Liquidation Leverage($104,478-$103,941) . Since the volume of breaking of the lower line of the ascending channel is NOT high, the probability of a fake break is very high (in my opinion).
In terms of Elliott Wave theory , the structure of the main wave 4 seems to be an Expanding Flat(ABC/3-3-5) . The main wave 5 could lead to the formation of a new All-Time High(ATH ).
One of the reasons why I think we saw a Fake Break below the lower line of the ascending channel is that I think the S&P500 Index ( SP:SPX ) will trend upward , and given the high correlation between Bitcoin and S&P500 Index these days, we can expect Bitcoin to increase .
I expect Bitcoin to start rising again AFTER breaking the Resistance zone($105,100-$104,140) and touch the targets I have indicated on the chart.
Note: If Bitcoin touches $101,800, we can expect more dumps.
Please respect each other's ideas and express them politely if you agree or disagree.
Bitcoin Analyze (BTCUSDT), 1-hour time frame.
Be sure to follow the updated ideas.
Do not forget to put a Stop loss for your positions (For every position you want to open).
Please follow your strategy and updates; this is just my Idea, and I will gladly see your ideas in this post.
Please do not forget the ✅' like '✅ button 🙏😊 & Share it with your friends; thanks, and Trade safe.
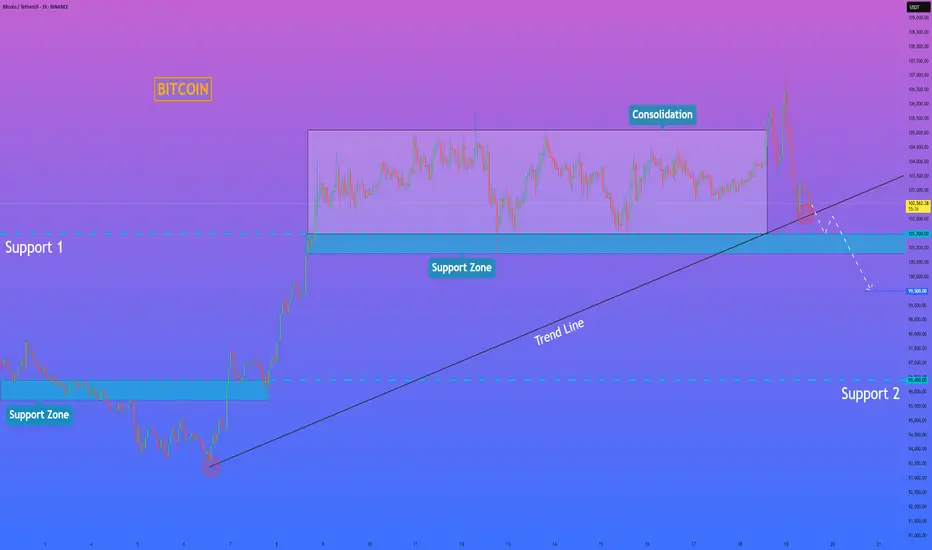
Bitcoin can continue grow in channel, after small correctionHello traders, I want share with you my opinion about Bitcoin. In this chart, we can see how the price remains inside a clear upward channel, respecting both support and resistance boundaries. After breaking above the 93400 - 92400 support area, the price continued to grow and formed a new support zone between 101700 - 102700 points. This area has been tested several times, showing strong buyer interest and keeping the bullish structure intact. Right now, BTC is hovering just above this support area. A minor correction down to this zone would be healthy and could provide fuel for the next upward leg. The market structure shows higher highs and higher lows, typical of a stable channel-driven trend. As long as the price stays above 101700 points, I expect it to move toward the upper channel boundary. That’s why my current target is set at 109000 points, which is the next key resistance and the top of the channel. This move would align with the current trend and follow the previous impulse-retracement pattern we’ve seen throughout this structure. Please share this idea with your friends and click Boost 🚀

HelenP. I Bitcoin can drop to $99500, breaking support levelHi folks today I'm prepared for you Bitcoin analytics. Price is currently testing a crucial area where multiple technical factors converge. After an extended period of consolidation between 101500 and 105100 points, the price failed to break the upper boundary and instead reversed, showing increased bearish momentum. The recent move has brought BTC right to the lower edge of the consolidation range, which aligns with the ascending trend line, a level that has held multiple times before. This time, however, the setup looks weaker. Price pierced through the trend line slightly, and while there was an initial reaction from buyers, the overall structure suggests a loss of bullish strength. The market has been forming lower highs, and this recent failure to hold above the trend line could be a signal that sellers are beginning to dominate. Given this context, I expect that BTCUSDT will soon break decisively below the ascending trend line and move through the 101500 - 100800 support zone. If this zone is lost, the next logical target lies at the 99500 level, which aligns with the broader structure and the base of a previous impulse. My outlook remains bearish for now, with 99500 as the next key objective. If you like my analytics you may support me with your like/comment ❤️
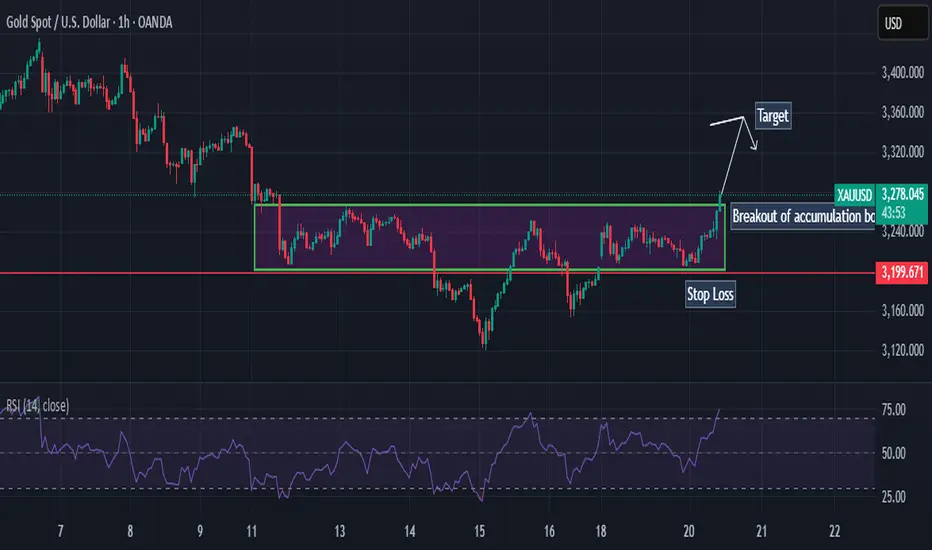
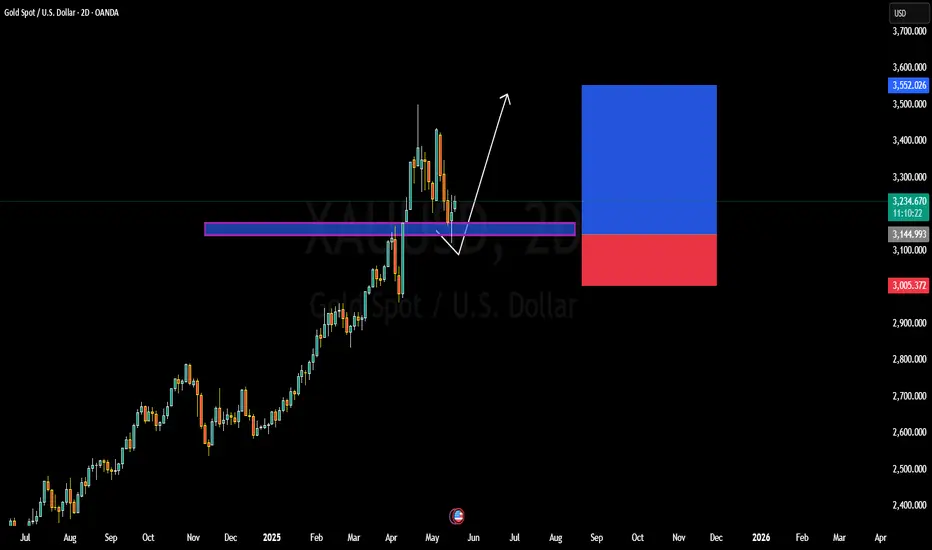
XAUUSD BULLISH OR BEARISH DETAILED ANALYSISXAUUSD is showing a textbook technical reaction from a well-defined support zone around the 3145–3170 range, which aligns perfectly with previous structure and demand zones. After a sharp retracement from recent highs, gold is now posting a strong bullish bounce, validating this level as a significant area of buyer interest. With today’s push above 3230, this bounce confirms our bullish thesis, and I now expect a continuation move toward the 3500 mark in the coming weeks.
Fundamentally, gold remains one of the most favored assets in 2025 due to ongoing global economic uncertainty, rising geopolitical risks, and persistent central bank demand. With US inflation cooling and the Fed signaling the potential for rate cuts later this year, real yields are slipping, giving gold the macro tailwind it needs to push higher. Moreover, recent data from China shows continued accumulation of gold reserves, reinforcing the long-term bullish case.
Technically, this correction appears to be a healthy retest in a strong uptrend. The market has respected the previous breakout level, and we are seeing early signs of momentum returning. The price action is starting to structure higher lows, and if price clears the 3250 level convincingly, it will likely trigger further momentum-based buying. I’m targeting 3500 as the next major resistance, where we could see some profit-taking.
This setup is one of the cleanest long opportunities on the board. With institutional positioning still net long, and technical and macro alignment pointing higher, I see this as a high-conviction trade. As long as price holds above 3145, the path of least resistance remains up. I’ll be closely watching for further confirmation as we build toward the 3500 target.
Interesting moment for try to Sell BTCInteresting moment for try to Sell BTC. We can see formed flat channel. Now we are tested it from down and I hope that now we will move to the test previous local low. The stop level around up level channel. Will see...
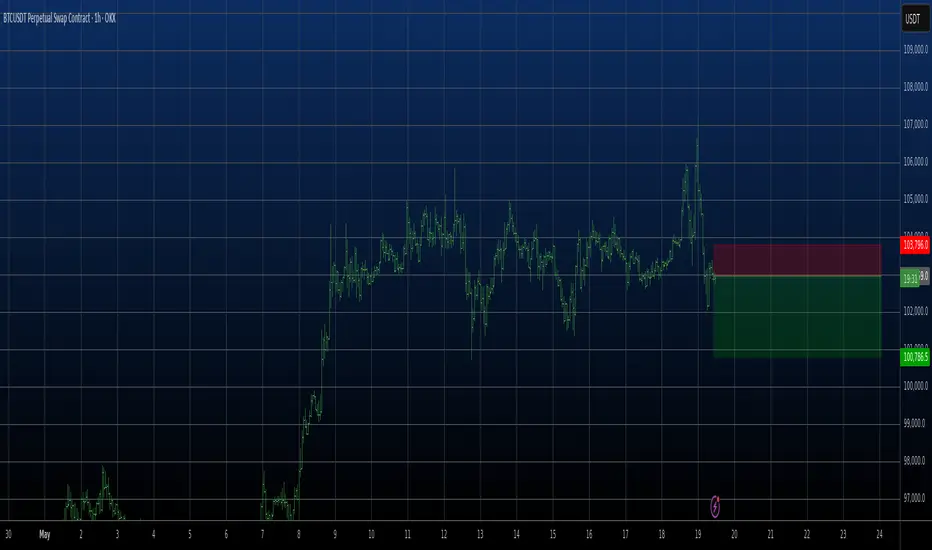
Bitcoin Hourly Analysis (2H)Given Bitcoin's rapid movement near previous highs, along with quick pump-and-dump action and liquidity grabs, it's expected that the liquidity pool below the price will be swept, collecting orders from the green zone, and then price may reverse back to the upside.
A 4-Hour candle closing below the invalidation level will invalidate this analysis.
For risk management, please don't forget stop loss and capital management
Comment if you have any questions
Thank You

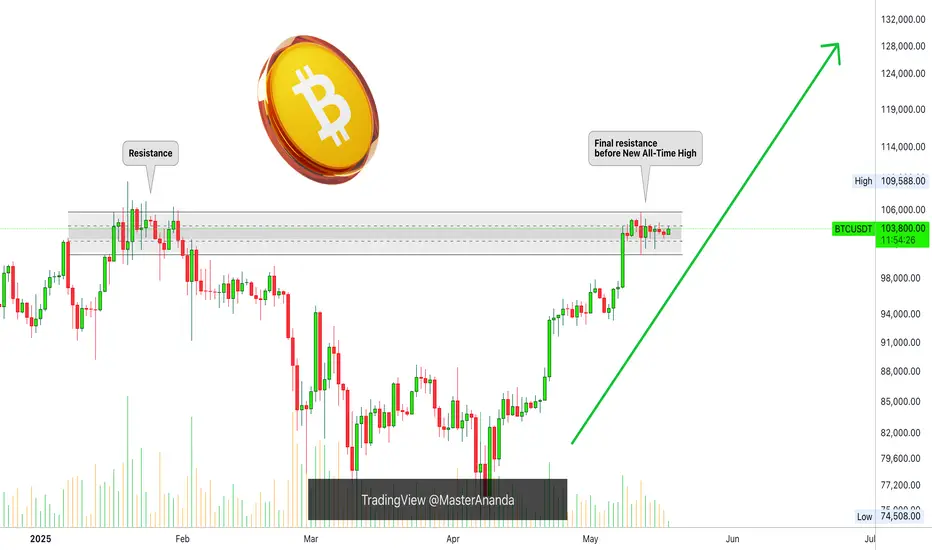
Altcoins: Bitcoin Daily Turns Bullish, New All-Time High But...New All-Time High but how high? How high is Bitcoin set to move in this breakout as a the new All-Time High? How high is Bitcoin set to continue in May that still has 12 days left and what about June and July 2025?
What happens after June-July 2025 and what happens in late 2025?
What's the map? How high comments section below—yes?!
Bitcoin is now challenging the "final resistance." This is truly the final resistance because we are in the 2025 bull market. There are many things happening around this final resistance. For example, the Altcoins market.
The Altcoins market goes bullish when Bitcoin grows above 100K yes? Yes it did/does and has been growing for an entire month many pairs are up 70% to 100% some are up 400% and this is only the start but, think of this... What happens when Bitcoin hits a new All-Time High?
For Bitcoin this isn't much, the ATH is at $109,588 and a new All-Time High is $110,000 but what about the Altcoin? Magic!
When Bitcoin hits a new ATH it goes on all media all screens and nobody can deny it is happening because it is happening and the market is full green. This creates boom, interest and many people trade only when resistance breaks. The Altcoins will boom growing 2-3 levels up within days. The bottom forever gone massive profits, lives changing and this is only the start.
The first level of importance as Bitcoin moves in price discovery eventuality and territory and market conditions—change, grow, win—sits around $120,000 and $130,000. This is the level to watch for.
Some people are saying a massive correction at this point more like a normal correction or maybe nothing for a few reasons that I will explain below.
The next range is $150,000 and $160,000 and here is the thing. If Bitcoin is going to $180,000-$220,000, then the correction cannot happen at 120/130K. It needs to happen on the second level around 150/160K, do you understand?
If the strong mid bull market correction happens at $120,000-$130,000 this is bad news because the final market cycle top gets lowered. If it happens later we have $180,000, $200,000, $220,000 or more. And this is the interesting part and what we want.
We are still in May month #5 and the minimum we can expect growth is until November month #11 which gives us 6 months. 6 months of straight up is a very long time. With a 2-3 months correction now it isn't that long.
These are the things that we need to consider but aim high because Bitcoin will always surprise.
Minimum, you can aim for $180,000 as the cycle top—minimum. Go higher leave a comment and with the excitement, euphoria and the first time since 2021 seeing so much growth, institutional adoption, Trump, Saylor, El Salvador think $220,000 can you see how that works? Comment below.
Things are bright for Cryptocurrency holders know why now think in this way. Your life can change forever if you take the right action following the right steps in the next 6 months. Imagine a lifetime of profits secured in this bull market bull run. The choice is yours.
It can happen of course, it has happened many times and will continue to happen but we have to be smart. It is happening now but we are early this time we have experience and we know exactly what will happen. It is not a question of if but when. When? In late 2025.
Thank you for reading.
Your comments show your continued support and helps activate the bots to do the same. Show them some love!
Namaste.