What's The Lowest Bitcoin Can Go? (Top Altcoins Choice —Comment)Bitcoin just hit a new all-time high recently and is consolidating just below resistance. I have a question: How far down can Bitcoin go on a sudden retrace?
That's a great question. Assuming that Bitcoin will continue growing mid-term and long-term, we can expect some more consolidation before higher prices. A retrace is not mandatory but is possible. A correction is almost impossible; low probability; not likely.
The worst case scenario Bitcoin does go down and the action should stop right at the previous high. Resistance turned support. That is, $112,000 to $110,000 would the first and main support range. Harder for Bitcoin to move much lower but these levels are not active yet.
If Bitcoin were to produce an extreme shakeout before additional growth, I would say the worst possible would be a touch of $104,000, but this is still a low probability setup. The chances are that Bitcoin will continue sideways while the altcoins grow. The fact that the altcoins are bullish means that Bitcoin will resume growing in due time. The next major move is another advance exceeding $130,000. It can happen within weeks or next month.
Patience is key on Bitcoin, the altcoins need to catch up.
Sometimes, Bitcoin can go sideways for months wile the altcoins grow. Prepare to wait or switch yourself to some mid-sized and small-cap altcoins. The big pairs tend to move like Bitcoin. Each chart needs to be considered individually.
Thanks a lot for your support.
Feel free to leave a comment with your favorite altcoin for an update. I will do an analysis for you in the comments section below.
Namaste.
BTCUSDT
It's an Evacuation Through Green Candles💥 "One Last Leap of Faith?" - What Bitcoin Might Be Hiding Before September
The world’s on fire: Israel, Iran, Strait of Hormuz, oil, elections, the dollar, rates, black swan whispers.
And someone’s out here saying Bitcoin might still go up?
Yes. We are. Not because we believe - but because we see.
📉 Everyone’s afraid. The whales aren’t.
When the crowd goes into survival mode, the real game begins.
Whales aren’t exiting - they’re accumulating.
ETFs aren’t pausing - they’re inflowing.
The technical setup isn’t breaking - it’s compressing like a spring.
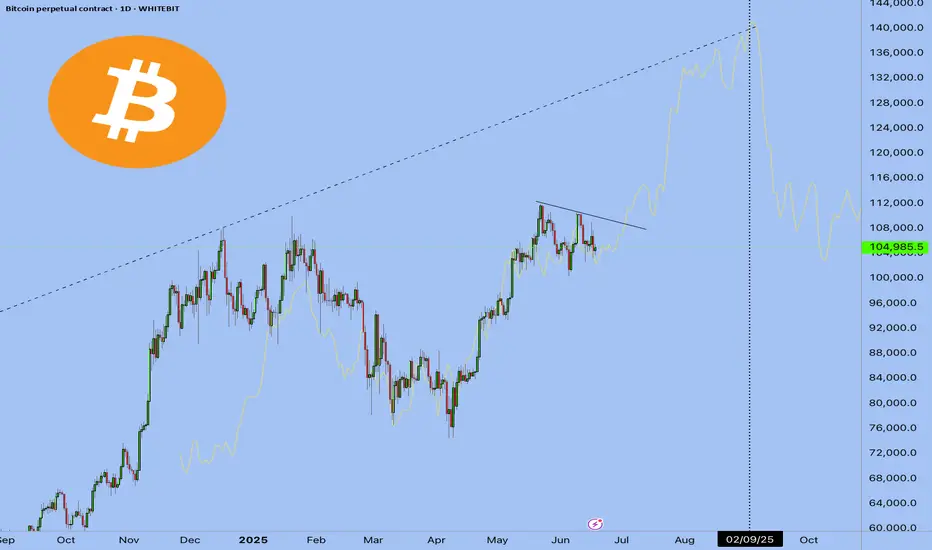
$104,000. Coil building.
If we break out - targets at $132K–$140K are absolutely in play.
👉 But that’s not the point.
The point is why this is happening while the world is burning.
🧠 The idea: Bitcoin isn’t a safe haven. It’s a distribution machine.
Gold is for panic.
Bitcoin is for structure.
Institutions don’t ask “is it scary?” - they ask “where’s liquidity?”
Everything is aligning for one last upside move.
Until September. After that - chaos is back on the table.
💣 The Global Playbook:
Now (Summer) - Consolidation, ETF flows, geopolitical fear - Strategic entries, low exposure
Breakout - FOMO panic, retail rushes in - Profit-taking via options
September–Fall - Macro/geopolitical shock - Already in cash or hedged
📌 Bottom Line
Yes, Bitcoin might pump. Not because the world is fine - but because someone needs to exit beautifully.
If you're reading this - you're early enough to think.
Markets don’t reward justice. They reward positioning.
🛠 What to do right now:
Watch the $104,000 level - it's the pivot
Breakout = final upside push to $132K–140K
Keep your eyes on September - reversal zone
Think in scenarios: entry, exit, protection
Follow EXCAVO - we don’t guess, we read the game
I've been talking about this scenario for a long time
BTCUSD Bullish engulfing
Buy from current price or wait for retest
Bullshlish momentum observed
Mangae risk book partially as metioned or as per your capital
BTCUSDTHello Traders! 👋
What are your thoughts on BITCOIN?
After setting a new all-time high, Bitcoin remains in a corrective phase, marked by sideways price action and choppy movements.
There's a notable gap around the $114,000 level, which may act as a magnet for price during this correction.
The ongoing pullback is likely to extend toward the key support zone, which aligns with the previous breakout level and the bottom of the ascending channel.
Once this support holds, we could see a bullish reversal, targeting the upper boundary of the channel once again.
As long as Bitcoin remains above the marked support zone, the overall structure stays bullish and this correction may present a buy-the-dip opportunity.
Will Bitcoin fill the gap and bounce back toward new highs? Let us know your thoughts! 🤔👇
Don’t forget to like and share your thoughts in the comments! ❤️
BTCUSD Analysis (MMC) : Dual Directional Outlook let's See🔍 1. Overview of Structure & Context:
On the 30-minute timeframe, BTCUSD is consolidating between two strong technical zones:
A descending trendline acting as resistance
A parallel rising support forming a compression zone
This wedge-like formation signals a potential high-impact move in either direction — a dual-directional outlook. Price is currently testing the midpoint between resistance and support, offering two reactive trade scenarios.
🟦 2. Key Zones Highlighted on Chart:
🔹 A. Parallel Support Zone (Dynamic Support):
A grey-shaded rising support has been tested multiple times.
Each bounce suggests buying strength near this diagonal zone.
This zone represents smart money accumulation potential under MMC concepts.
As price approaches this zone again, bulls are expected to step in if momentum aligns.
🔹 B. Descending Resistance Line (Supply Line):
The market is facing lower highs, a sign of bearish control at higher levels.
Each retest of this line has led to a rejection.
This line also acts as a liquidity magnet — price may spike above it to trap buyers before dropping (false breakout potential).
🧭 3. Scenarios and Trade Possibilities (Dual Directional Path):
✅ Scenario 1: Bullish Breakout – (Marked as Path 1)
If BTC breaks above the descending trendline with strong bullish volume, this confirms a structural breakout.
This setup targets:
First level: $119,600
Second level: $120,200
Once broken, the trendline can flip into support.
Ideal confirmation:
Bullish engulfing candle on breakout
Retest of broken resistance turning into support
Volume surge or momentum indicators turning bullish
⚠️ Scenario 2: Bearish Rejection & Breakdown – (Marked as Path 2)
If BTC fails to break resistance and breaks below the parallel support zone, it opens a bearish scenario.
Price may fall back to:
First level: $117,200
Final key support: $116,400 (Major Breakdown Zone)
This is a typical MMC-style mirror move: a structure break leading to liquidity run toward a previous demand zone.
Bearish confirmation:
Close below grey zone
Lower high formation near resistance
Increasing bearish volume / weak bounce
📐 4. Strategy & Trading Tips (MMC Application):
Under the Mirror Market Concepts (MMC), these zones are not just technical levels — they represent emotional price memory of both institutional and retail players.
Wait for the reaction, not prediction.
Use confluence tools (RSI divergence, volume, candle patterns).
Avoid trading inside the wedge — it's a trap zone.
Ideal entries are at breakout with retest confirmation or rejection from major zones.
📊 Risk Management Plan:
Entry Type Trigger Level SL Suggestion TP Range
Long Trade Break & retest above $118.8K Below $118.2K $119.6K → $120.2K
Short Trade Breakdown below $117.8K Above $118.2K $117.2K → $116.4K
🧠 Conclusion:
BTC is in a decision-making zone between a downward pressure line and strong support. A breakout could lead to a clean trend continuation, while a breakdown would trigger bearish momentum. The chart reflects precision MMC logic, offering a tactical map for day traders and scalpers to follow the smart money — not the noise.
Let the market decide direction. We just need to be prepared, not predictive.

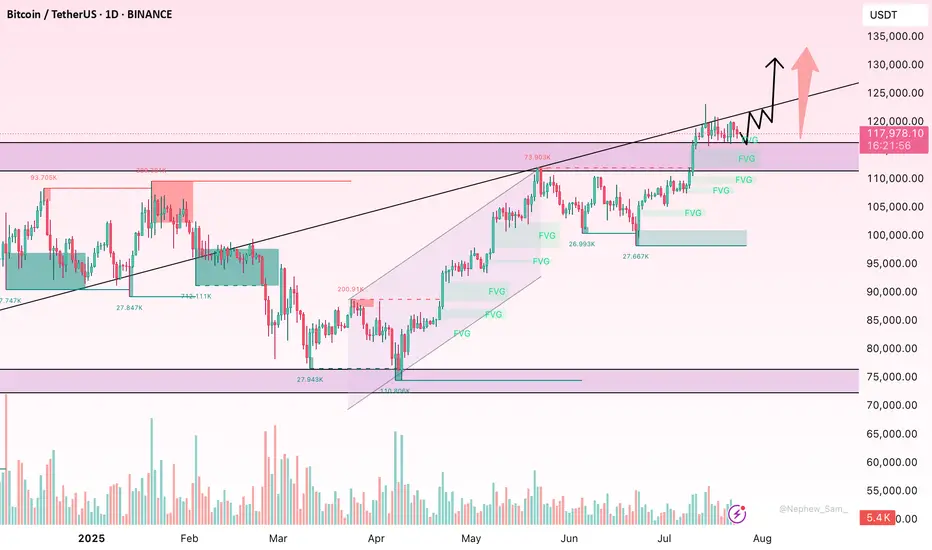
BTCUSDT Forming Bullish WaveBTCUSDT is currently forming a bullish wave pattern, signaling a potential continuation of its upward momentum. This technical setup suggests a series of higher highs and higher lows, indicative of strong buyer demand and consistent market optimism. With volume remaining robust, the foundation for a significant breakout is solid. If the pattern plays out, analysts expect a 09% to 10% gain in the mid to long term, which could be fueled by renewed institutional interest and global adoption.
Bitcoin has historically responded well to bullish wave formations, often leading to aggressive rallies once key resistance levels are breached. As the largest cryptocurrency by market cap, BTCUSDT not only reflects investor sentiment in Bitcoin itself but also often sets the tone for the broader crypto market. The current price action shows consolidation with positive volume spikes, which further supports the bullish thesis and provides a potential launchpad for another major leg upward.
With increasing attention on macroeconomic shifts, regulatory developments, and halving cycles, Bitcoin continues to position itself as a hedge against traditional market uncertainties. The bullish wave pattern now forming could signal that Bitcoin is entering a new phase of growth, especially as global interest in decentralized finance, ETFs, and blockchain innovation surges.
Traders and long-term investors alike should closely monitor this structure. A breakout with volume confirmation could offer an excellent entry point, backed by strong technicals and a solid fundamental backdrop. The combination of a bullish pattern and broader adoption trends makes BTCUSDT one of the most watched assets in the market right now.
✅ Show your support by hitting the like button and
✅ Leaving a comment below! (What is You opinion about this Coin)
Your feedback and engagement keep me inspired to share more insightful market analysis with you!

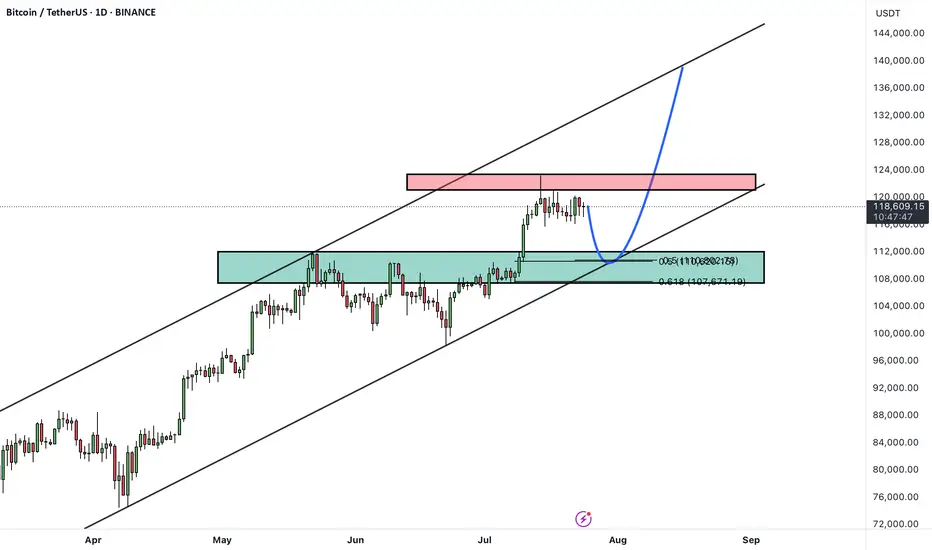
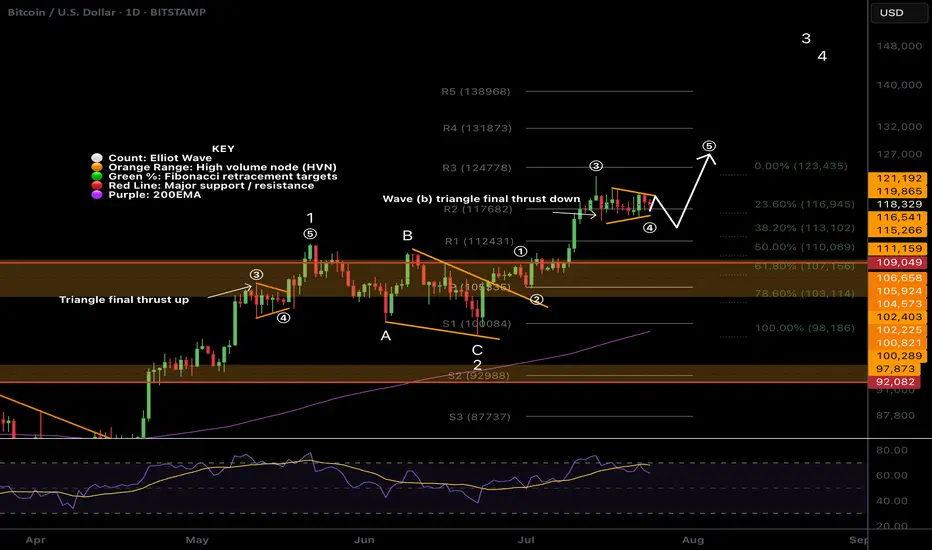
$BTC Wave (b) triangle?CRYPTOCAP:BTC Bitcoin appears to have competed wave 3 up, wave (a) down and now finishing a triangle in wave (b) which would result in a thrust down to around $113k before continuing to the upside in wave (5).
There is slight bullish divergence on daily RSI and wave (4) meets the Fibonacci retracement rules of between 0.236 - 0.382 adding confluence.
Previous all time high is expected to be tested as support on a larger correction, perhaps when the ascending daily 200EMA creeps up to the same level after we blow off.
Safe trading
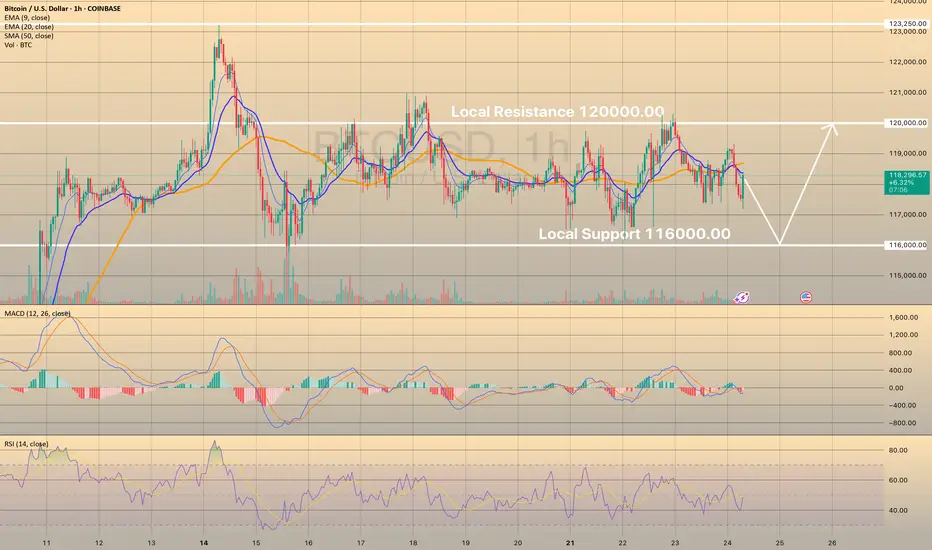
BTCUSD LOST SHORT-TERM BULLISH POTENTIALBTCUSD LOST SHORT-TERM BULLISH POTENTIAL
Bitcoin has been trading sideways since July 15th within a range of 116,000.00-120,000.00. Indicators show no signs of a new bullish/bearish trend.
How to trade sideways movements or range?
It is better to wait for a price to come close to one of the levels (support or resistance), then open buy/sell order. Or just pace a limit order and wait. Take-profit may be above/below the support/resistance levels with a stop-loss behind these levels (below for the support and above for the resistance).
So, the price decline towards 116,000.00 is expected, where potentially the price may rebound once again.
SPKUSDT Forming Falling WedgeSPKUSDT is currently forming a falling wedge pattern on the chart, a classic bullish reversal formation that often precedes a strong upward move. The narrowing of the wedge, combined with consistent price compression and steady volume, indicates that the asset is nearing a breakout point. Traders and technical analysts recognize this structure as a sign that selling pressure is losing strength, paving the way for a potential surge. The projected target aligns with a potential gain of 90% to 100%+, making SPKUSDT a high-reward opportunity for short- to mid-term crypto investors.
The falling wedge pattern typically signifies the end of a downtrend and the beginning of a new bullish cycle. As price action converges within the wedge, momentum often shifts once a breakout occurs to the upside with a strong volume spike. SPKUSDT has been building a solid base, and the market seems to be preparing for a shift in direction. Key resistance levels will need to be monitored, but the technical setup favors a bullish breakout in the near future.
What makes SPKUSDT even more compelling is the growing interest among retail and meme-focused investors. This token is beginning to gain traction across social platforms and trading circles, signaling increased demand and enthusiasm. With a supportive technical pattern and improving sentiment, this project may soon attract even more speculative momentum.
Given the current chart structure and favorable market signals, SPKUSDT is positioned as a breakout candidate worth watching. A confirmed wedge breakout could act as the catalyst for a major upside move, providing traders with strong potential returns.
✅ Show your support by hitting the like button and
✅ Leaving a comment below! (What is You opinion about this Coin)
Your feedback and engagement keep me inspired to share more insightful market analysis with you!

BTC Consolidates Below Key Resistance – Is a Breakout Imminent?Bitcoin is currently consolidating beneath the major psychological resistance near $120,000. The medium-term trend remains bullish, supported by a series of higher highs and higher lows. However, recent candlesticks with long upper wicks reflect hesitation among buyers at elevated levels, pointing to potential exhaustion in short-term momentum.
Despite this, there are no clear signs of bearish divergence or strong reversal patterns. The sideways range between $112,000–$120,000 likely represents a healthy consolidation phase after a strong rally. If the price maintains support around $113,000 and breaks above $120,000 with convincing volume, the next leg higher could follow swiftly.
For now, buyers remain in control, provided BTC holds key structural supports. A breakout confirmation is crucial for bullish continuation.
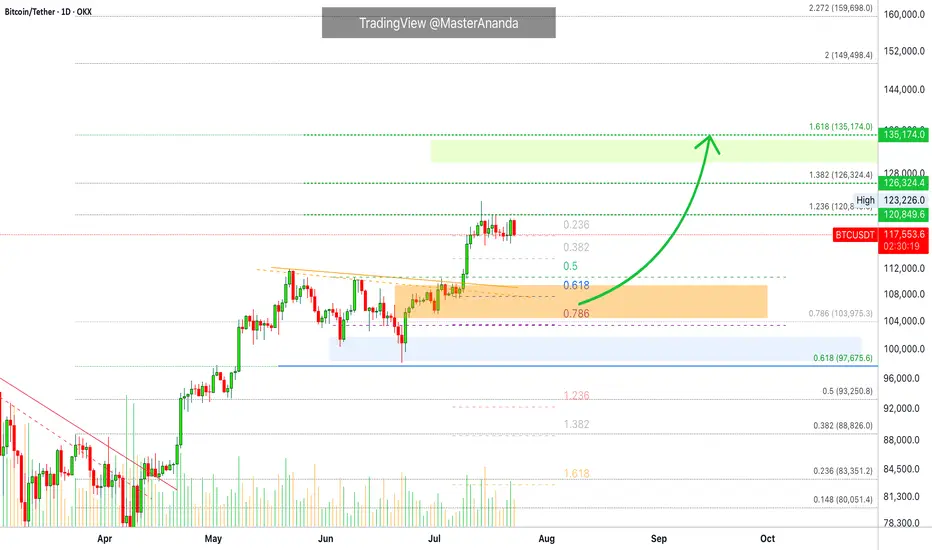
Bitcoin · $137,000 Next Target Followed by $155,000There won't be a correction for Bitcoin. Not now, not yet. The reasons why I already explained in several earlier publications that predicted the current scenario. The bullish breakout that is from the long-term consolidation range. That's the reason, that's the reason why Bitcoin will not go lower without first going higher.
Since Bitcoin consolidated for 7 months below $110,000, it will continue climbing until it reaches higher.
The next target is $137,000. At this point a correction can develop and if it does, we don't expect this correction to last long. The correction can be strong, deep, surprising, but it cannot be long in duration. That is because Bitcoin is headed toward $155,000 and that's the main level for this bullish wave. Until this target is achieved, nothing can stop the future of finance, Bitcoin is moving ahead.
The proof is in the altcoins market. "The altcoins follow Bitcoin." In the current situation, Bitcoin is consolidating while the altcoins grow. If Bitcoin were to crash, the altcoins wouldn't move one dollar higher. In fact, they would be crashing even stronger and faster.
Bitcoin would need to just falter for one day for the altcoins to crash to new lows. What is happening now? Bitcoin can shake; Bitcoin drops; Bitcoin consolidates, and the altcoins continue to grow. That's the proof that the next main—major—move is an advance for Bitcoin. Never SHORT Bitcoin when the market is bullish and strong.
Bitcoin is a growing phenomenon, it is very young. Just think of the US Dollar or Gold. How old are these instruments? How old are market securities and stocks? Some corporations are hundreds of years old. Countries? Thousands of years and still living... Bitcoin can have a life span of 80 years, 140 years, 200 years, 500... who knows. It is a question market. But there is no doubt that it is young. When you are young, you cannot stop your own growth. Bitcoin is already growing and will continue to do so. I will not be surprised when I see Bitcoin trading at $1,000,000+. It might take several years, but several years back Bitcoin was trading at $5k. What's the price now?
$120,000. Trading near resistance is bullish. No corrections. No drops. No retrace.
Thank you for reading.
Namaste.

BTCUSDT pauses before the next big moveAfter a strong breakout in early July, BTCUSDT is now consolidating within a clear range between 116,000 and 120,000 USD. The price has repeatedly bounced from the bottom and faced rejection at the top, forming a well-defined sideways pattern on the H4 chart.
The EMA34 and EMA89 are providing solid support to this accumulation phase. If the 116,000 support zone holds and volume confirms, Bitcoin could resume its previous uptrend and aim for the 124,000 level.
At the moment, this looks like a “breather” zone before the market picks its next direction.
Personally, I’m still expecting another bullish leg—how about you?

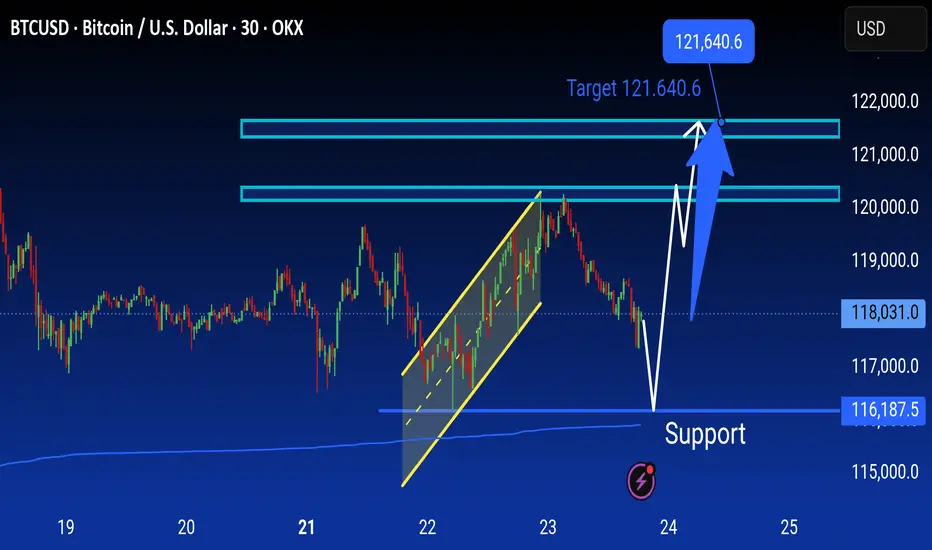
BTCUSD Analysis is Ready BTC/USD 30-min chart shows a potential bounce from the support zone around 116,187.5, aiming for a bullish move toward the target at 121,640.6. Price may retrace before pushing upward.
Look First, Then LeapIn trading, how you prepare matters more than how you react. The phrase “Look first, then leap” reminds traders to avoid impulsive decisions and instead focus on proper analysis, planning, and risk control. Whether you're trading stocks, forex, crypto, or commodities, this principle can save you from painful losses and build a foundation for long-term success.
Let’s break down what it really means to “look first,” and how applying this mindset can improve your trading discipline.
✅Preparation Beats Emotion
Before entering any trade, a trader should ask: What is this trade based on? Logic or emotion?
🔹 Control Impulsive Decisions
Most losing trades happen when people act on gut feelings, FOMO, or after seeing a sudden price spike. But excitement is not a strategy; analysis is.
🔹 Check the Basics First
-What is the market trend? (uptrend, downtrend, or sideways?)
-Are you trading with or against the trend?
-Are there any upcoming news events that might impact the market?
Taking a moment to “look first” gives clarity and filters out low-probability trades.
✅ Trade Only When There’s a Setup
The best trades often come from waiting for the right moment, not forcing entries.
🔹 Identify Clear Patterns
Before jumping in, confirm your strategy setup:
-Is it a breakout or a fakeout?
-Are key support/resistance levels respected?
-Is volume supporting the move?
🔹 Use Confirmation Tools
Indicators like RSI, MACD, and moving averages can support your decision. Price action and patterns like triangle, channel, and flag also provide valuable clues.
Look first means not reacting to the first move; wait for the follow-through.
✅ Always Define Risk and Reward
Entering a trade without a defined stop-loss or target is like jumping into water without checking its depth.
🔹 Use a Risk-Reward Ratio
Before leaping into a trade, ask yourself:
-What am I risking?
-What can I gain?
Aim for a minimum risk-reward ratio of 1:2 or 1:3 to stay profitable even with a lower win rate.
🔹 Position Sizing Matters
Know how much of your capital to allocate. Using 1-2% of your capital per trade helps manage losses and avoid emotional pressure.
✅ Adjust for Market Conditions
Just because you’ve seen success in one type of market doesn’t mean your strategy will always work.
🔹 Trending vs. Ranging Markets
-Trend-following strategies work well in strong trends.
-Mean-reversion or breakout-fade strategies work better in sideways markets.
🔹 Check for Major News or Events
Earnings reports, central bank meetings, or geopolitical events can change everything in seconds. Before entering a trade, look at the calendar.
Adapting to market conditions is part of looking first.
✅ Use a Trading Plan, Not Just a Feeling
Every trade should follow a plan, not just “I think this will go up.”
🔹 What Should Your Plan Include?
Entry and exit rules
-Stop-loss and take-profit levels
-Criteria for valid setups
-Timeframes and trading hours
A plan brings structure and consistency, reducing emotional decisions.
✅ Journaling and Reviewing Trades
Looking first also means learning from the past.
🔹 Keep a Trading Journal
Log every trade entry, exit, reason, emotion, and outcome. This helps you spot mistakes and patterns in your behavior.
🔹 Review Regularly
After a drawdown or losing streak, review your last 10–20 trades. Was your strategy sound? Were you disciplined? Did you look before you leaped?
Improvement comes from reflection and correction.
✅ Be Mentally Ready Before Every Trade
Looking first also means checking your internal state.
🔹 Ask Yourself Before Trading:
-Am I calm and focused?
-Am I trying to recover a loss?
-Am I trading because I’m bored or emotional?
If your mindset is off, step away. A bad state leads to bad decisions—even with a good strategy.
✅Backtest and Practice Before Going Live
Before risking real money, test your setup thoroughly.
🔹 Why Backtesting Helps
It lets you see how your system performs on historical data. This builds confidence and filters out weak strategies.
🔹 Demo Trading Is Smart, Not Weak
Trading in a demo account before going live helps you learn execution, order management, and emotional control—without financial damage.
✅ Protect Capital First, Trade Second
Your first goal isn’t to make money, it’s to stay in the game.
🔹 Survive First, Then Thrive
Big losses can take weeks or months to recover. That’s why looking first is critical—it prevents careless trades that damage your capital.
✅Final Word: Be the Trader Who Waits
The market rewards those who are patient, disciplined, and prepared. Anyone can open a trade, but only those who look first truly understand what they’re doing.
Before your next trade, ask yourself:
“Do I have a clear reason, a defined risk, and the right mindset? Or am I just reacting?”
Because in trading, it’s not how many trades you take, it’s how many good trades you wait for.
In trading, success doesn't come from speed; it comes from clarity, preparation, and discipline. The principle “Look first, then leap” serves as a constant reminder to slow down, observe, analyze, and plan before taking action. It’s a mindset that separates the disciplined trader from the emotional speculator.
Every trade you take should be backed by logic, not impulse. Whether it’s identifying the right setup, managing your risk, or simply being patient enough to wait for confirmation, looking first gives you control in a world that thrives on chaos.
In the end, trading isn’t about making quick money—it’s about making the right decisions consistently. So before your next trade, take a breath, do your research, and ask yourself:
“Am I truly ready to leap, or do I need to look one more time?”
That one extra moment of reflection could be the difference between a lesson and a profit.
Cheers
Hexa🧘♀️
Chart Image Credit: TradingView

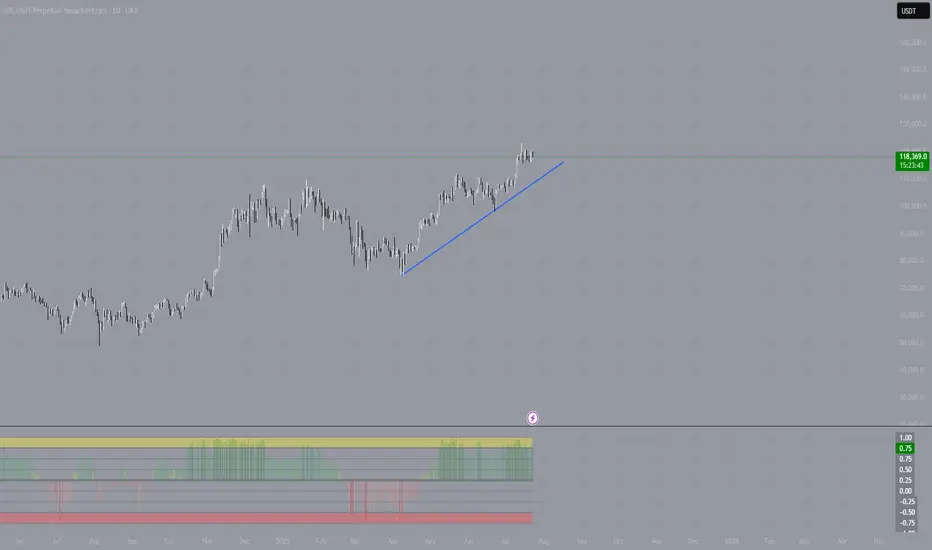
Bitcoin is OverheatedI’m observing the current situation in the BTC market and want to share a brief reflection. The latest upward impulse doesn’t just look confident—it’s starting to resemble overheating.
The price has detached from its averages, and the movement is accompanied by local euphoria. I see the community piling in “at the highs,” hoping for continuation. But it’s crucial to understand: markets don’t grow forever. Especially when the growth lacks proportional volume and fundamental support.
I use a comprehensive technical approach, and one of my indicators has given a clear signal—the market is overheated. We’re currently seeing a classic state of overbought conditions: the price is moving too far, too fast.
This doesn’t mean you should immediately short or panic. But as a trader, I understand that in such a phase, it’s wiser to:
– Partially take profits,
– Move stops closer to the market,
– And absolutely avoid entering new longs on emotions.
Typically, after such surges, the market either consolidates or corrects by 10–20% to shake off the overheating and provide an opportunity to enter at fairer levels. Personally, I’m waiting for a return to balance and a reset. I don’t rule out a final “explosive” move upward on news, but such breakouts usually end as quickly as they begin.
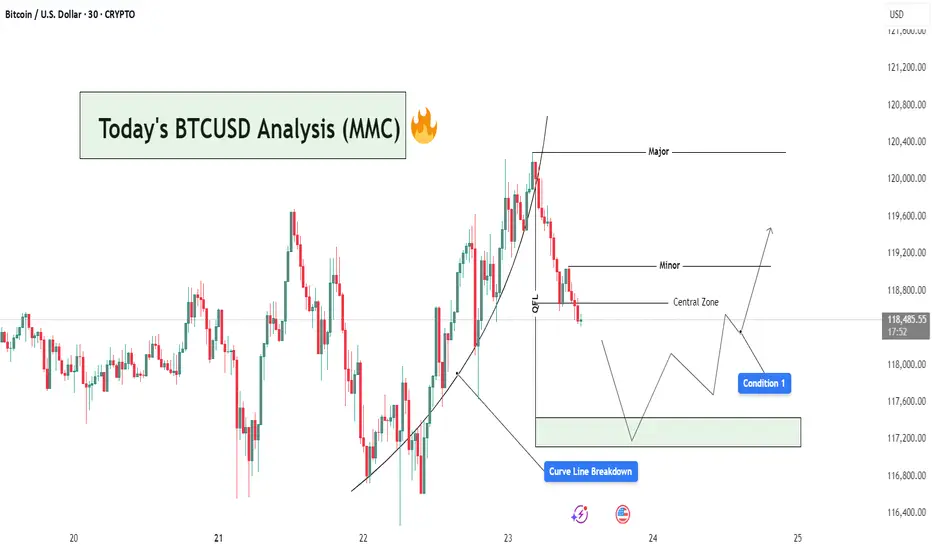
BTCUSD Analysis : Curve Line Breaked and Move Towards Target📊 Market Overview:
BTCUSD has recently completed a strong bullish leg, following a parabolic curve formation that led price into a Major Resistance Zone near the $120,400 level. This rally aligns with MMC principles where price forms momentum-driven structures before reaching high-liquidity zones (often ending in exhaustion).
📍 1. Curve Line Support & Breakdown – A Shift in Sentiment
Your chart shows a clear Curve Line that supported the bullish impulse. Price respected this dynamic support throughout the uptrend until a Curve Line Breakdown occurred—marking the first sign of bullish weakness.
In MMC strategy, this curve structure breakdown is critical:
It tells us the accumulation → expansion → exhaustion cycle is ending.
The market is likely entering retracement or distribution phase.
Price often seeks lower equilibrium, typically around the Central Zone.
🧠 2. QFL Zone (Quick Flip Level) – The Hidden Base
Immediately after the curve broke, price moved toward the QFL level, which represents a demand base from earlier structure. This zone acts as a short-term support and often produces a reactive bounce (but not always a reversal).
Watch closely:
If price respects this zone → temporary relief bounce
If it fails → we’ll likely see full test of Central Zone or lower demand levels
🟩 3. Central Zone – The MMC Decision Area
The Central Zone is a key horizontal level on your chart, defined between ~$117,300 and ~$118,200. This zone is marked based on:
Previous structure
Volume clusters
Demand imbalance
Why is this zone important?
It serves as the balance point between buyers and sellers.
A bullish reaction here could re-initiate a move toward Minor Resistance (~$119,200).
A failure to hold could open the door for deeper retracement toward the green demand box (~$117,200 or below).
🔄 4. Two Primary MMC-Based Conditions to Watch:
✅ Condition 1: Bounce from Central Zone
Price reacts from within the Central Zone
Forms bullish structure (double bottom, bullish engulfing, or reversal wick)
Short-term target becomes Minor Resistance (~$119,200)
If volume increases and price breaks above Minor, continuation toward Major is possible
❌ Condition 2: Breakdown & Bearish Continuation
Price fails to hold within Central Zone
Bearish structure forms (e.g. lower highs, breakdown candles)
Clean move expected toward next liquidity pocket at $117,200–$116,800
This would confirm market shifting into bearish control
📌 5. Minor vs Major Levels – Key Zones
Minor Resistance (~$119,200): Short-term target if bounce occurs
Major Resistance (~$120,400): Liquidity sweep zone, strong supply
Green Demand Box (~$117,200): If Central Zone fails, this becomes next bounce zone
📘 Final Thoughts:
This is a classic MMC setup in real-time:
Curve Formed → Broke
OFL + Central Zone → Now being tested
Next move depends on confirmation from buyers or sellers at Central Zone
Don’t trade emotionally — let price action give you confirmation before taking any positions. Watch the Central Zone behavior closely and manage risk based on scenario outcomes.
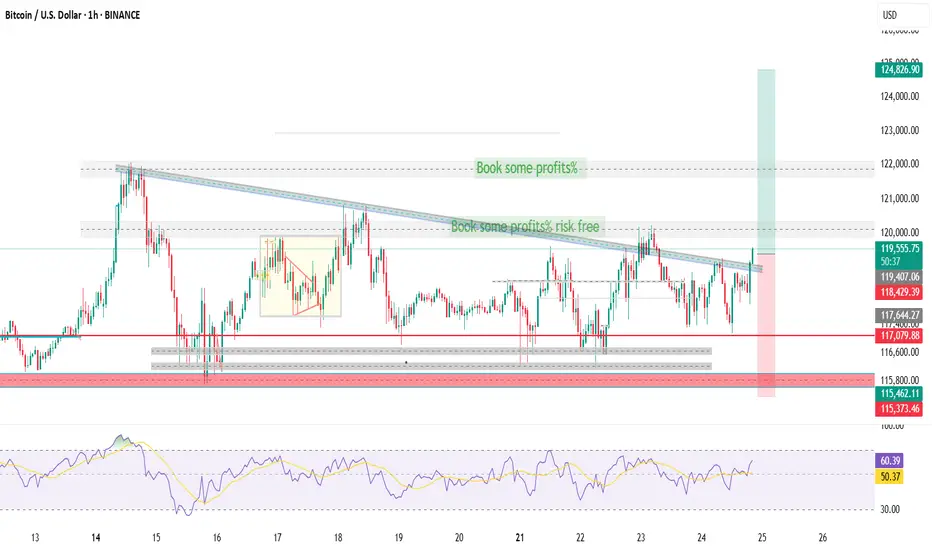
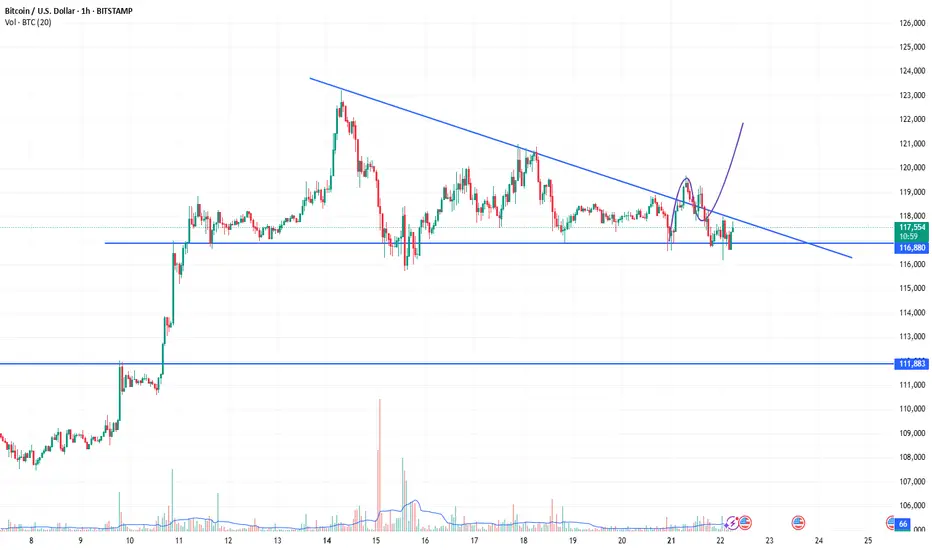
BTC/USDT – 2H Chart Update!!BTC/USDT – 2H Chart Update
Breakout Confirmed:
BTC has broken above the descending trendline but is currently facing resistance at around $ 119,500.
Support Zone:
Strong ascending support between $ 117,000 and $ 118,000 remains intact.
Moving Average:
Price is currently testing the 2H MA (~$118.3). Holding above this could confirm bullish continuation.
Outlook:
If BTC holds above $ 118,000, a move toward $ 123,000–$ 125,000 is likely.
Failure to hold may retest $117K support.
Bias: Short-term bullish unless price breaks below ascending trendline.
Thanks for your support!
DYOR. NFA

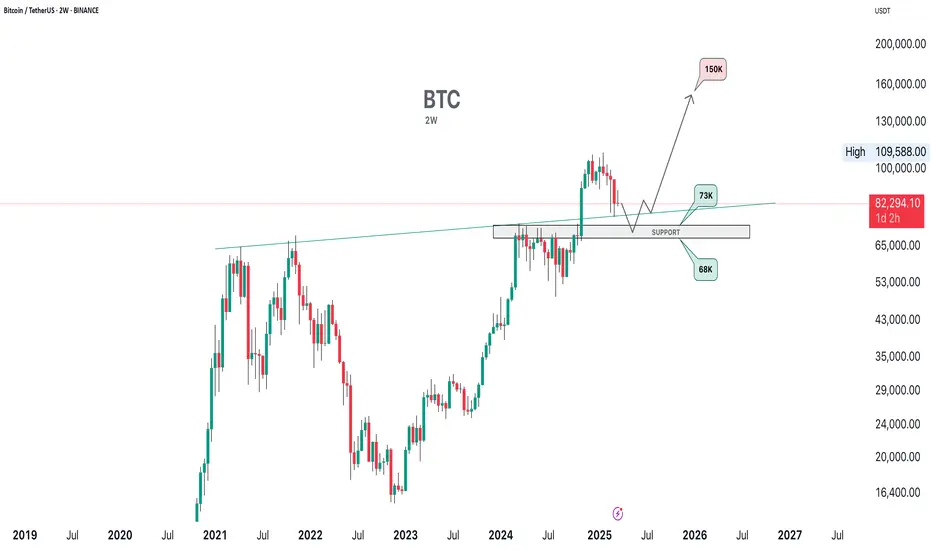
BTC - A POSSIBLE SCENARIO (MARCH 2025)BTC - A POSSIBLE SCENARIO (MARCH 2025)
BTC is still showing weakness. Overall, I remain bullish, but it may dip to $68K–$73K.
Alts are a real bargain now in March 2025. They won’t stay like this forever—soon, they’ll surprise everyone. But obviously they are extremely risky assets.
BTCUSDBUY Call retest must
Quick trade setup 30min
Risk free your trade once reach point metioned
Looks bullish move

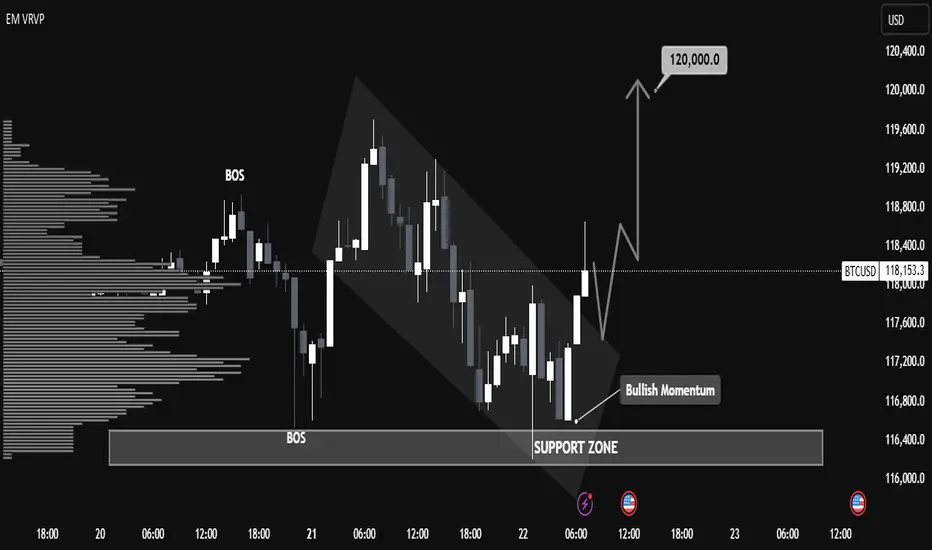
"BTC/USD Breakout Strategy: Identifying Bullish Momentum BTC/USD Technical Analysis – July 22, 2025
📈 Market Structure Overview:
The chart illustrates a recent Break of Structure (BOS) both to the upside and downside, indicating volatility and a shift in market sentiment. The price action formed a descending channel, followed by a breakout with strong bullish candles, suggesting a momentum reversal.
🧱 Support Zone (Demand Area):
Key Level: $116,400 – $116,900
This zone has acted as a strong demand level, with clear evidence of buying pressure pushing BTC higher after testing this area. The volume profile (VRVP) supports this, showing heightened trading activity at this price.
🔄 Bullish Breakout Confirmation:
A bullish breakout from the descending channel occurred just above the support zone, aligning with the label "Bullish Momentum".
The breakout candle has closed above minor resistance, which increases the probability of a trend reversal.
📍 Price Target:
The projection points toward $120,000, aligning with previous resistance and psychological round-number resistance.
This target is highlighted by an expected bullish leg after a possible retest of the breakout zone around $117,500 – $117,800.
🧭 Key Levels to Watch:
Support: $116,400 – $116,900
Retest Zone (Buy Opportunity): $117,500 – $117,800
Immediate Resistance: $118,400
Major Resistance / Target: $120,000
📊 Summary:
BTC/USD has shown a bullish reversal signal from a well-respected support zone after a descending correction phase. The current price structure, volume buildup, and breakout momentum suggest a high probability of continued upside movement toward the $120,000 mark. A successful retest of the breakout zone would provide a strategic entry for long positions with tight risk management.
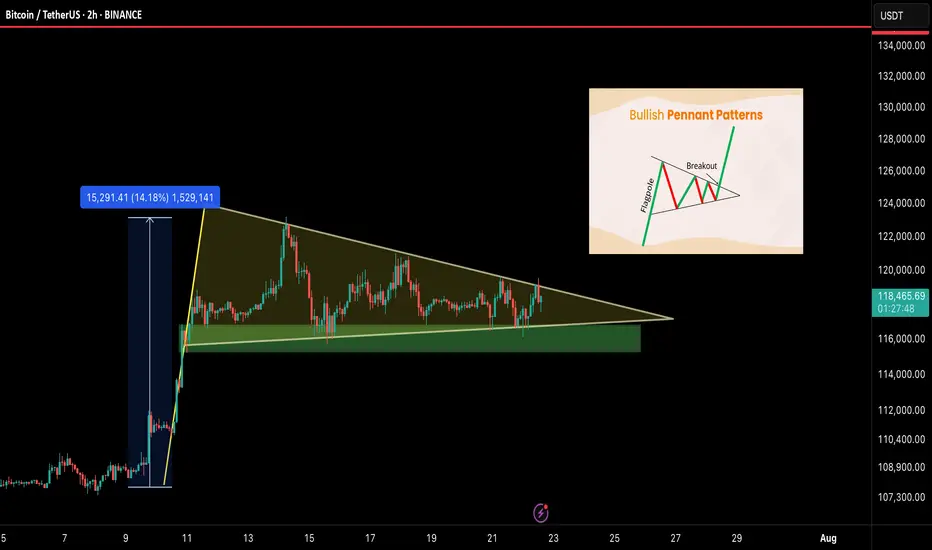
BTC/USDT – Bullish Pennant Setting Up for the Next Leg!Bitcoin is currently forming a bullish pennant — a classic continuation pattern — right after a strong 14% impulse move. This type of structure often leads to a breakout followed by another powerful rally. And it’s coiling up nicely.
🧠 Technical Breakdown:
🟢 Bullish pennant formation in progress
🔽 Support zone: $115.5K – $116.5K
📏 Flagpole projection targets $135K+ on breakout
⚠️ Currently consolidating with lower volatility — breakout could be near
🔍 What to Watch For:
Clean breakout above pennant = breakout confirmation
Daily close below $115K = invalidation zone
Volume spike will likely signal the next move
📢 Final Take:
BTC is showing healthy consolidation after a strong move, and this pennant could launch us toward $135K and beyond. Keep your eyes on the breakout and manage risk wisely.
💬 Share your thoughts below & smash that ❤️ if you’re watching this move!
Btcusd:Huge trading opportunities and ideasBTCUSD's rebound after touching the position near 116180 this time is fast. From the trend observation. BTCUSD is still in a high consolidation stage. It has not broken the oscillation range for the time being. It can maintain selling near 120k. Buying near 11600 for range trading. It is expected that there will not be many trading opportunities in the London market. It will take until the New York market opens to see better trading opportunities.
Bitcoin Ready for the Next Leg Higher!Bitcoin is currently consolidating within a symmetrical triangle on the 4-hour timeframe, showing signs of a potential breakout. After a strong rally earlier in July, BTC has entered a compression phase, forming lower highs and higher lows — a classic setup for a volatility breakout.
Price is moving near the apex of the triangle, suggesting that a decisive move is imminent. The 50 EMA and 100 EMA are both acting as dynamic support, helping bulls maintain control of the structure. A breakout above the descending trendline could initiate a sharp move toward the $130K–$133K target zone.
Cheers
Hexa
BINANCE:BTCUSDT
