BTC Weekly Recap & Outlook 20/07/2025📈 BTC Weekly Recap & Outlook
Market Context:
Price continued its bullish momentum, fueled by institutional demand and supportive U.S. policy outlook.
We captured solid profits by following the game plan I shared earlier (see linked chart below).
🔍 Technical Analysis
✅ BTC made a strong bullish move, breaking into new all-time highs.
📊 The daily RSI entered overbought territory, which signaled the potential for a short-term retracement or consolidation.
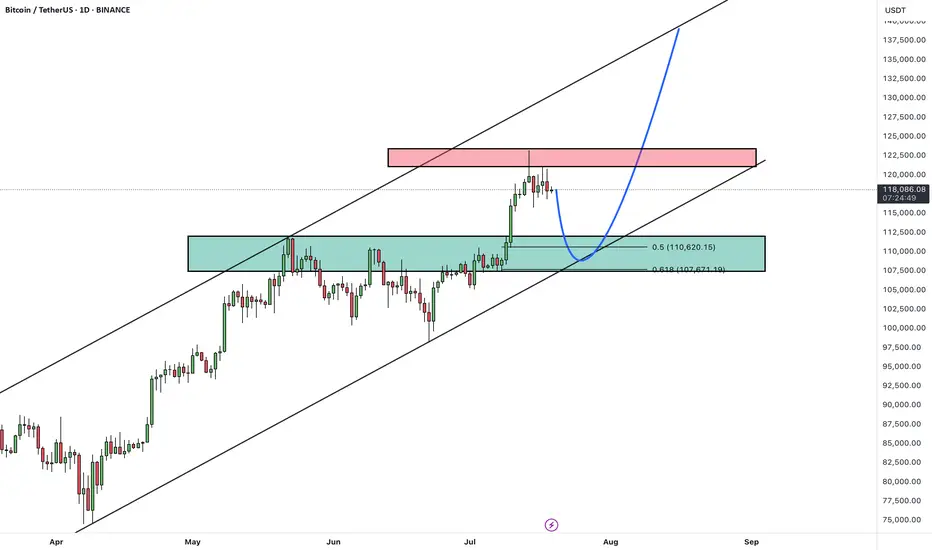
Currently, price is ranging, and RSI is cooling off. That tells me the market is likely building energy for the next leg up — but not before a significant liquidity run.
🎯 Game Plan
I'm watching for one of two potential setups:
1️⃣ Liquidity Sweep to the Downside
- A run of the daily swing low
- Into the most discounted range (0.75 Fib zone)
OR
2️⃣ Tap into the Weekly FVG Zone (marked with the purple line)
Either move would create the liquidity and energy needed to fuel a breakout above the equal highs (EQHs) marked by the black line.
🚀 Target
First Target: EQHs (Black Line)
Second Target: Price Discovery (new ATHs)
💬 Let me know your thoughts or drop your own chart ideas below!
📌 Follow for Weekly Recaps & Game Plans
If you found this useful, make sure to follow for weekly BTC updates, market outlooks, and detailed trade plans based on structure and liquidity.
BTCUSDT

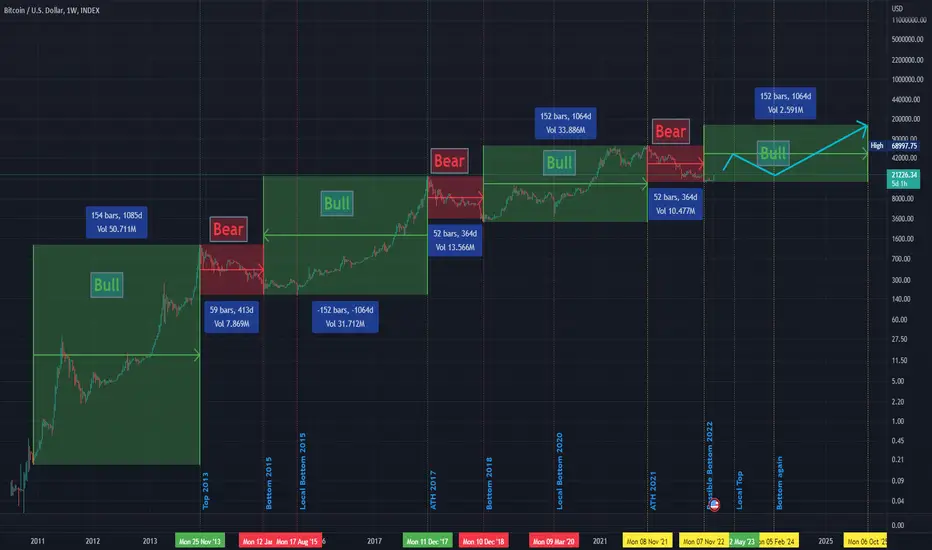
BTC Bull & Bear historical Periods 3 Bull & Bear Markets
Bull markets took around 152 weeks...
then
V
v
v
v
v
Bear Markets took around 52-59 weeks..
then
v
v
v
v
v
v
v
Bull Market gain...
----------------------------------------------------------------------------------------------------------
After 2021 ATH
BTC recorded his current bottom after 52 weeks ( 15500 $).
BTC pumped after 59 weeks .
then what ?
Will the history will repeat itself again ??
if we will be alive inshallah ,we will see the next 152 weeks to ( October - November 2025 ) if this will be the New ATH of the next bull market or not :D
It is not a financial advice , PLZ DYOR
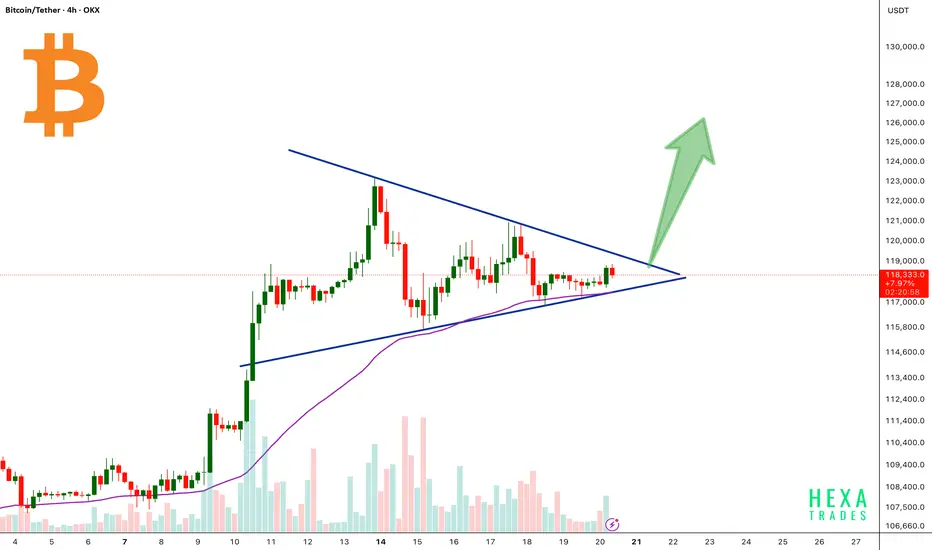
BTC Forming Bullish Triangle!Bitcoin is currently consolidating inside a symmetrical triangle pattern after a strong bullish rally. The price is approaching the apex of the triangle, signaling a potential breakout soon.
The 50 EMA is acting as dynamic support, perfectly aligned with the triangle’s lower trendline, reinforcing the bullish structure.
A confirmed breakout above the triangle resistance could trigger a strong upward move, with a potential target near the $125,000–$130,000 zone.
Cheers
Hexa
BINANCE:BTCUSDT CRYPTOCAP:BTC
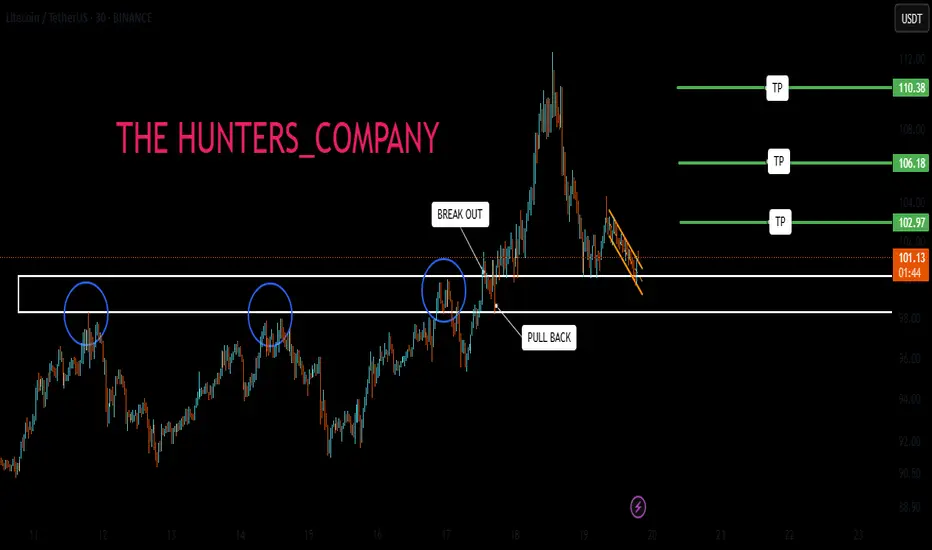
LITCOIN BUY OR SELL !!!Hello friends🙌
🔊According to the price drop, you can see that the price has been below the specified resistance for a while and when it was able to break the resistance, it shows us the power of the buyers. Now, when we return to the previous resistance, which has now become a support, you can see that the buyers are providing good support and the price is expected to move to the specified targets.
Note that the most important rule in trading is capital and risk management So make sure to follow it.
🔥Follow us for more signals🔥
*Trade safely with us*
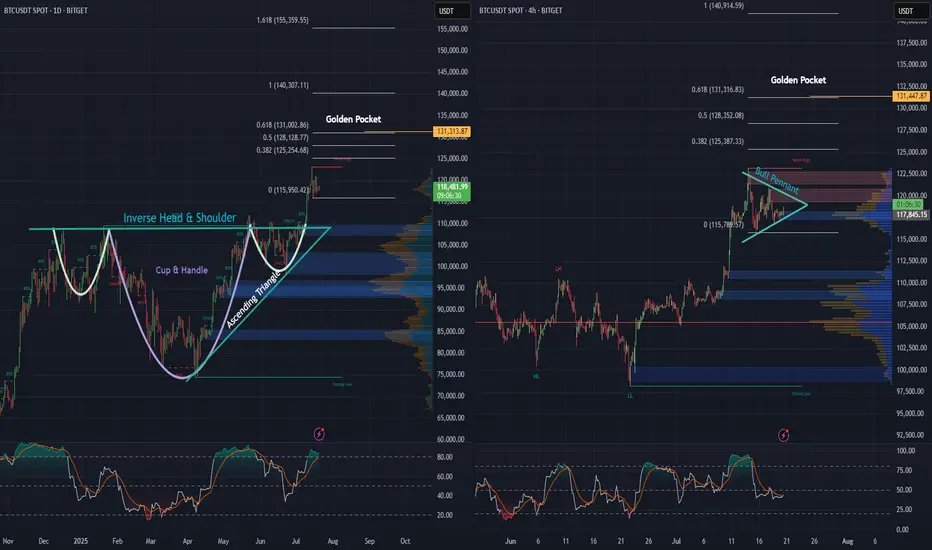
BTC daily, and 4 hr. Bullish Patterns Stack Up!Looking at the Daily and 4-hour charts for BTC, we can see multiple bullish formations unfolding.
An inverse head and shoulders - daily
A cup and handle - daily
An ascending triangle - daily
Price action looks strong, as we’ve begun the breakout from the neckline on the inverse H&S, as well as the cup and handle and ascending triangle simultaneously, and momentum is building fast.
Also, on the 4-hour chart, there’s a pretty substantial bull pennant taking shape. A breakout here could be the next leg up, and the push needed to keep momentum alive.
Zooming out, when we apply the trend-based Fibonacci extension, it reveals a $131,000 golden pocket, on both the the daily as well as the 4 hr. And that could be a major upside target if these bullish structures hold.
Stay tuned to see if BTC continues its move and sets a new all-time high.
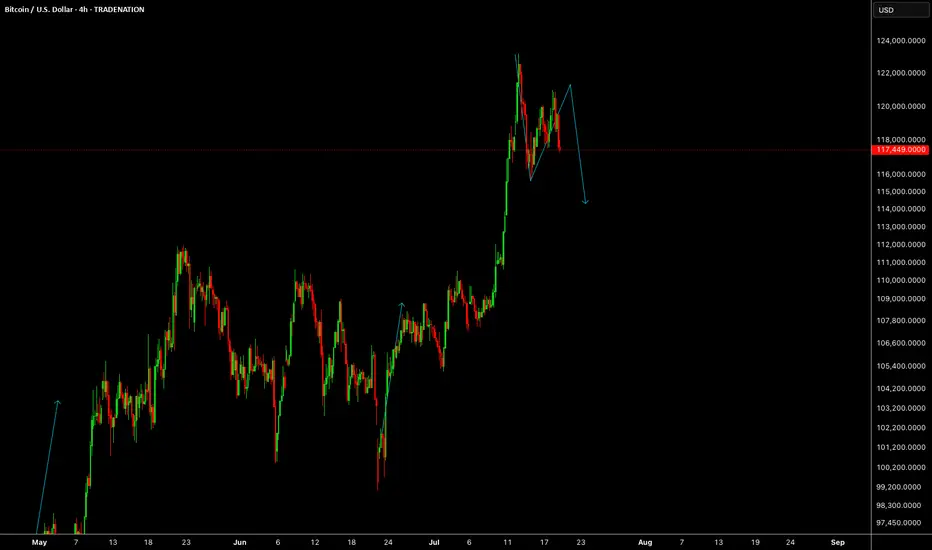
BTCUSDBTCUSD needs some more correction before we continue the same trend.
Disclosure: We are part of Trade Nation's Influencer program and receive a monthly fee for using their TradingView charts in our analysis.
BTC Analysis (2H)Bitcoin is currently consolidating within a symmetrical triangle, suggesting indecision in the market. However, a breakout is imminent — and when it comes, it will likely be sharp.
🔹 Bullish Scenario:
A breakout above $120K would likely lead to a new All-Time High near $124K.
🔹 Bearish Scenario:
A breakdown below $116,400 opens the door for a quick drop toward the $112K–$110K zone, which should be considered a buy opportunity.
⚠️ Pro Tip:
There’s a volume imbalance just below the $116.4K level. If price breaks below it, the move down may be faster and more aggressive than expected — so plan accordingly.
Regardless of short-term volatility, the macro trend remains bullish, and Bitcoin will rise again.
Thanks for reading.

Entering Green Markets or Getting Close to Liquidation?They told you it’s a green market, time to buy... but something’s off.
Most major losses begin with a green candle, not a red one!
Before jumping in, ask yourself: why does everything suddenly look so clear?
Hello✌
Spend 3 minutes ⏰ reading this educational material.
🎯 Analytical Insight on Bitcoin:
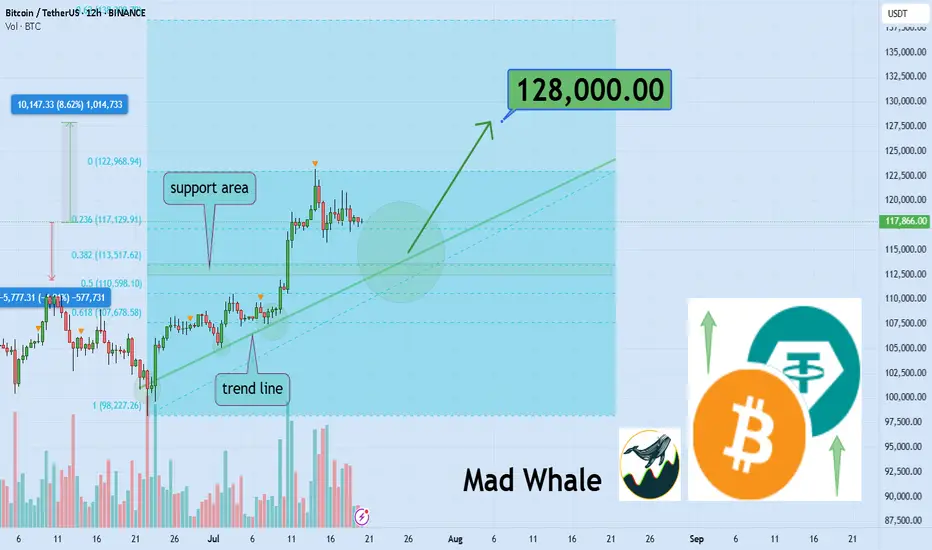
Strong volume confirming daily trendline and Fibonacci support signals a potential 8% upside, with a key target near $128,000 📈. This confluence could offer a solid entry opportunity for BINANCE:BTCUSDT traders 🧭.
Now , let's dive into the educational section,
📉 Green Doesn’t Always Mean Safe
Many traders jump into green candles, feeling they’re missing out. But most pumps end where excitement begins. The market isn’t always bullish it’s often just using collective emotion against you.
🧠 They’re Targeting Your Mind, Not Just Your Capital
Whales don’t need your money they need your mind first. The moment you think you're "too late" and must enter now, is often when they’re selling.
💡 You’re Fueling Their Profits, Not Your Trade
Those who bought early are waiting for someone like you. If you enter now, you're not beating the market you’re just helping others close in profit.
🔍 Why Most Liquidations Happen After Green Moves
Contrary to belief, major liquidations often come after green runs. That’s when confidence is high, stops are forgotten, and greed kicks in perfect timing for a rug-pull.
📊 History Doesn’t Repeat It Rhymes (Loudly)
Go back and look at Bitcoin’s chart since 2017. Nearly every major drop followed a smooth-looking pump. It’s not a warning. It’s a recurring pattern.
🎯 Hidden TradingView Tools for Spotting Green Traps
The market looks bullish. But the truth is, many pumps are just emotional traps built to bait late entries. TradingView has tools that, if used right, help you spot these traps before you step into them:
✅ Volume Profile (Fixed Range):
Use this to identify where the most trading volume occurred. If price rises on weak volume, be suspicious. It could be a fakeout or engineered pump by whales.
✅ RSI + Manual Divergence Drawing:
RSI seems simple, but traps often hide when RSI climbs while price action lags. TradingView allows manual drawing spot bearish divergence before the fall.
✅ On-Balance Volume (OBV):
If price is rising and OBV is flat or falling, warning lights should flash. A rally without money inflow is often a visual illusion.
✅ Session Volume HD (from Public Library):
See when most liquidity enters. Many fake bullish moves happen during the Asia session when volume is low and price is easier to manipulate.
✅ Multi-Timeframe Analysis:
If you're looking at the 15-min chart while the 4-hour sits in resistance, you may just be playing into a bull trap. Cross-reference your timeframes.
🧭 How to Avoid the Green Traps
Watch volume, not just candle color
Wait for level confirmations, not hype
Use TradingView’s combo indicators
Always ask: who profits if I enter right now?
✅ Final Thoughts
Not every green candle is hope sometimes it’s bait. The market is after your emotions, not your charts. Step back, zoom out, and use the right tools before you act.
✨ Need a little love!
We pour love into every post your support keeps us inspired! 💛 Don’t be shy, we’d love to hear from you on comments. Big thanks , Mad Whale 🐋
📜Please make sure to do your own research before investing, and review the disclaimer provided at the end of each post.
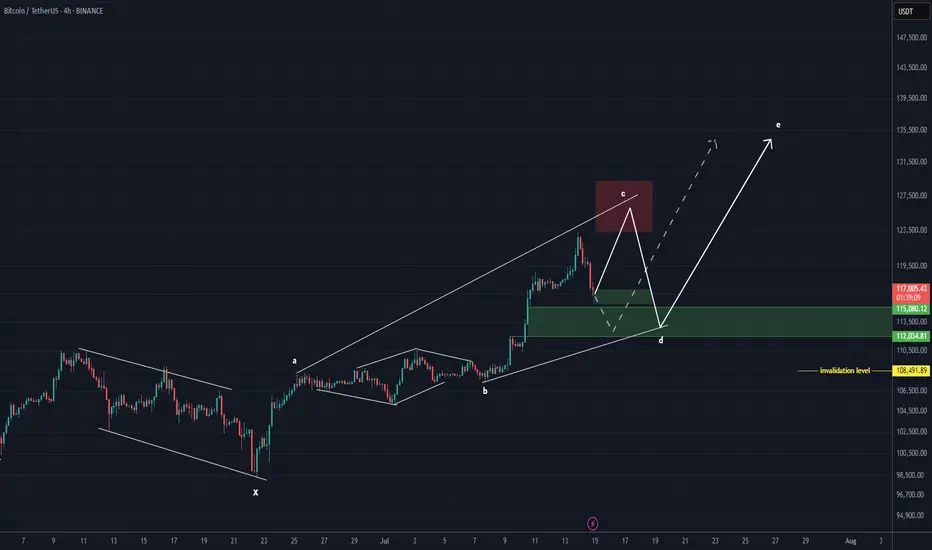
Bitcoin is still bullish (4H)Bitcoin appears to be in a dual bullish structure, currently in the second bullish phase following wave X.
Considering the expansive nature of the correction in the second pattern, it seems we are within an expanding triangle or a diametric structure.
Based on the duration of wave C, it appears that the bullish wave of the second structure is not yet complete.
We expect such fluctuations for Bitcoin in the coming period.
A daily candle close below the invalidation level would invalidate this outlook.
For risk management, please don't forget stop loss and capital management
Comment if you have any questions
Thank You
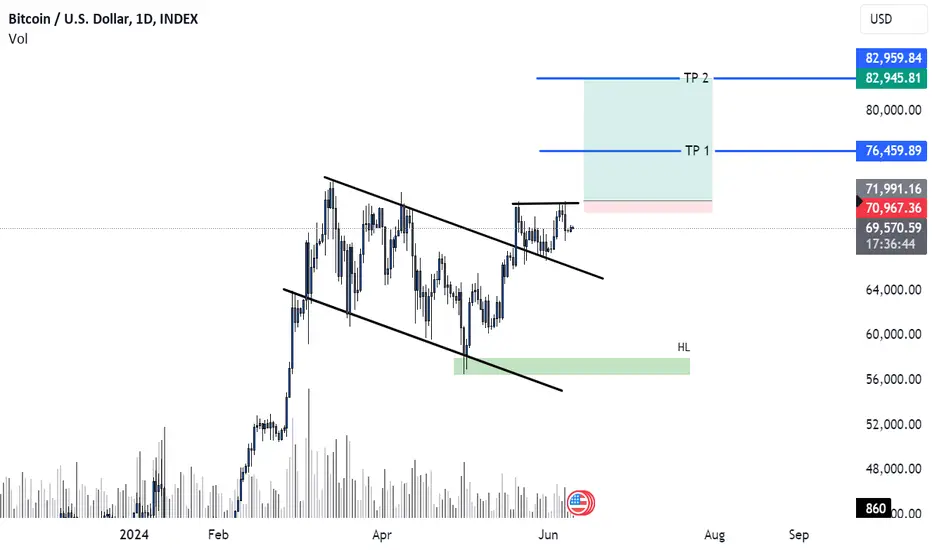
Still btc bullish
Don't predict just move according to market
Manage your risk before go to trade
Flag pattern also confirming market still continue up
Strong resistance level looking for break if it broken market make new higher high TP 75 to 82
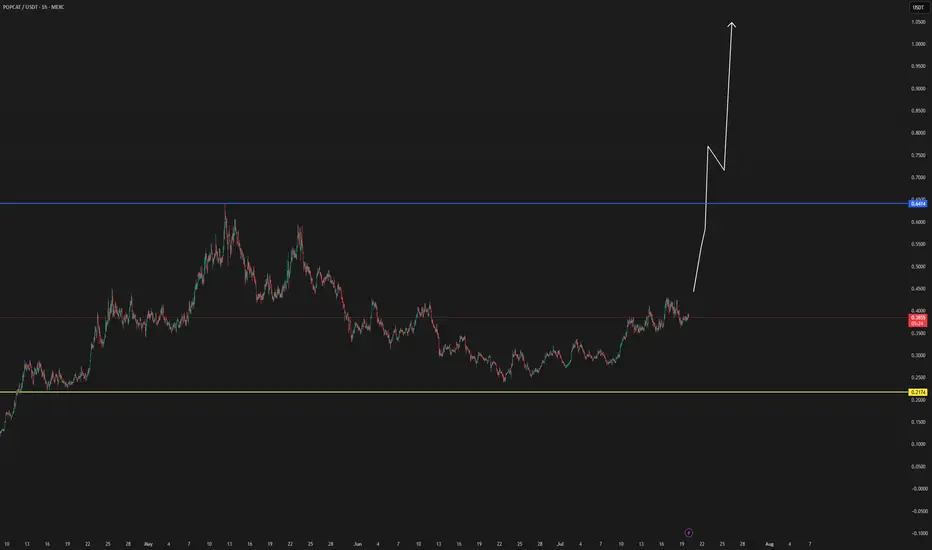
WILL POPCAT HAVE A NEW WHALE VOLUME?POPCAT seems interesting then never before, even with the last correction, are we going to see a new increase round by POPCAT? The time will show, the interest is here.
If this coin is able to make new confirmations, the updates will be below.
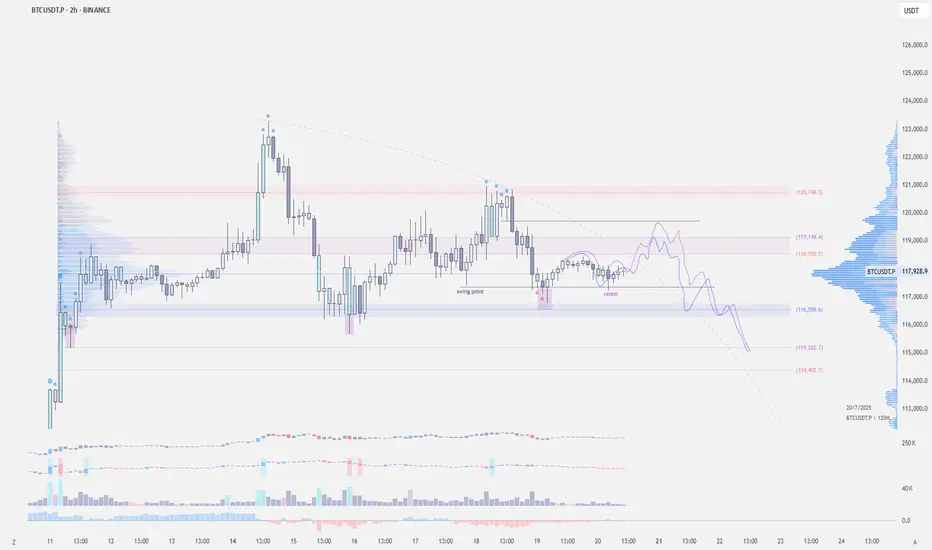
$BTC - Weekend LTF SetupCRYPTOCAP:BTC | 2h
Possible LTF setup:
We got the 2h swing point retest. If base support holds, I’m looking for a potential move back to 119k — possibly even a gap fill to 119.7k before taking out the local lows.
BTCUSD Technical Analysis | Smart Money Concept (SMC) BreakdownBTCUSD Technical Analysis | Smart Money Concept (SMC) Breakdown
🧠 Smart Money Market Structure Insight
📌 Key Elements Identified:
BOS (Break of Structure): Multiple BOS points indicate bullish intent early on. However, the latest BOS on July 14 followed by a significant drop signals a shift in momentum—possibly a distribution phase.
Liquidity Sweep: Price swept prior equal lows/liquidity before reversing, a typical Smart Money trap setup.
FVG (Fair Value Gap) / Imbalance: Identified around the mid-section of the chart—price filled partially but failed to hold, suggesting internal weakness.
Strong Support Zone (Demand Area): Marked between 115,000 - 114,640; this zone is anticipated to act as a springboard for bullish reversal.
📉 Current Price Action Observation:
BTCUSD is hovering around 118,152 - 118,560, moving sideways with lower highs indicating compression.
Price is projected to form a "W" pattern or double bottom in the shaded region.
Expected liquidity grab beneath 115,902 followed by potential bullish reaction targeting 121,562, as indicated by the white arrow.
🧩 Strategic Outlook & Potential Play:
🔻 Bearish Sweep First:
Market likely to sweep the support one more time, tapping into deeper liquidity pools between 115,000–114,640.
This is aligned with the concept of Smart Money hunting for retail stop-losses before reversing.
🔼 Bullish Recovery After Sweep:
Strong probability of bounce due to presence of:
Fair Value Gap (already tested),
Fresh demand zone,
Liquidity grab setup.
Projected Bullish Target: 121,562
Confirmation Needed: A strong bullish engulfing or BOS on lower timeframes near support.
🏷️ Conclusion:
This BTCUSD setup is a textbook Smart Money scenario: BOS ➝ Liquidity Grab ➝ FVG ➝ Reversal from Demand. Traders should wait for confirmation from the support region before entering long positions.

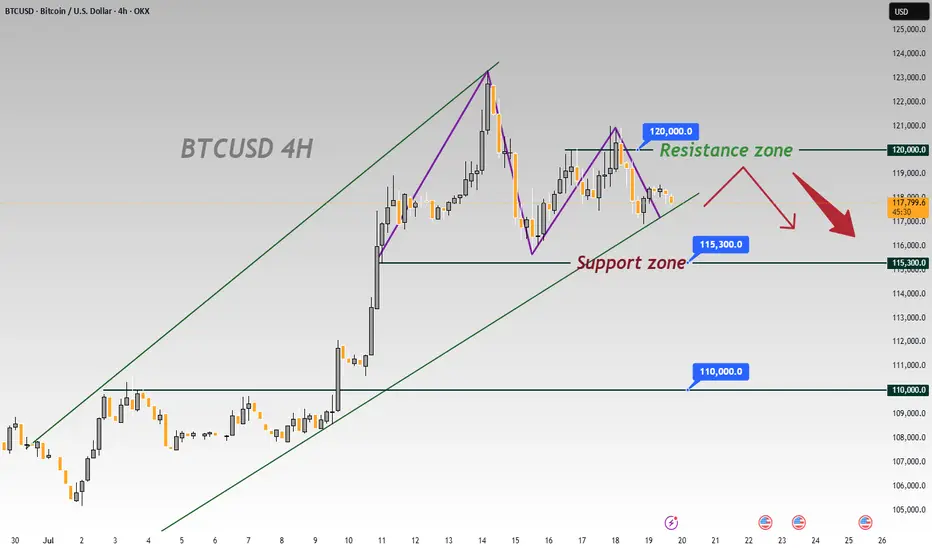
BTCUSD 4-Hour Chart Analysis: Range-Bound Trends & Key LevelsFrom the 4-hour chart of BTCUSD, the recent price movement shows obvious range-bound characteristics 📊. The upper zone around 120000 forms a key resistance level 🛑, where the bullish momentum has waned after encountering resistance 💨.
The lower level of 115300 is a significant support zone 🛡️. Previously, there was some buying support when the price retraced to this zone 👀. However, as the current price is pulling back from the resistance zone ↘️, if the bearish force takes the lead subsequently 🐻, the possibility of breaking below the 115300 support will increase ⬆️. Once it breaks below effectively 💥, the next key support level of 110000 will most likely become the target for the price to decline towards 🎯.
In terms of the short-term trend 📈, due to the obvious suppression from the resistance zone 🚧, the price will most likely continue the rhythm of testing the support downwards 🔽. In operation, one can pay attention to the breakdown situation of the support zone and layout trades accordingly 📝. Meanwhile, be alert to the possibility of a rebound after the price finds support in the support zone 🚀, and further confirmation of the direction needs to be combined with real-time K-line patterns 📊, trading volume 📈
🚀 Sell @119500 - 118500
🚀 TP 116500 - 115500
Accurate signals are updated every day 📈 If you encounter any problems during trading, these signals can serve as your reliable guide 🧭 Feel free to refer to them! I sincerely hope they'll be of great help to you 🌟 👇
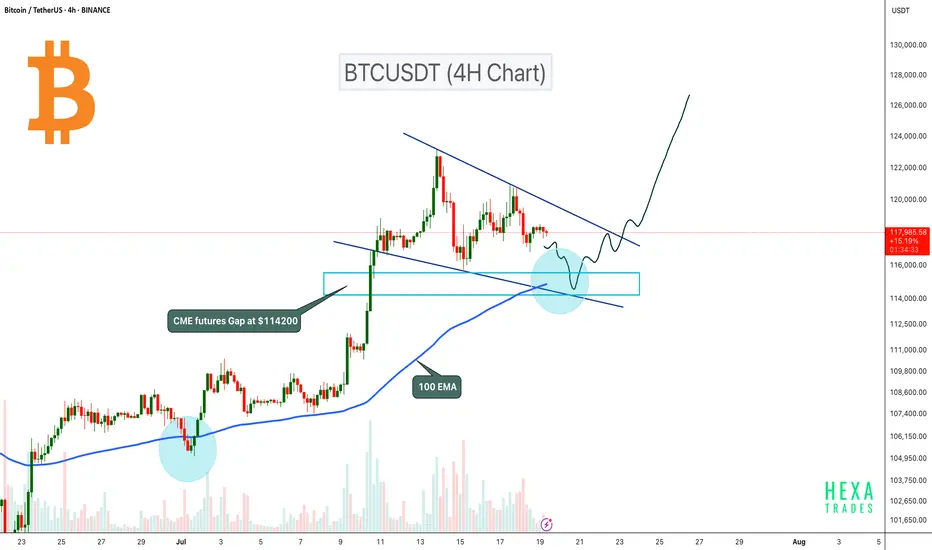
BTC Pullback Expected to $114K Before Next Leg Up!Bitcoin is currently consolidating inside a bullish flag pattern on the 4H timeframe. The price could retest the flag support, where the 100 EMA will act as dynamic support. Additionally, there is a CME futures gap at the $114,200 level, which also aligns with the 0.5 Fibonacci retracement level. Therefore, a retest to the $114,200 zone is likely before the next potential upward move.
A potential bullish reversal could occur if BTC retests this zone and confirms a bounce. A breakout from the bullish flag pattern could signal the next leg up.
Cheers
Hexa🧘♀️
BITSTAMP:BTCUSD CRYPTOCAP:BTC
BTCUSDTHello Traders! 👋
What are your thoughts on BITCOIN?
Bitcoin has recently posted a new all-time high and is now undergoing a healthy correction. This pullback is expected to extend toward a key support zone, which aligns with both the previous breakout level and the bottom of the ascending channel.
Once the correction is completed near the channel support / previous high, we anticipate a bullish continuation.
The next leg higher could take Bitcoin toward the upper boundary of the current channel.
As long as price remains above the key support area, the overall structure stays bullish and this correction is likely to be a buy-the-dip opportunity within a broader uptrend.
Will Bitcoin use this pullback as a launchpad for new highs? Share your view in the comments! 🤔👇
Don’t forget to like and share your thoughts in the comments! ❤️
LINK START...Hello friends🙌
📈As you can see, the upward trend has started, and the power is in the hands of buyers, and here we have an opportunity to enter a buy trade with risk and capital management to move with the specified goals.
🔥Follow us for more signals🔥
*Trade safely with us*

Bitcoin Interesting Fractal And Timing! GOING STRAIGHT UP!I noticed that the timing and pattern of how this is playing out in 2025 in Bitcoin is very similar to that of 2017. This fractal is not identical but its damn close. In 2017 there were approximately 15 million people in crypto, very few leverage exchanges, and trading was no where near what it is today. Now we have exchanges everywhere, hundreds of them most with leverage which we didn't really have before. Also not to mention that now we have big players getting in and they aren't buying and selling on the daily, they are buying it all and holding it, hence why we aren't seeing the typical "Alt season". The sloshing effect we had in the early days when traders would rotate out of Bitcoin into alts is not happening as it used to.
In 2017 Trump took office and in the end of March the bull run started in full swing. Something very similar is also happening now that we are in March and these fractals are lining up. Let see how this plays out. I think we are on the cusp of a giant mega bull run like you've seen before.
Crypto traders last year made mega profits cashing out multiple billions in capital gains. Once the selling stops around the end of March and beginning of April from people selling to pay taxes I think its on. This is not financial advice this is just my opinion. Lets see how this chart ages. Thank you for reading.

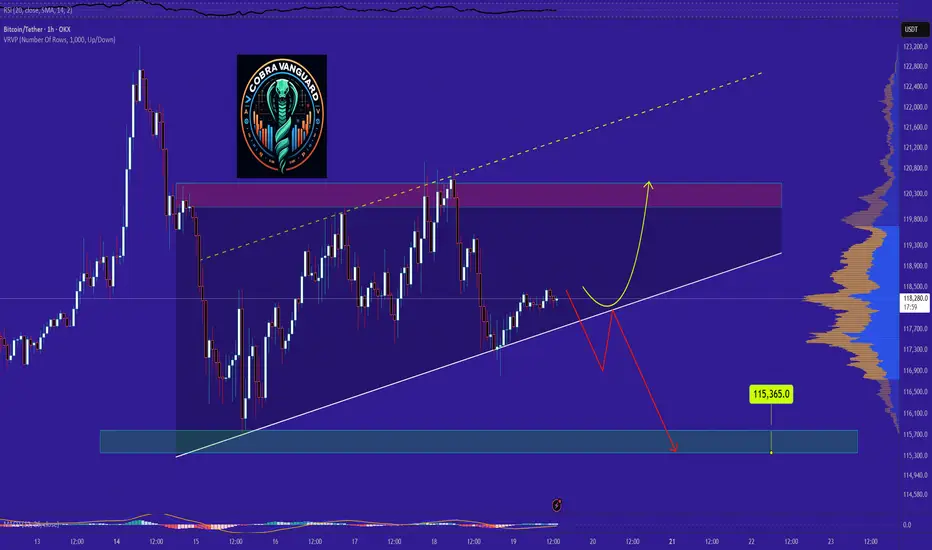
BITCOIN's Situation (1h) !!!The price is within an ascending triangle, which could be encouraging. However, since crypto doesn't always follow patterns, it might break down from below and correct to around $115K!
Best regards CobraVanguard.💚
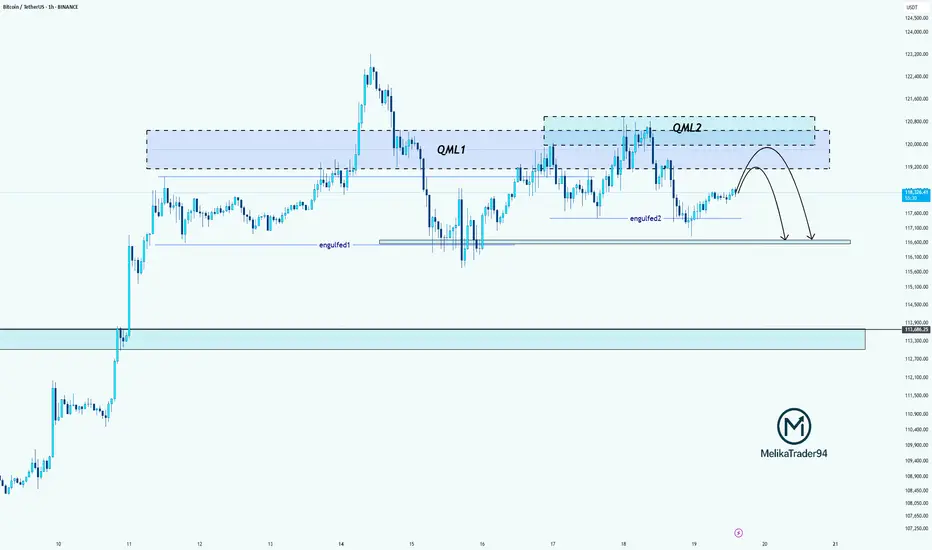
BTC Double QML Setup: Is Another Drop Loading?Hello guys!
Do you remember the last analysis?
Now this BTC chart shows a textbook example of two consecutive QML (Quasimodo Level) patterns forming (QML1 and QML2), each confirmed by clean engulfed lows.
QML1 caused a strong drop after the high was broken and a new low formed.
Price retraced and created QML2, again with a confirmed engulfed low (engulfed2).
We're now likely to see a reaction at the QML2 supply zone.
If price respects this second QML zone, we could see another bearish move toward the 116k zone, possibly lower.
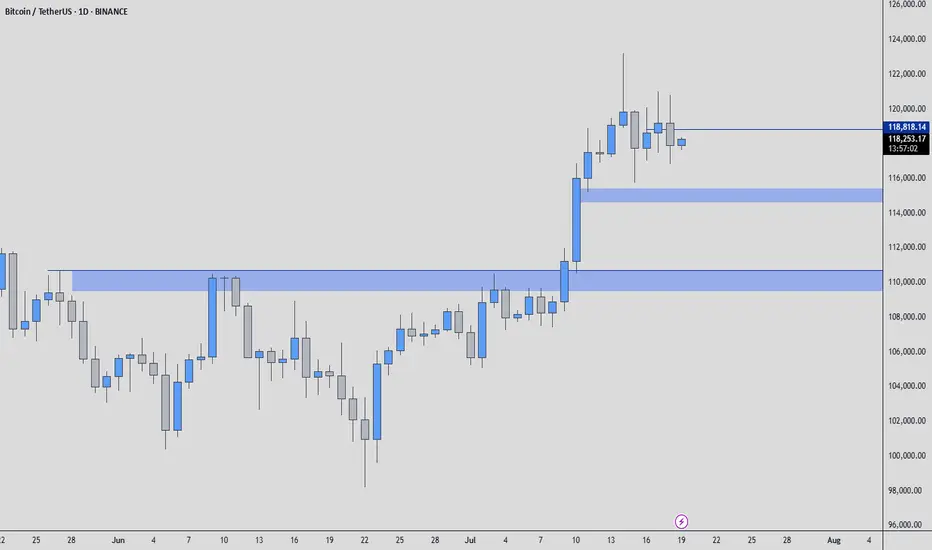
BTC/USDT: Define Your Next Winning MoveHere's the reality: While others panic and second-guess, successful traders recognize the blueprint when they see it.
The Setup That Separates Winners From Losers
Two major support zones (marked in blue) tell the complete story. My footprint CDV analysis confirms what institutional money already knows - these levels aren't suggestions, they're battle lines.
Your Proven Path Forward
Zone 1: Primary accumulation target - where smart money loads up
Zone 2: Final defense line - where rebounds launch
The Choice Is Simple
Execute at these levels with precision, or watch from the sidelines as others capitalize. My track record speaks for itself - these aren't hope-based predictions, they're data-driven opportunities.
What Happens Next
Follow this blueprint: You position at support, manage risk precisely, and capture the inevitable bounce that follows institutional accumulation.
Ignore it: Watch others profit while you chase price higher later.
Bottom Line
The market has drawn the map. The footprint data confirms the plan. Your success depends on one thing: execution when opportunity knocks.
The zones are marked. The analysis is complete. The choice is yours.
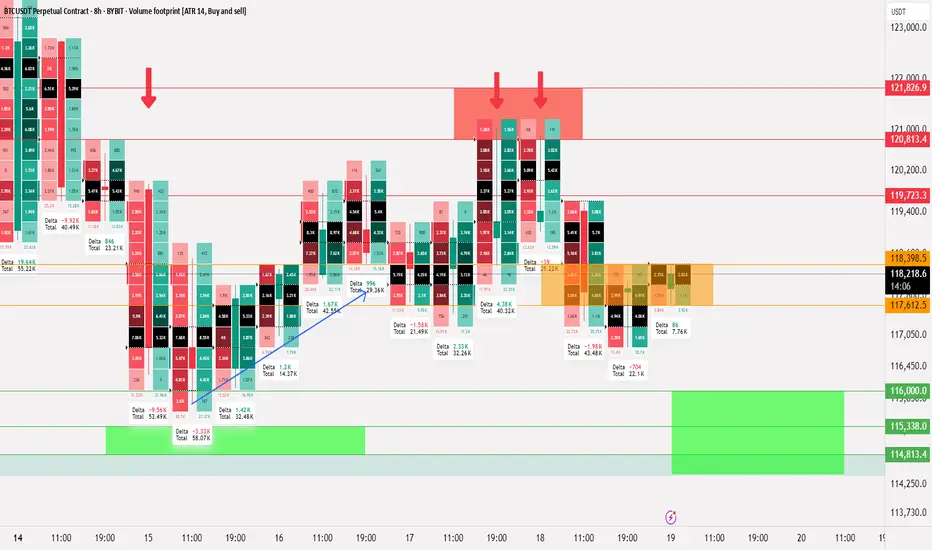
Bitcoin Liquidity updateCRYPTOCAP:BTC
📄 Update on liquidity movement and key liquidity cluster points
◀️ Summary of the first movement: A sale occurred at 121826 and a break happened at 117612, after which liquidity was collected between 116 - 115
◀️ After collecting liquidity, we mentioned that breaking 117612 would allow testing 119723, and that is what happened
⭕️ Now, a selling range has formed between 120813 - 121826, which is clear on the price chart and the way it bounced down
🟣 The current movement is confined between 118398 - 117612
📄 Regarding trading ideas:
⭕️ The thought here is to buy between 11600 - 114813 if a break occurs at 117612 and trading starts below it
⭕️ The second idea, in case this break does not happen, is to wait for confirmation of trading above 118398, and in this case, it's preferable to wait until Monday
BTCUSDT 1 Month Trading Idea... for next 2 Years...I think BTCUSDT will go back to 30,000 - 40,000 USDT price range befor it will go back to 200,000 USDT
