BTCUSDT Forming Bullish WaveBTCUSDT is currently forming a bullish wave pattern, signaling a potential continuation of its upward momentum. This technical setup suggests a series of higher highs and higher lows, indicative of strong buyer demand and consistent market optimism. With volume remaining robust, the foundation for a significant breakout is solid. If the pattern plays out, analysts expect a 09% to 10% gain in the mid to long term, which could be fueled by renewed institutional interest and global adoption.
Bitcoin has historically responded well to bullish wave formations, often leading to aggressive rallies once key resistance levels are breached. As the largest cryptocurrency by market cap, BTCUSDT not only reflects investor sentiment in Bitcoin itself but also often sets the tone for the broader crypto market. The current price action shows consolidation with positive volume spikes, which further supports the bullish thesis and provides a potential launchpad for another major leg upward.
With increasing attention on macroeconomic shifts, regulatory developments, and halving cycles, Bitcoin continues to position itself as a hedge against traditional market uncertainties. The bullish wave pattern now forming could signal that Bitcoin is entering a new phase of growth, especially as global interest in decentralized finance, ETFs, and blockchain innovation surges.
Traders and long-term investors alike should closely monitor this structure. A breakout with volume confirmation could offer an excellent entry point, backed by strong technicals and a solid fundamental backdrop. The combination of a bullish pattern and broader adoption trends makes BTCUSDT one of the most watched assets in the market right now.
✅ Show your support by hitting the like button and
✅ Leaving a comment below! (What is You opinion about this Coin)
Your feedback and engagement keep me inspired to share more insightful market analysis with you!
Btcusdtanalysis

BTC/USD) Bullish trend analysis Read The captionSMC Trading point update
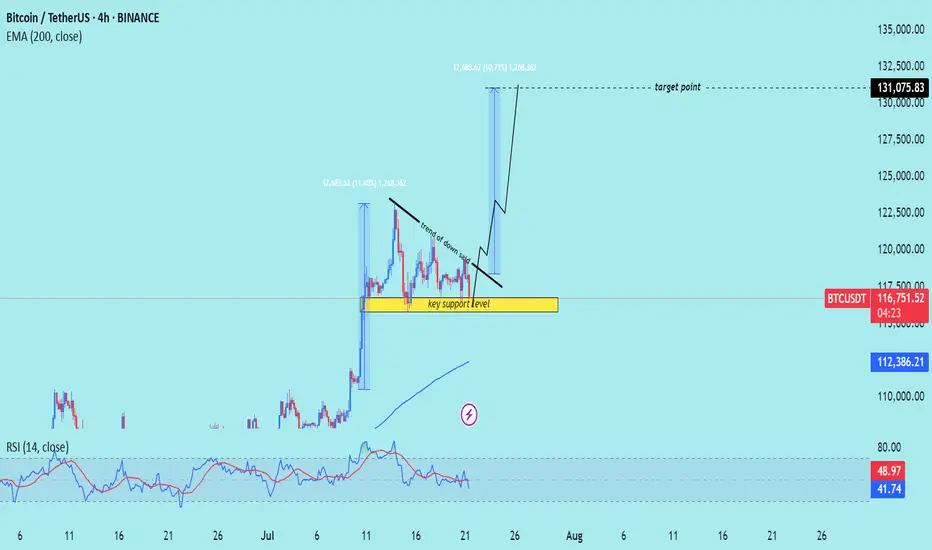
Technical analysis of Bitcoin (BTC/USDT) on the 4-hour timeframe, indicating a potential upward continuation after a period of consolidation above a key support level.
---
Analysis Summary
Pair: BTC/USDT
Timeframe: 4H
Current Price: 116,810.90
Bias: Bullish breakout continuation
---
Key Technical Insights
1. Key Support Zone:
The yellow box marks a strong support level, where price has bounced multiple times.
Acts as a launchpad for the next move higher.
2. Descending Trendline:
A trend of lower highs suggests short-term selling pressure.
Break above this trendline would signal a bullish breakout.
3. Projected Move:
If the breakout occurs, the projected target is around 131,075.83, representing a ~12% gain.
Similar move structure as the previous breakout earlier this month.
4. EMA 200 (Supportive):
Price remains above the 200 EMA at 112,386.80, affirming bullish trend bias.
5. RSI (14):
RSI hovering around 42–49, slightly oversold area, suggesting upside potential remains.
---
Target Point
Target: 131,075.83 USDT
Stop-Loss Suggestion: Below key support zone (~114,000)
---
Trade Idea
Direction Entry Stop-Loss Target
Buy Break above 118,000 Below 114,000 131,000–132,000
Mr SMC Trading point
---
Summary
Bitcoin is consolidating above a strong support zone and under a descending trendline. A confirmed breakout from this pattern could lead to a bullish rally toward 131,000+.
-
Please support boost 🚀 this analysis)
BTCUSD RECAPBITCOIN has preformed as expected in short period of time can continue even more to the up side but will wait for good entries

BTCUSD BTCUSD still expecting some good run within to the up side as there’s a new higher price that’s not been touched
Btcusd:Huge trading opportunities and ideasBTCUSD's rebound after touching the position near 116180 this time is fast. From the trend observation. BTCUSD is still in a high consolidation stage. It has not broken the oscillation range for the time being. It can maintain selling near 120k. Buying near 11600 for range trading. It is expected that there will not be many trading opportunities in the London market. It will take until the New York market opens to see better trading opportunities.
BTCUSD BULLYING Bitcoin is still respecting price and is buying can expect some nice moves (New Highs)
BTCUSDBTCUSD also fell from a high level, reaching a high of around 119700, only 300 points away from the target of 120k. The price after the decline is now around 118600. Buying at a low level is the main focus. The reference buying point is 118500-118000. The target is above 120k. Stop loss 117300
BTC/USDT LONG SET UP (BITCOIN)Entry Price 1: $118,000
Entry Price 2: $116,500
Stop Loss: $115,000
Take Profit 1: $121,000 (Close 25%)
Take Profit 2: $124,000 (Close 50%)
Take Profit 3: $127,000 (Close 75%)
Take Profit 4: $130,000 (Close 100%)

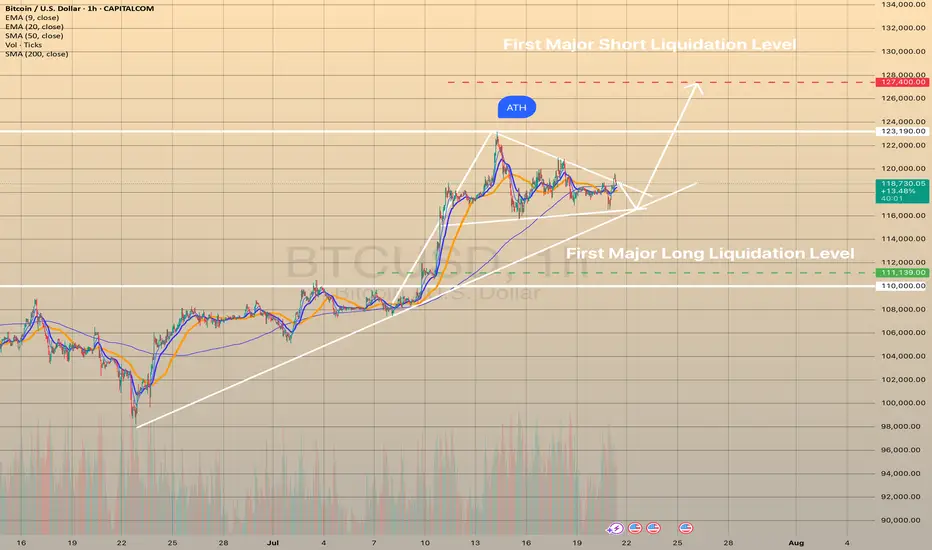
BTCUSD CONSOLIDATES BEFORE NEXT HIKE
BTCUSD CONSOLIDATES BEFORE NEXT HIKE📈
Bitcoin has been under buying pressure since the beginning of July 9. Since July 14 the price has been consolidating. Now the graph represents the bullish pennant.
I expect the price to continue trading sideways for some time, then rebound from the trendline and move towards first major liquidation level at 127,400.00.
What is a liquidation Level?
The price at which a crypto exchange forcibly closes a leveraged position when margin falls below the required level, recovering borrowed funds.
#Bitcoin LTF update #Bitcoin LTF update
After making a high of $123,300, it dropped a bit and made short-term support at $117,000, and currently it is holding at this level.
But it is not strong enough to hold, we will retest the lower level.
IMO, we can see a retest up to $113,000 level approximately.
Where we have 0.382 golden fibre level, which is also aligning with some more important indicators, and most importantly, we have good numbers of liquidation at that level.
If you find my updates helpful, don’t forget to like and follow for more!
DYOR, NFA

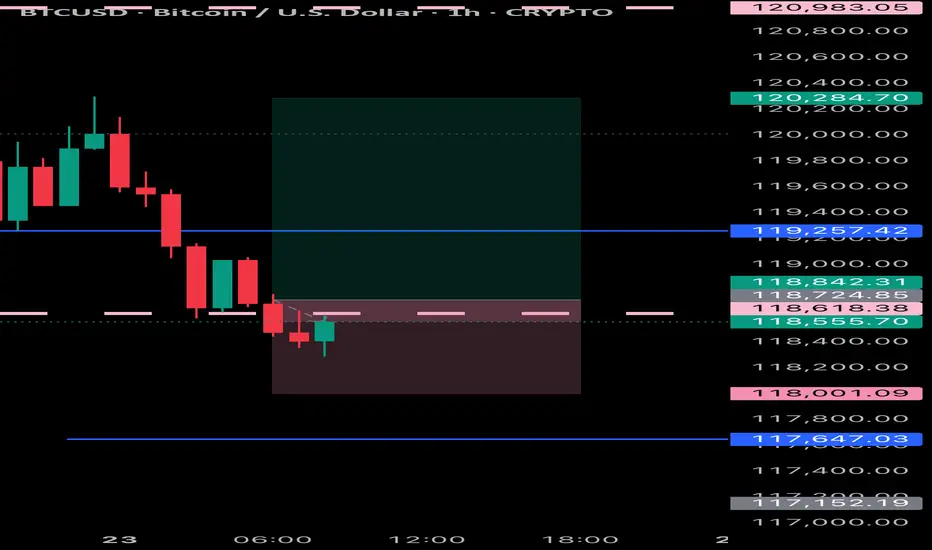
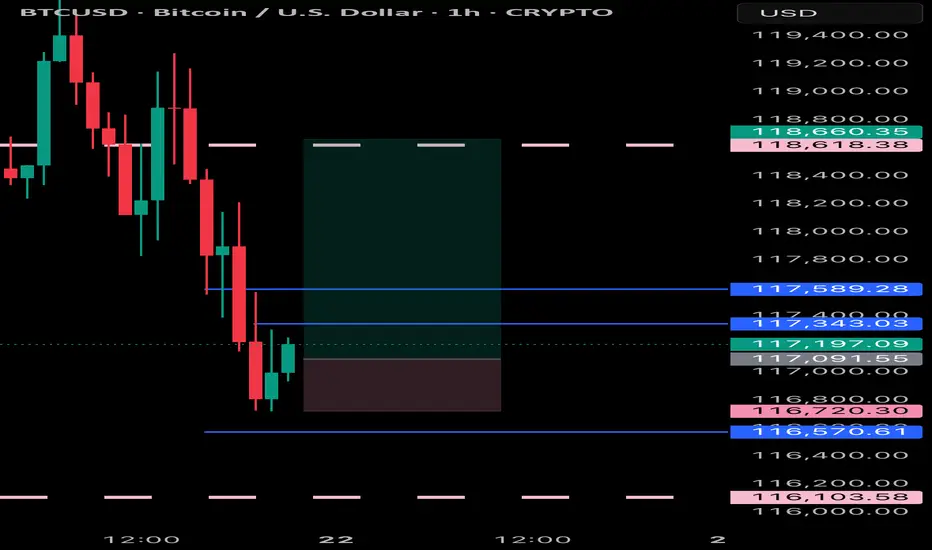
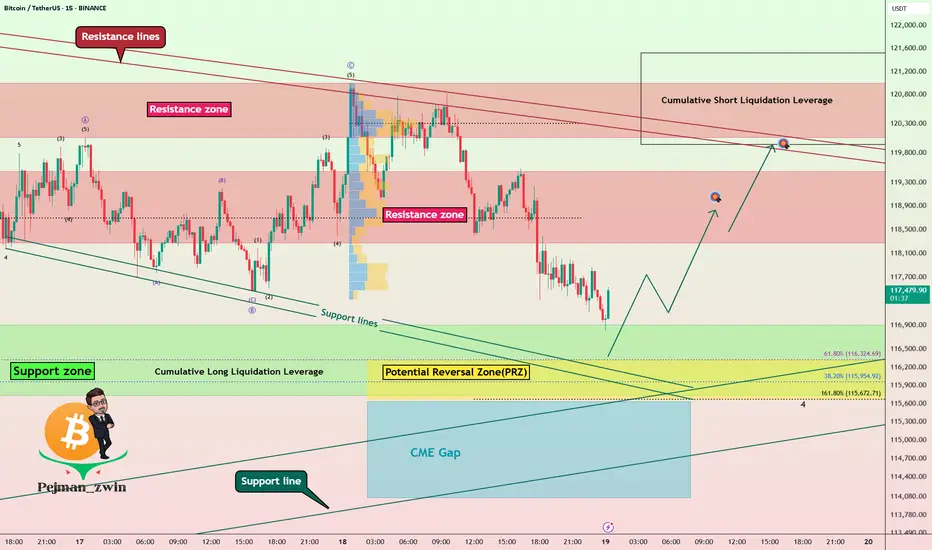
Bitcoin Technical Setup: Support Holds, Eyes on $118,600Bitcoin ( BINANCE:BTCUSDT ) moved as I expected in the previous ideas and finally completed the CME Gap($117,255-$116,675) in the last hours of the week. ( First Idea _ Second Idea )
Before starting today's analysis, it is important to note that trading volume is generally low on Saturday and Sunday , and we may not see a big move and Bitcoin will move in the range of $121,000 to $115,000 ( in the best case scenario and if no special news comes ).
Bitcoin is currently trading near the Support zone($116,900-$115,730) , Cumulative Long Liquidation Leverage($116,881-$115,468) , Potential Reversal Zone(PRZ) , and Support lines .
According to Elliott Wave theory , Bitcoin had a temporary pump after the " GENIUS stablecoin bill clears House and heads to Trump's desk " news, but then started to fall again, confirming the end of the Zigzag Correction(ABC/5-3-5) . Now we have to wait for the next 5 down waves or the corrective waves will be complicated .
I expect Bitcoin to rebound from the existing supports and rise to at least $118,600 . The second target could be the Resistance lines .
Do you think Bitcoin will fill the CME Gap($115,060-$114,947) in this price drop?
Cumulative Short Liquidation Leverage: $121,519-$119,941
Do you think Bitcoin can create a new ATH again?
Note: Stop Loss(SL)= $114,700
Please respect each other's ideas and express them politely if you agree or disagree.
Bitcoin Analyze (BTCUSDT), 15-minute time frame.
Be sure to follow the updated ideas.
Do not forget to put a Stop loss for your positions (For every position you want to open).
Please follow your strategy and updates; this is just my Idea, and I will gladly see your ideas in this post.
Please do not forget the ✅' like '✅ button 🙏😊 & Share it with your friends; thanks, and Trade safe.
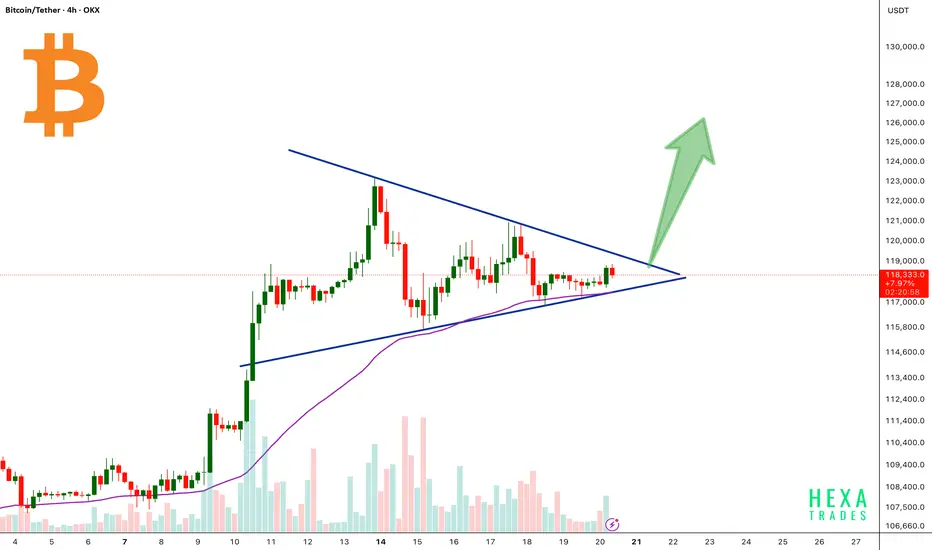
BTC Forming Bullish Triangle!Bitcoin is currently consolidating inside a symmetrical triangle pattern after a strong bullish rally. The price is approaching the apex of the triangle, signaling a potential breakout soon.
The 50 EMA is acting as dynamic support, perfectly aligned with the triangle’s lower trendline, reinforcing the bullish structure.
A confirmed breakout above the triangle resistance could trigger a strong upward move, with a potential target near the $125,000–$130,000 zone.
Cheers
Hexa
BINANCE:BTCUSDT CRYPTOCAP:BTC
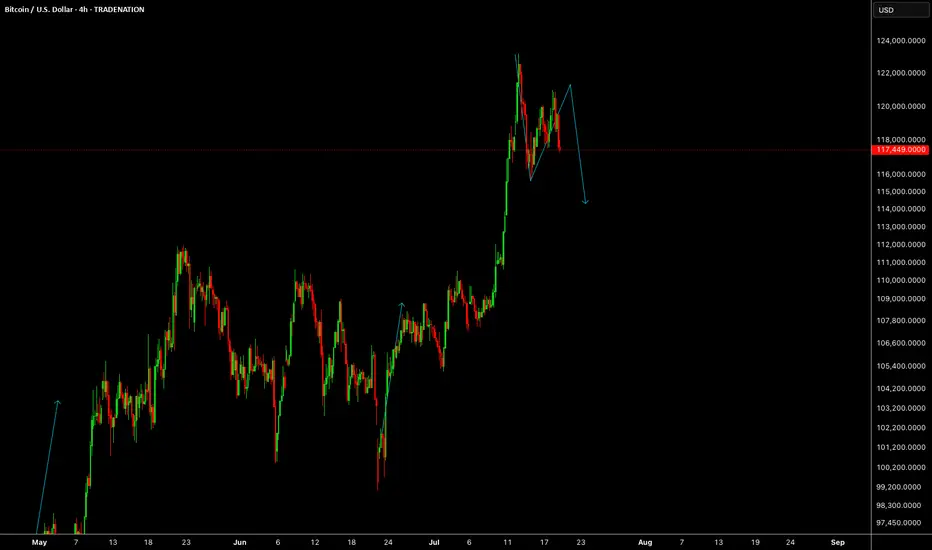
BTCUSDBTCUSD needs some more correction before we continue the same trend.
Disclosure: We are part of Trade Nation's Influencer program and receive a monthly fee for using their TradingView charts in our analysis.
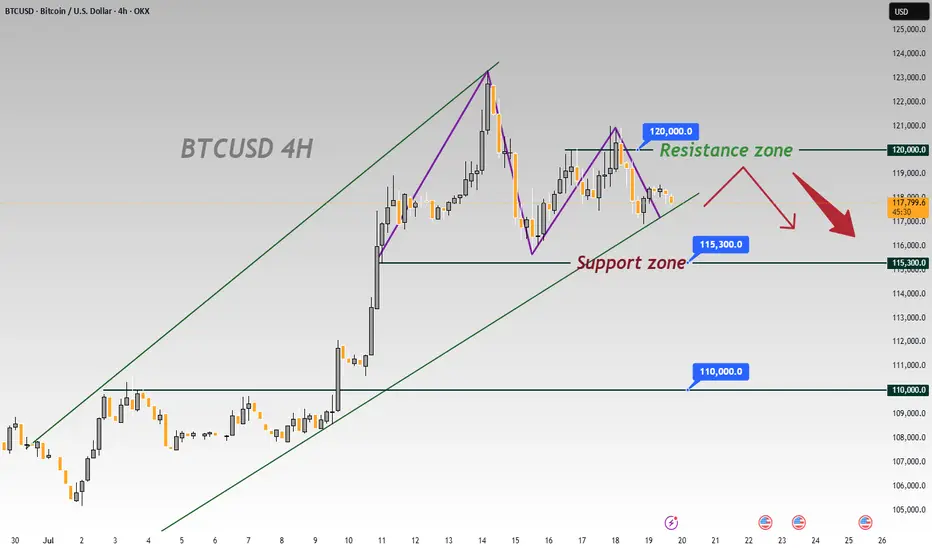
BTCUSD 4-Hour Chart Analysis: Range-Bound Trends & Key LevelsFrom the 4-hour chart of BTCUSD, the recent price movement shows obvious range-bound characteristics 📊. The upper zone around 120000 forms a key resistance level 🛑, where the bullish momentum has waned after encountering resistance 💨.
The lower level of 115300 is a significant support zone 🛡️. Previously, there was some buying support when the price retraced to this zone 👀. However, as the current price is pulling back from the resistance zone ↘️, if the bearish force takes the lead subsequently 🐻, the possibility of breaking below the 115300 support will increase ⬆️. Once it breaks below effectively 💥, the next key support level of 110000 will most likely become the target for the price to decline towards 🎯.
In terms of the short-term trend 📈, due to the obvious suppression from the resistance zone 🚧, the price will most likely continue the rhythm of testing the support downwards 🔽. In operation, one can pay attention to the breakdown situation of the support zone and layout trades accordingly 📝. Meanwhile, be alert to the possibility of a rebound after the price finds support in the support zone 🚀, and further confirmation of the direction needs to be combined with real-time K-line patterns 📊, trading volume 📈
🚀 Sell @119500 - 118500
🚀 TP 116500 - 115500
Accurate signals are updated every day 📈 If you encounter any problems during trading, these signals can serve as your reliable guide 🧭 Feel free to refer to them! I sincerely hope they'll be of great help to you 🌟 👇
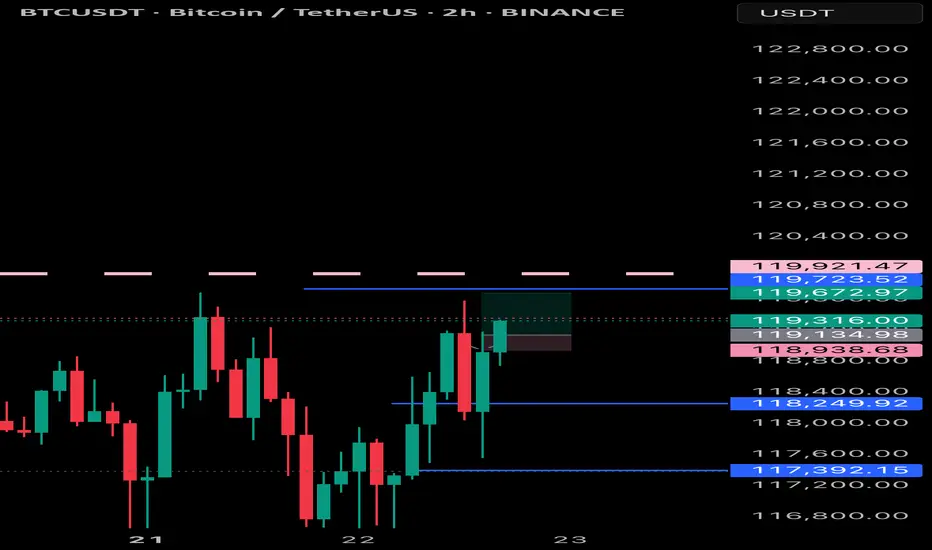
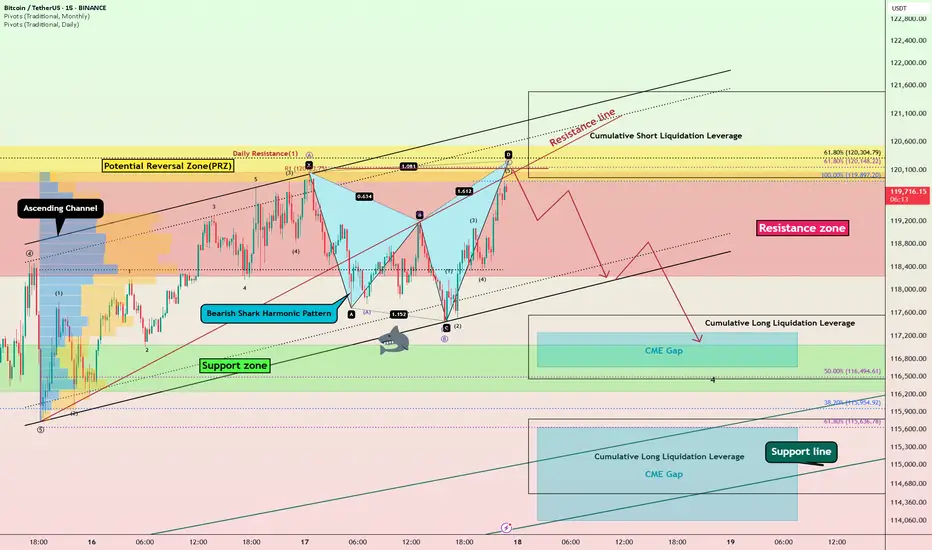
Bitcoin Bearish Shark Detected – CME Gap Below $115K in Sight?Today's analysis is on the 15-minute timeframe , following the previous analysis I shared with you on the 1-hour timeframe .
Bitcoin ( BINANCE:BTCUSDT ) is currently trading in the Resistance zone($120,100-$118,240) near the Potential Reversal Zone(PRZ) and Cumulative Short Liquidation Leverage($121,490-$119,965) .
From a technical perspective , it looks like Bitcoin is completing the Bearish Shark Harmonic Pattern on the 15-minute timeframe .
From an Elliott wave theory perspective, it looks like Bitcoin is completing the microwave 5 of wave C of the Zigzag Correction(ABC/5-3-5) .
I expect Bitcoin to start falling from the top of the ascending channel and at least decline to the lower line of the descending channel, and if the ascending channel breaks this time, we should wait for the CME Gap($117,255-$116,675)/CME Gap($115,060-$114,947) to fill.
Cumulative Long Liquidation Leverage: $117,556-$116,465
Cumulative Long Liquidation Leverage: $115,773-$114,513
Do you think Bitcoin can create a new ATH again?
Note: Stop Loss(SL)= $121,620
Please respect each other's ideas and express them politely if you agree or disagree.
Bitcoin Analyze (BTCUSDT), 15-minute time frame.
Be sure to follow the updated ideas.
Do not forget to put a Stop loss for your positions (For every position you want to open).
Please follow your strategy and updates; this is just my Idea, and I will gladly see your ideas in this post.
Please do not forget the ✅' like '✅ button 🙏😊 & Share it with your friends; thanks, and Trade safe.
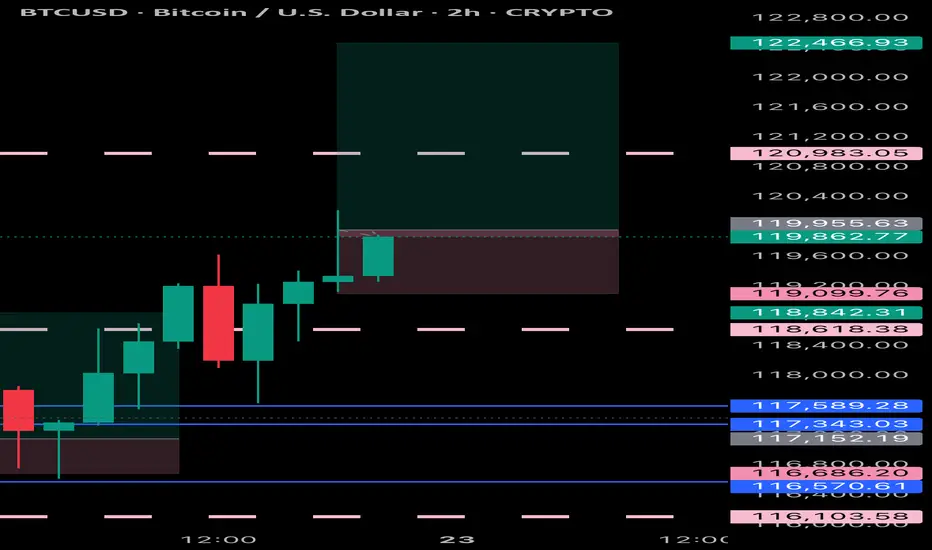
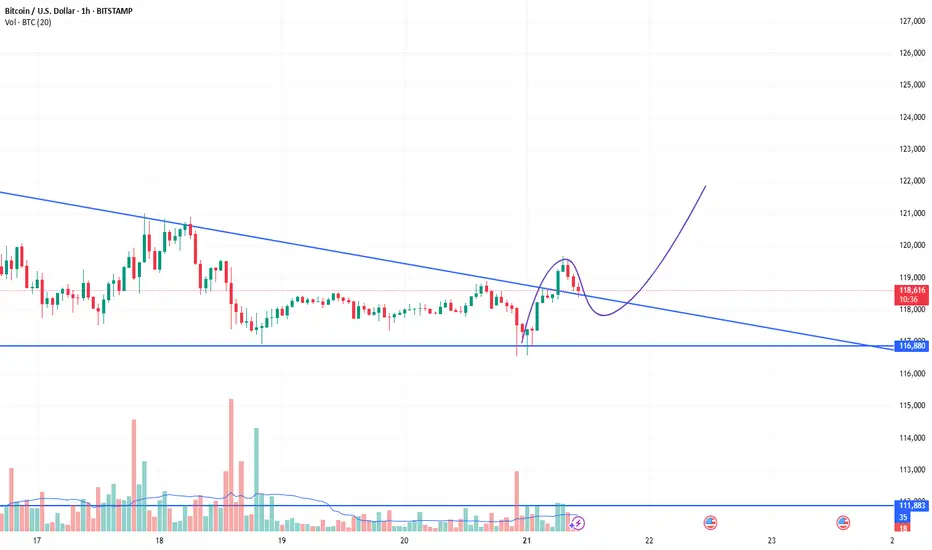
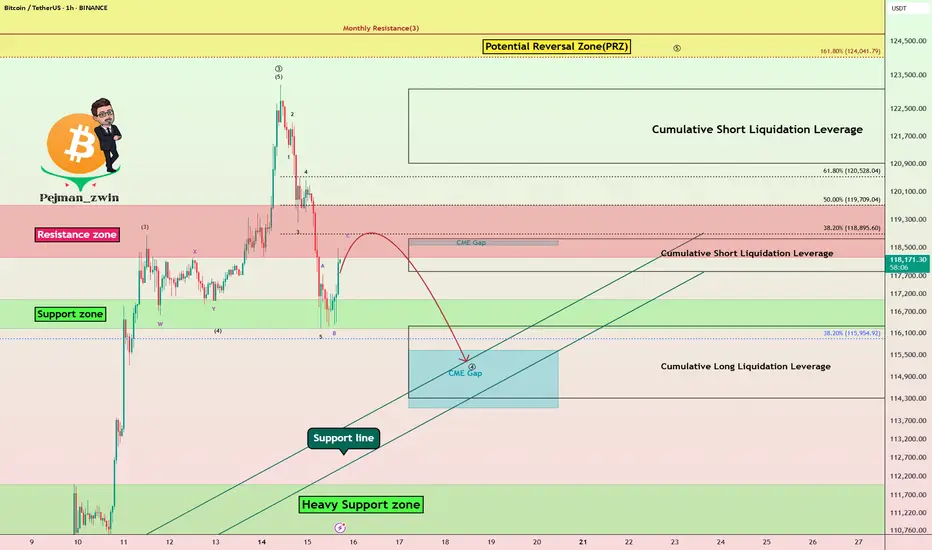
Bitcoin Struggles Below $120K:Will the CME Gap Pull Price Lower?Bitcoin ( BINANCE:BTCUSDT ) has been experiencing a high momentum bullish trend in recent days, which few people expected, especially when it crossed $120,000 . However, in the past 24 hours , Bitcoin has fallen back below $120,000 .
Bitcoin is currently trading in the Resistance zone($119,720-$118,240) and Cumulative Short Liquidation Leverage($118,757-$117,829) on the 1-hour time frame .
In terms of Elliott Wave theory , Bitcoin appears to be completing a main wave 4 . Main wave 4 is likely to have a Zigzag Correction(ABC/5-3-5) .
I expect Bitcoin to attack the Support lines and fill the CME Gap($115,060-$114,947) in the next hour.
Cumulative Short Liquidation Leverage: $123,087-$120,922
Cumulative Long Liquidation Leverage: $116,305-$114,325
Do you think Bitcoin can create a new ATH again?
Note: Stop Loss(SL)= $121,000
Please respect each other's ideas and express them politely if you agree or disagree.
Bitcoin Analyze (BTCUSDT), 1-hour time frame.
Be sure to follow the updated ideas.
Do not forget to put a Stop loss for your positions (For every position you want to open).
Please follow your strategy and updates; this is just my Idea, and I will gladly see your ideas in this post.
Please do not forget the ✅' like '✅ button 🙏😊 & Share it with your friends; thanks, and Trade safe.
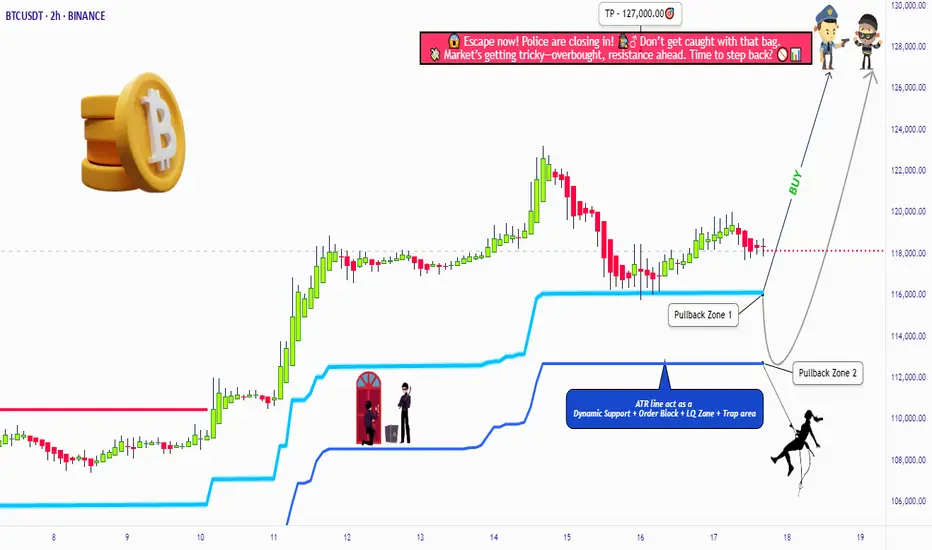
BTC/USDT Heist Mode: Buy Low, Escape Rich🏴☠️"Bitcoin vs Tether" Crypto Market Robbery Blueprint 🔥 | Thief Trading Style (Swing/Day Plan)
🌍 Hey Money Makers, Chart Hackers, and Global Robbers! 💰🤑💸
Welcome to the new Heist Plan by your favorite thief in the game — this time targeting the "Bitcoin vs Tether" Crypto Market like a smooth criminal on the charts. 🎯📊
This is not your average technical analysis — it's a strategic robbery based on Thief Trading Style™, blending deep technical + fundamental analysis, market psychology, and raw trader instincts.
💼 THE SETUP — PREPARE FOR THE ROBBERY 🎯
We're looking at a bullish operation, setting up to break into the high-value vaults near a high-risk, high-reward resistance zone — beware, it's a high-voltage trap area where pro sellers and bearish robbers set their ambush. ⚡🔌
This plan includes a layered DCA-style entry, aiming for max profit with controlled risk. Chart alarms on, mindset ready. 🧠📈🔔
🟢 ENTRY: "The Robbery Begins"
📍 Zone-1 Buy: Near 116200.00 after MA pullback
📍 Zone-2 Buy: Near 112600.00 deeper pullback
🛠️ Entry Style: Limit Orders + DCA Layering
🎯 Wait for MA crossover confirmations and price reaction zones — don’t chase, trap the market.
🔻 STOP LOSS: "Plan the Escape Route"
⛔ SL for Pullback-1: 113000.00 (2H swing low)
⛔ SL for Pullback-2: 110000.00
📌 SL placement depends on your position sizing & risk management. Control the loss; live to rob another day. 🎭💼
🎯 TARGET ZONE: “Cash Out Point”
💸 First TP: 127000.00
🏁 Let the profit ride if momentum allows. Use a trailing SL once it moves in your favor to lock in gains.
👀 Scalpers Note:
Only play the long side. If your capital is heavy, take early moves. If you’re light, swing it with the gang. Stay on the bullish train and avoid shorting traps. Use tight trailing SL.
🔎 THE STORY BEHIND THE HEIST – WHY BULLISH?
"Bitcoin vs Tether" shows bullish momentum driven by:
💹 Technical bounce off major support
🌏 Macroeconomic & geopolitical sentiment
📰 Volume + sentiment shift (risk-on)
📈 Cross-market index confirmation
🧠 Smart traders are preparing, not reacting. Stay ahead of the herd.
👉 For deeper insight, refer to:
✅ Macro Reports
✅ COT Data
✅ Intermarket Correlations
✅ CHINA-specific index outlooks
⚠️ RISK WARNING – TRADING EVENTS & VOLATILITY
🗓️ News releases can flip sentiment fast — we advise:
❌ Avoid new positions during high-impact events
🔁 Use trailing SLs to protect profit
🔔 Always manage position sizing and alerts wisely
❤️ SUPPORT THE CREW | BOOST THE PLAN
Love this analysis? Smash that Boost Button to power the team.
Join the Thief Squad and trade like legends — Steal Smart, Trade Sharp. 💥💪💰
Every day in the market is a new heist opportunity — if you have a plan. Stay tuned for more wild robbery blueprints.
📌 This is not financial advice. Trade at your own risk. Adjust based on your personal strategy and capital. Market conditions evolve fast — stay updated, stay alert.
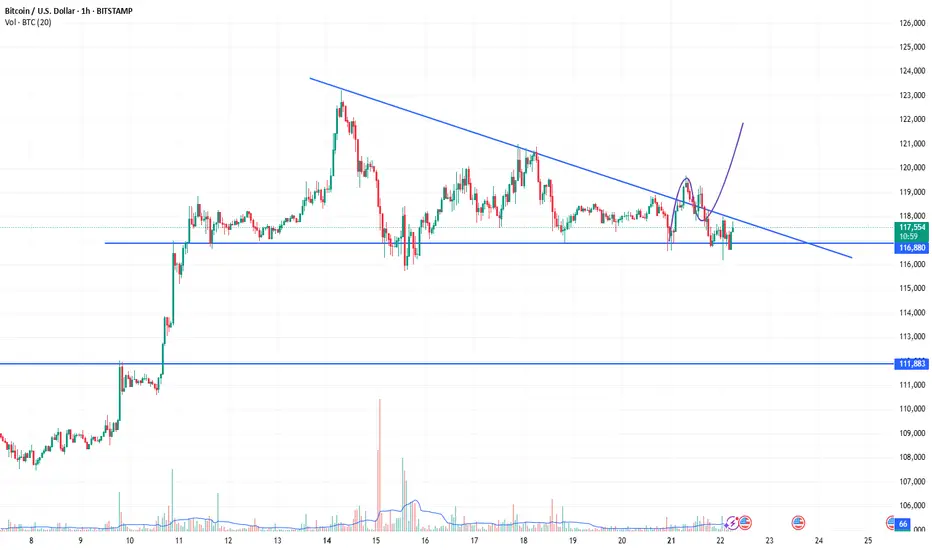
#BTCUSDT | Massive Breakout – Now What?Bitcoin has broken out of a multi-week descending wedge on the 4H chart — a classic bullish reversal pattern. Price is now consolidating just above $116,818 support, forming a base for the next leg up.
What Just Happened:
Clean breakout above the wedge resistance
Strong momentum candle above $111,862
Immediate rejection near $122,341
Currently retesting the previous breakout zone
Key Levels:
Resistance: $122,341
Support: $116,818 → key short-term level
Breakout Support: $111,862
Deeper Support: $105,189
Invalidation Level: $97,205
Bullish Outlook:
If BTC holds $116,818 and breaks above $122,341 with volume, the next leg could extend toward $128,000–$132,000.
Bearish Risk:
Losing $116,818 with volume → look for retest near $111,862 or even $105,189 for a stronger bounce.
Bias:
Bullish above $116,818 — watching for consolidation before continuation.
Trade Setup (if planning to enter):
Entry on retest of $116,818–$117,000
SL: Below $114,000
TP1: $122,341
TP2: $128,000
TP3: $132,000
DYOR | Not Financial Advice

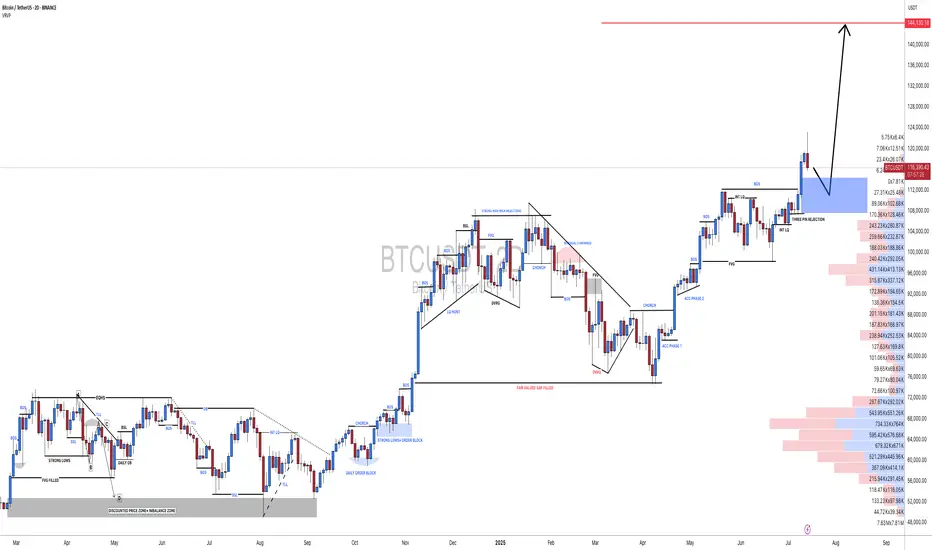
Bitcoin -> The bullrun is not over!📣Bitcoin ( CRYPTO:BTCUSD ) is still totally bullish:
🔎Analysis summary:
A couple of months ago Bitcoin broke above the previous all time high. This was basically just the expected creation of new highs, perfectly following the underlying cycles. With respect to the long term rising channel formation, this bullrun on Bitcoin is just starting.
📝Levels to watch:
$100.000
🙏🏻#LONGTERMVISION
Philip - Swing Trader

#BTCUSDT(BITCOIN): Another Small Correction And Bounce Straight Bitcoin reached a record high of 125k, but then its price started to drop and is currently trading at 115k. We expect the price to reverse from the 110k area and continue its bull move towards the potential next target of 150k. Keep an eye on the price to see if it falls below our area of interest.
Good luck and trade safely!
Team Setupsfx_
Analysis of the Latest Bitcoin Market。On July 14, Bitcoin's price surged sharply, with the highest level reaching $123,100. This breakthrough ended its eight-month-long consolidation phase within the $90,000 - $110,000 range.
The U.S. House of Representatives designated the week of July 14 as "Crypto Week" and plans to deliberate on a number of key bills. Among them, the Guiding and Establishing America's Stablecoin National Innovation Act aims to formulate federal regulations for stablecoins and is regarded as a "landmark legislation" in the cryptocurrency sector. The market expects the cryptocurrency industry to usher in policy dividends.
Market analysts are relatively optimistic about Bitcoin's prospects. The $125,000 level is seen as the next key psychological threshold, and a breakthrough above it would open up greater upside potential. Standard Chartered Bank predicts that Bitcoin will challenge $200,000 by the end of the year. Although the Relative Strength Index (RSI) is at a high level, there is no obvious overbought signal. The moving average system is clearly aligned, and the support level has moved up to $112,000. The market consensus holds that "any pullback represents a buying opportunity."
you are currently struggling with losses,or are unsure which of the numerous trading strategies to follow,You have the option to join our VIP program. I will assist you and provide you with accurate trading signals, enabling you to navigate the financial markets with greater confidence and potentially achieve optimal trading results.
