BTCUSD 1MBTC ~ 1M
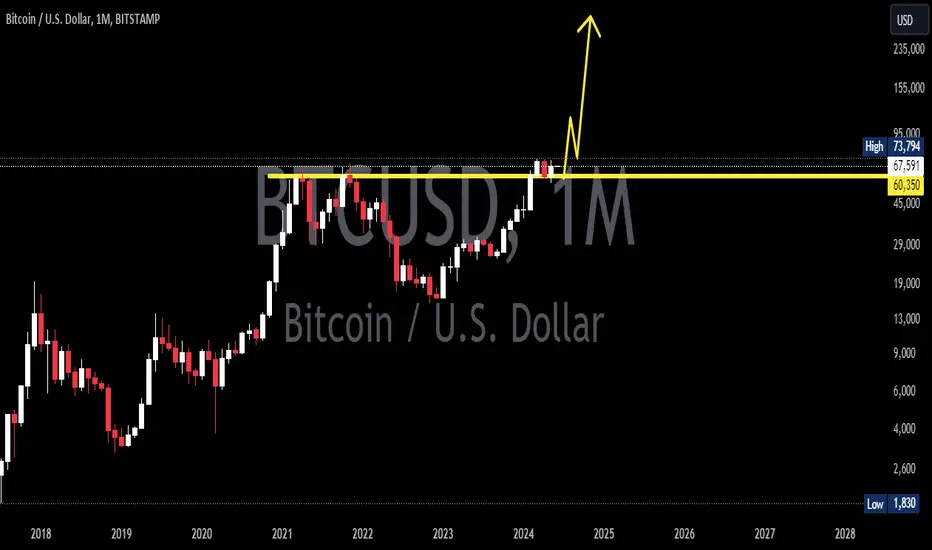
#BTC on Monthly Time Frame BITSTAMP:BTCUSD Looks very good. The retest of the support line has been successful.
Our short term target is $80,000
Our long term target is +$100,000
Btcusdtanalysis
BTCUSDT is at 4h resistance now, may experience some struggle The price has bounced from 4h support 4HS1 and now it has headed towards 4h resistance 4HR1. The price is currently trading inside this resistance zone. The price will face some struggle here and some pullback may be expected. Some momentum is there and the price has moved to this resistance 4HR1 from the support 4HS1 quite quickly. And therefore, any short trade I am not taking. We will look for a trade opportunity based on how the price reacts to this resistance zone.

Is Bitcoin set for a new ATH? | 30.05Bitcoin is set for a new ATH? – brief price analysis by BlockchainReporter
Bitcoin price failed to hold its momentum around the $70K mark, resulting in a steep decline below its Fib channels. However, BTC rebounded from the 100-day EMA, priced at $67,291, and climbed past the $68.3K mark, suggesting that the bulls are consolidating their position. As of writing, BTC price trades at $67,902, declining over 0.9% in the last 24 hours.
WHITEBIT:BTCUSDT trading pair appears poised for a potential rally toward the significant resistance level at $71,000. At this point, it is anticipated that the bears will vigorously contest this level. A breach here could send the pair toward $74K, and possibly extend gains to a new ATH.
Conversely, if the price sharply declines from this resistance and falls below the moving averages, it would indicate that the trading pair might oscillate around the ascending support channel.

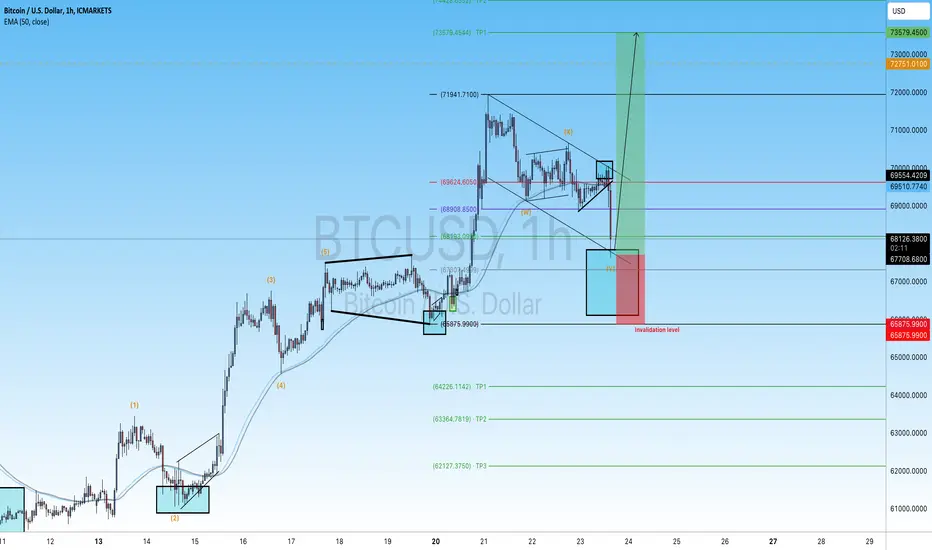
BTCUSD BUYHi fellow traders, BTCUSD is ready to make a move higher from the blue box after completing flag correction in WXY formation. Target the 73579.45 level. Good luck and trade safe!
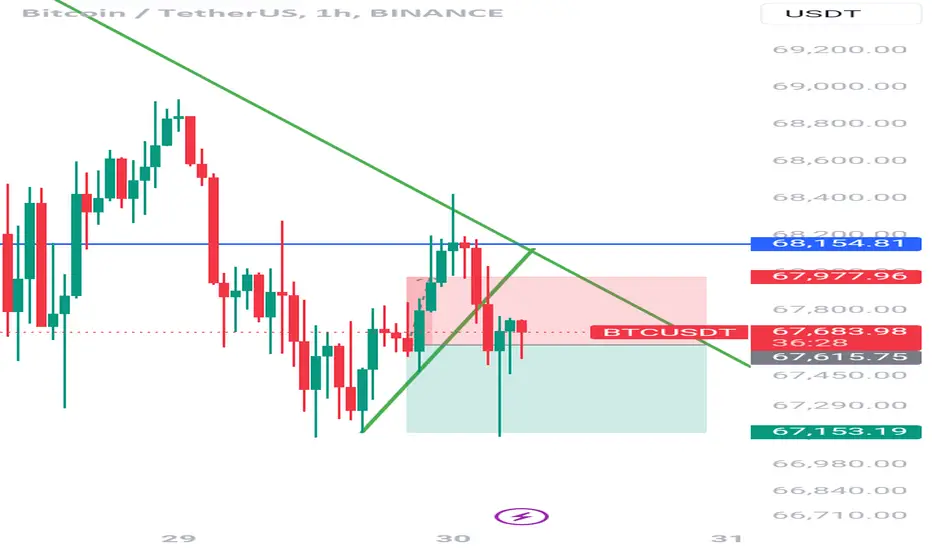
BTCUSDT SELL ANALYSIS Here on btcusdt price has been moving in lower high , lower low so it like to move down to level of 67,153.19 so going for SHORT is needed with proper risk management
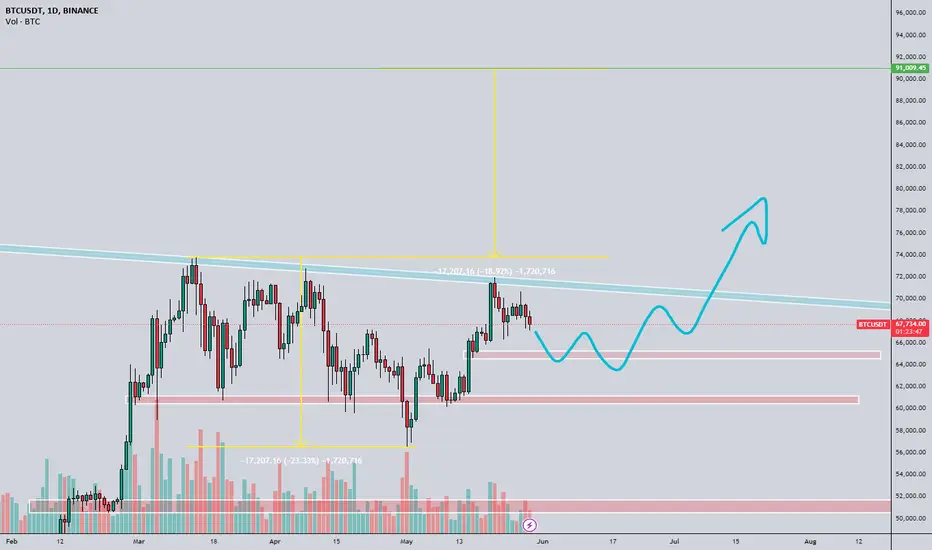
Bitcoin to 91kBitcoin is holding little down trend resistance, but it is a matter of time to break it. It is possible to see little correction to 64.5k - 65k area. Closing candle above 74k is gonna be huge sign to go up. In the end we are going to see 91k or even higher. This could be final push and after that Bitcoin could ease down a little give some chance to altcoins to go to up, to do that BTC.D ( Bitcoin Dominance ) must go down!
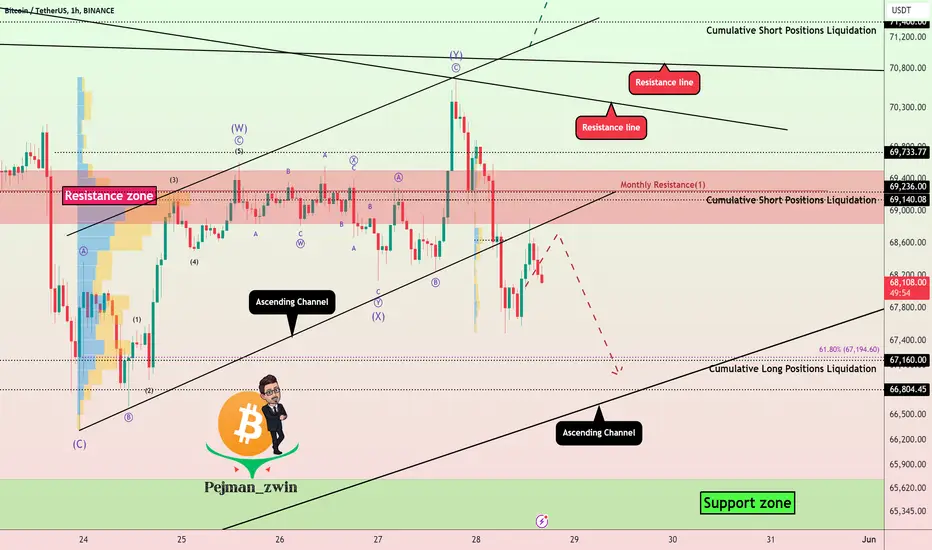
Bitcoin Analysis(More fall)After Mt. Gox moved $840 million in Bitcoin to a new wallet , Bitcoin started to fall.
Bitcoin has managed to break the lower line of the ascending channel .
According to the theory of Elliott waves , it seems that the next corrective waves have started .
I expect Bitcoin to fall at least to the Potential Reversal Zone(PRZ) .
Note: An important point you should always remember is capital management and lack of greed.
Bitcoin Analyze ( BTCUSDT ), 1-hour time frame ⏰.
Do not forget to put Stop loss for your positions (For every position you want to open).
Please follow your strategy; this is just my Idea, and I will gladly see your ideas in this post.
Please do not forget the ✅' like '✅ button 🙏😊 & Share it with your friends; thanks, and Trade safe.
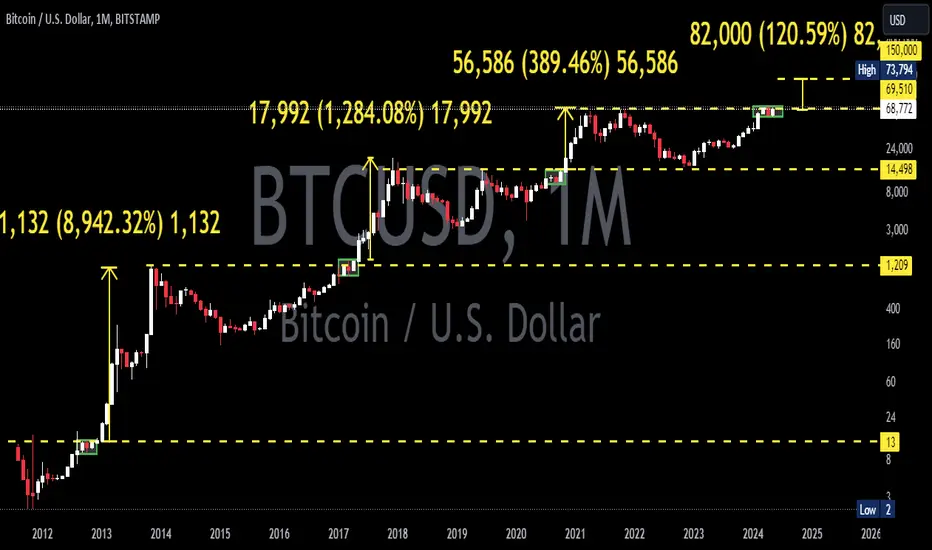
BTCUSD 1MBTC ~ 1M
#BTC We look at the history of BITSTAMP:BTCUSD as a whole as recorded on the chart.
It looks like #BTCUSD is ready to continue its upward trajectory.
This is marked by a 3 month accumulation phase.
but the bad news is, the increase will not be more than $150,000. Even if it is more, it's probably not much and it's just a bonus.
BTCUSDT Parallel Channel BreakoutBTC break the upper side of the channel, now on retesting of channel support we can take entry of Buy.
It's a long term trade(daily timeframe) so manage your risk accordingly.

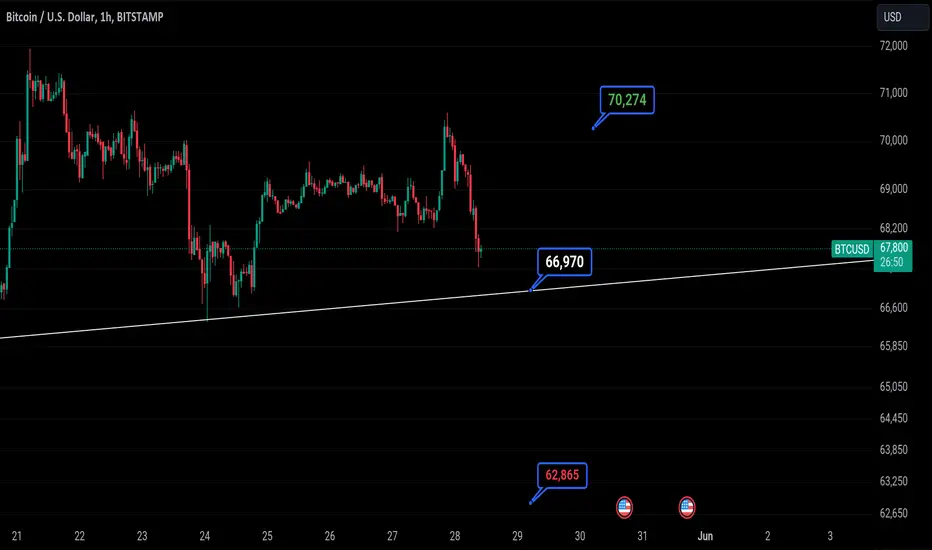
BTCUSD If any hourly closing sustains below that white line then could 📉 📉 to 62865
If it sustains above white line and a daily closing above 66970 then 📈 📈 to 70274
Any daily closing above 70274 is bullish to 📈 📈 to 77559 marked on the chart
Disclaimer:
Its a personal view not a financial advice and I assume no responsibility and liability whatever outcome arises.
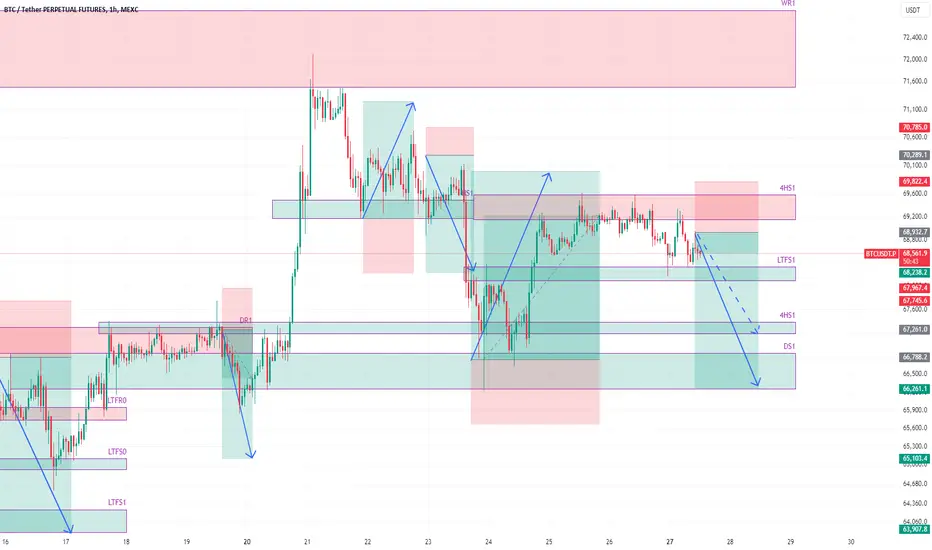
BTCUSDT at resistance and likley to head to 67.3k and 66.3kThe price is showing weakness here and seems to be inclined to go downwards. Here is a short idea based on this inclination. Next supports are 4HS1 and DS1. We take profit at 4HS1 which is the first support zone. The price may bounce there, and therefore we will reevaluate the price action there. The price may eventually then target DS1 subsequently which is a stronger support and provide very good support for the price. However, we focus on 4HS1 first and then we will reevaluate there about our next action.
BTCUSDT close to 4h support, likely to bounce towards 70kHere is a new long trade idea. The price got rejected from hourly resistance HR1 after bouncing from hourly support HS1 several times. However, on the last drop on this support, the price broke that support and went southwards. The price will likely bounce from 4h support 4HS1 and will create an opportunity for a long trade towards 4h resistance 4HR1. Lets see how it plays out. Let me know what you think in comments.

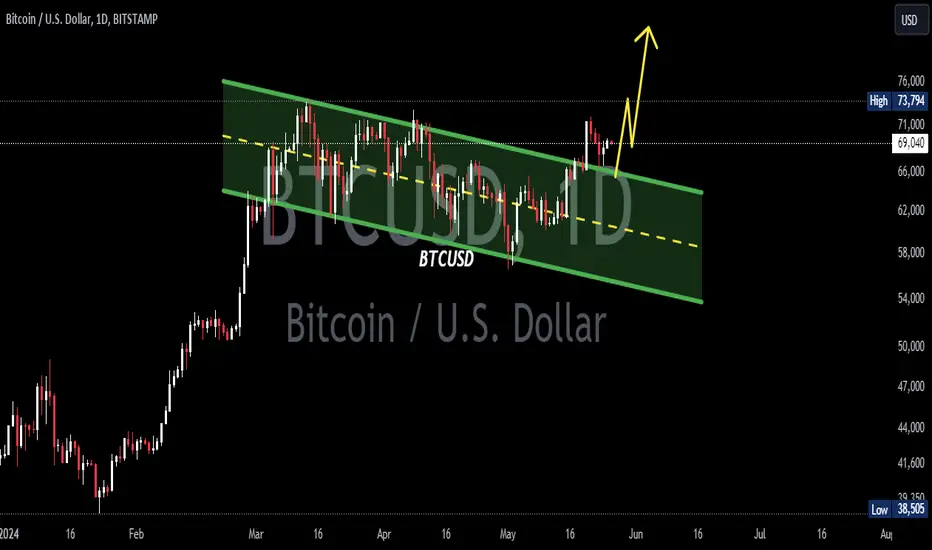
BTCUSD 1DBTC ~ Updated
#BTC Just as we expected. Price retested the Support Line of this pattern. We are still Bullish with a short term target of $80,000.
If there are changes to our plans, we will immediately update them here.
stay tuned
🚨Bitcoin will Fall by Failed Falling Wedge Pattern🚨❌ Bitcoin failed to break the 🔴 Resistance zone($65,700-$67,520) 🔴.
📈From the point of view of Classical Technical Analysis , the Failing Wedge pattern failed, and since if the reversal pattern fails , the pattern will have a continuing role , the Bitcoin fall is still expected.
🔔I expect Bitcoin to continue its downward trend after the rise to the lower line and 🟡 Potential Reversal Zone(PRZ) 🟡again.
❗️⚠️Note⚠️❗️: If Bitcoin touches $65,500 , the bullish scenario can change, I will talk about the importance of this number in the next posts .
❗️⚠️Note⚠️❗️: An important point you should always remember is capital management and lack of greed.
Bitcoin Analyze ( BTCUSDT ), 1-hour time frame ⏰.
Do not forget to put Stop loss for your positions (For every position you want to open).
Please follow your strategy; this is just my Idea, and I will gladly see your ideas in this post.
Please do not forget the ✅' like '✅ button 🙏😊 & Share it with your friends; thanks, and Trade safe.

BTCUSD 1DBTC ~ 1D Updated
#BTC It seems #Bitcoin Retesting the Support Line in this pattern.
Bulls still dominate as long as the price remains above this pattern.

🗺️Bitcoin Roadmap🗺️⏰(15-minute time frame)⏰🌐 Bitcoin seems to have started to increase under the influence of Ethereum ETF news ➕ Inflows into Bitcoin ETFs hit $237 million on Monday .
🏃♂️ Bitcoin is currently moving near the 🔴 Resistance zone($73,780-$71,920) 🔴 and the Resistance line .
🌊According to the Elliott wave theory , Bitcoin seems to be completing microwave 4 of the main wave 5 .
🔔I expect Bitcoin to Attack the Resistance zone after the completion of micro wave 4 from the main wave 5 .
❗️⚠️Note⚠️❗️: An important point you should always remember is capital management and lack of greed.
Bitcoin Analyze ( BTCUSDT ), 15-minute time frame ⏰.
Do not forget to put Stop loss for your positions (For every position you want to open).
Please follow your strategy; this is just my Idea, and I will gladly see your ideas in this post.
Please do not forget the ✅' like '✅ button 🙏😊 & Share it with your friends; thanks, and Trade safe.

BTCUSDT likely to head down from hourly resistance around 68.3kHere is a short idea. The price has bounced several times from hourly support but is likely to break it on the next drop. The price may hit hourly resistance HR1 first before that and then reverse from there triggering our short trade. The price is likely to go down towards the target of this trade around 68.3k. Lets see where it goes.
BTCUSDPair : BTCUSD ( Bitcoin / U.S Dollar )
Description :
Head and Shoulder
RSI - Divergence
Completed " 12345 " Impulsive Waves
Break of Structure
S / R Level

Hunting BTC Long Up to 72788.20hunting a long on btc. second 2w dol hasn't been reached yet at 72788.20 . H8 still delivering bullish, we are sweeping a fractal h8 low now. will long on m30 bullish cisd.

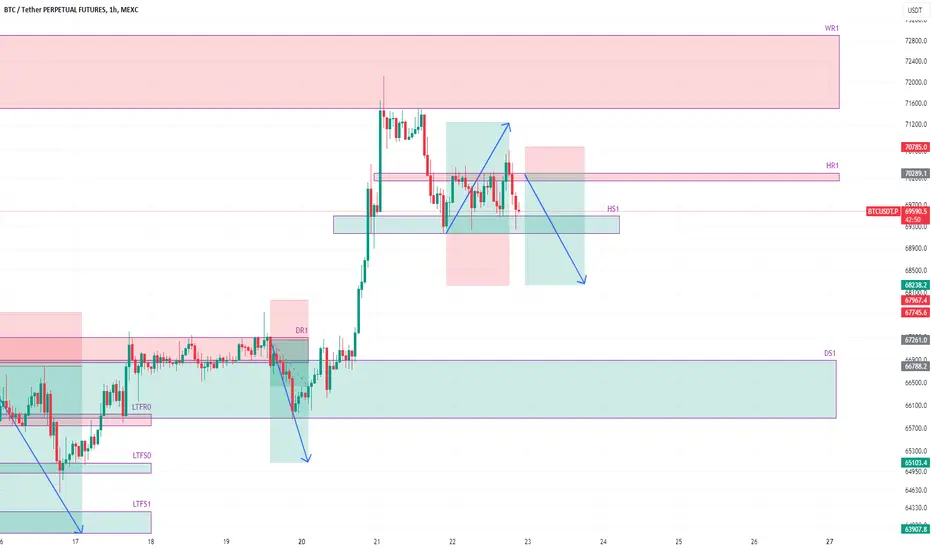
BTCUSDT at hourly support, likely to bounce towards 71.2kThe price has hit the weekly resistance WR1 and has pulled back from there. The price has been pushed down from that resistance and it has now hit hourly support HS1 on this pullback. This support zone will provide support to the price and the price is likely to bounce enough for a long trade opportunity. We try this long trade towards weekly resistance around 71.2k area. If we lose this support then we are going likely for the daily support zone.

BITCOIN Comprehensive Technical AnalysisHello everyone.
First of all I should say happy new year (Nowrooz) to all iranian people around
the world specially iranian traders community.
Im going to explain how will BTC behave in coming months according to
Elliot wave principles.
As you know wave analysis act better in higher timeframes like Weekly.
So I want to take a look at BTC price action from Nov 2022 that new Elliot Motive wave starts.
You can see the end of wave 3 of a 5 wave move in picture below:
so we are now in the end of a wave 3 in 161.8% fibonacci projection level from the end of wave 2.
furthermore we will have price correction as wave 4.
this wave 4 can be end in 57000 level that is a strong support level and most Fibo retracement levels compress here.
there are a lot of reasons that we will have a bullrun in coming months :
The most important one is Bitcoin Halving and the second one is inflows from approved ETFs
and last one is expected Federal rate cuts.
In chart below you see the overlay levels of Fibo that price will target soon.
Overall in my opinion after a correction to 57000 level as wave 4 , price will go forward to 3 targets ahead as wave 5 (100% level of wave 1) : 85000 , 100000 and 115000.
the most probable target level is 115000 (100% Fibo projection of wave 1)
after that price will correct till the range of wave 4 means 57000 again.
this level (I mean 57000 to 60000) will convert to a strong support level after the price correction.
Hope you like this opinion.
you should make decision on your own opinion but I will be happy if you share your views in comments with me.
Thank you for reading this analysis.
Have good trades

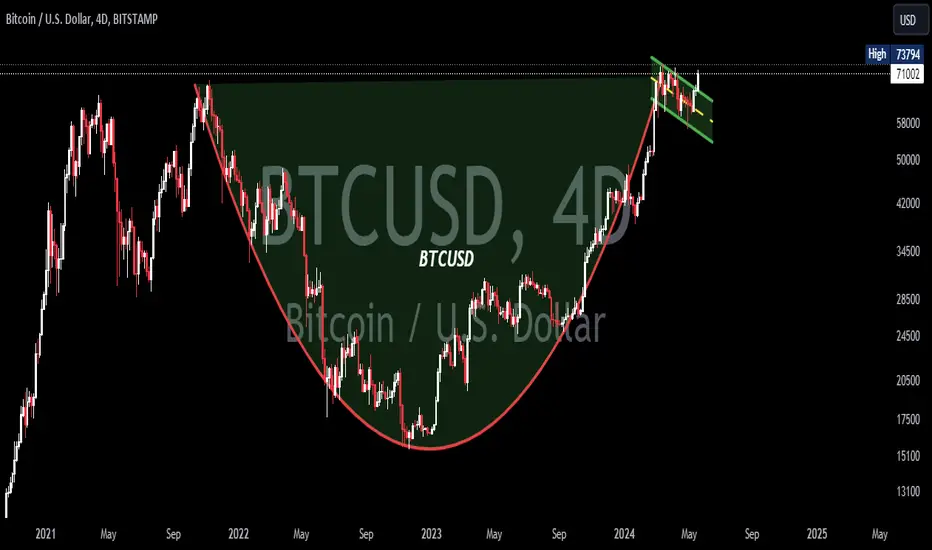
BTCUSD 4D BTC ~ Updated
#BTC Successfully broke through the resistance line of this bull flag pattern.
It looks like a new ATH will form again soon.
We are targeting $80,000 for the new ATH.
BTCUSDT: 80K On The Way! Dear Traders,
BINANCE:BTCUSDT recently ranged between $60000 to $65000, however, price created lower low and then lower high and failed to continue the pattern, in other terms price took our the sell side liquidity and then after price early mitigated. Currently we are expecting price to continue the bullish momentum until it reaches 80k
**If you like our work then please do like and comment, it will encourage us to bring you more ideas. Thanks everyone for your continuous support**
