"Bitcoin Seeks SEC Decision Support"Bitcoin, trading at $28,538 at the time of writing, grabbed headlines on Monday due to a spike caused by fake reports. The cryptocurrency surged over 10% before dropping to $28,500, triggering a $86 million short-selling liquidation. Despite the truth emerging, the ETF saga continues. The Securities and Exchange Commission (SEC) is set to announce its decision regarding Fidelity, VanEck, and WisdomTree's spot ETF registrations on October 17 (today). According to Bloomberg ETF analyst Eric Balchunas, approval might be delayed until January 2024.
Even in correction, Bitcoin may dip to $27,418, maintaining its leading position in the uptrend. However, losing this support, along with the 50, 100, and 200-day Exponential Moving Averages (EMAs), could invalidate the bullish case, pushing the cryptocurrency below $27,000 and towards $26,483.
Stay tuned for updates on Bitcoin's evolving situation.
Btcusdtanalysis

BTC btttom 18k1D time frame
-
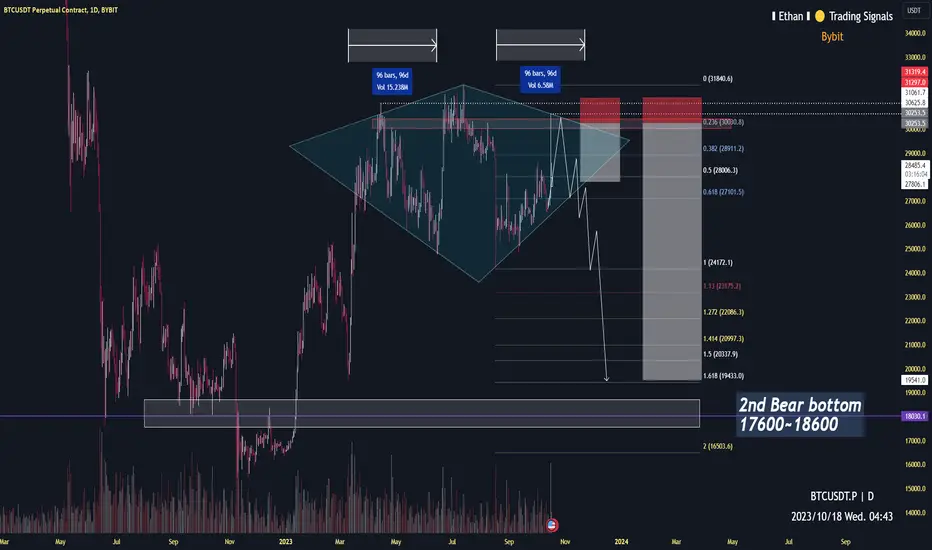
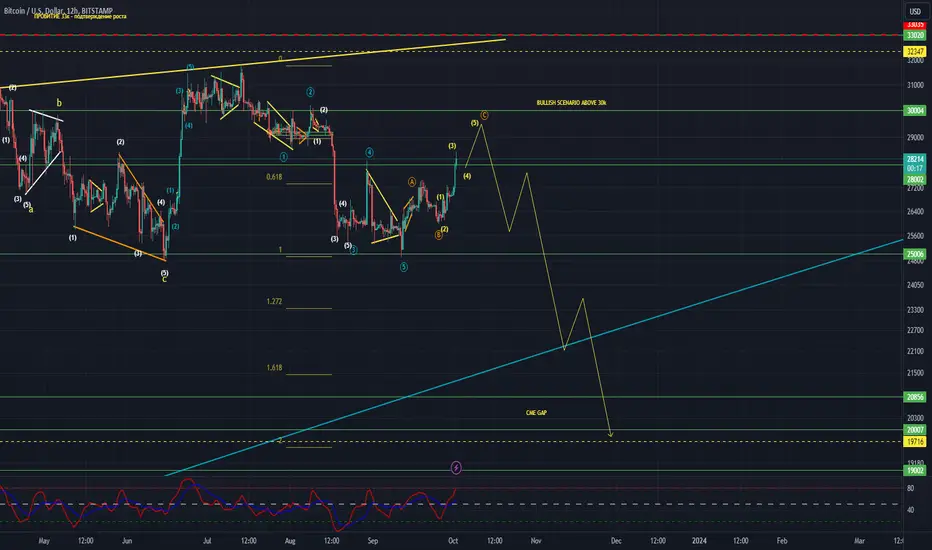
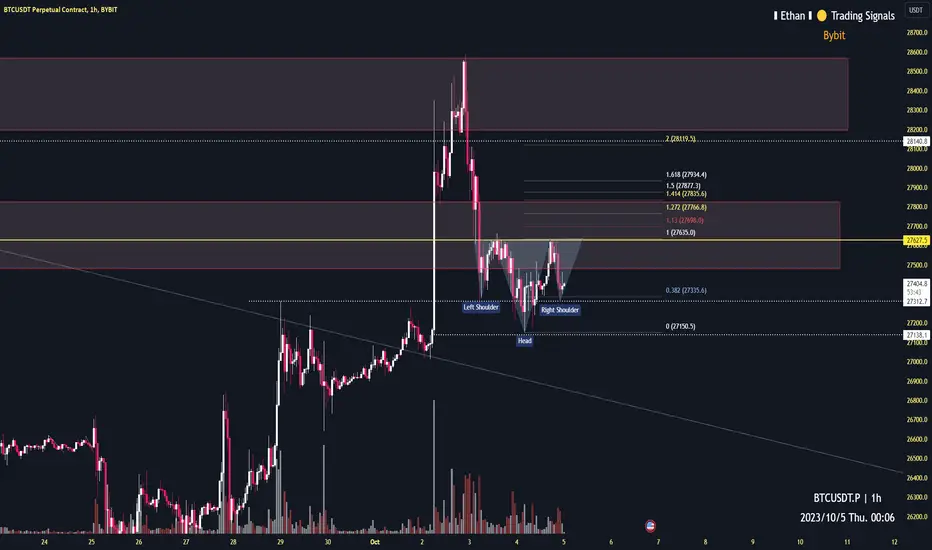
With the fake new(BTC ETF approval) released, Bitcoin matched our previous analysis by unexpected trend on 16th October. Currently, Bitcoin is creating a potential Diamond structure, which is a top structure here, and it could be regarded as Head and Shoulders structure(ref.1).
According to this Diamond, Bitcoin might retest 30k again in near future, and start going down by December, once Bitcoin breaks below this diamond, huge dump will be following. There are four targets for the trading plan.
TP1: 28000
TP2: 25000
TP3: 19500~21000
TP4: 17600~18600
Range 17600~18600 is the bear bottom I think. On the basis of time structure, we can see this price around December '23~January '24, get ready for this sweet price!
Ref.1 Bitcoin analysis about HS structure and bear bottom.
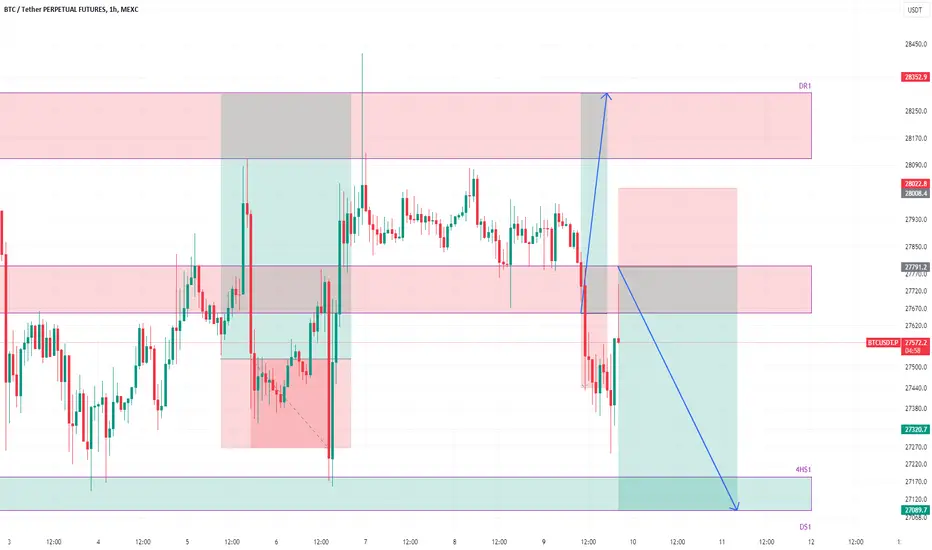
BTCUSDT likely to bounce from 4h support towards 28536Here is a long idea for BTCUSDT. The price has been trending down after the peak it has made. The price bounced from hourly support but got rejected from 4h resistance 4HR1. It seems that the price is heading to the next support which is 4h support 4HS1. This support shall provide bounce for a long trade and therefore a long trade is favorable from there. The target of this long trade should be the 4h resistance 4HR1 which is sitting around 28536.

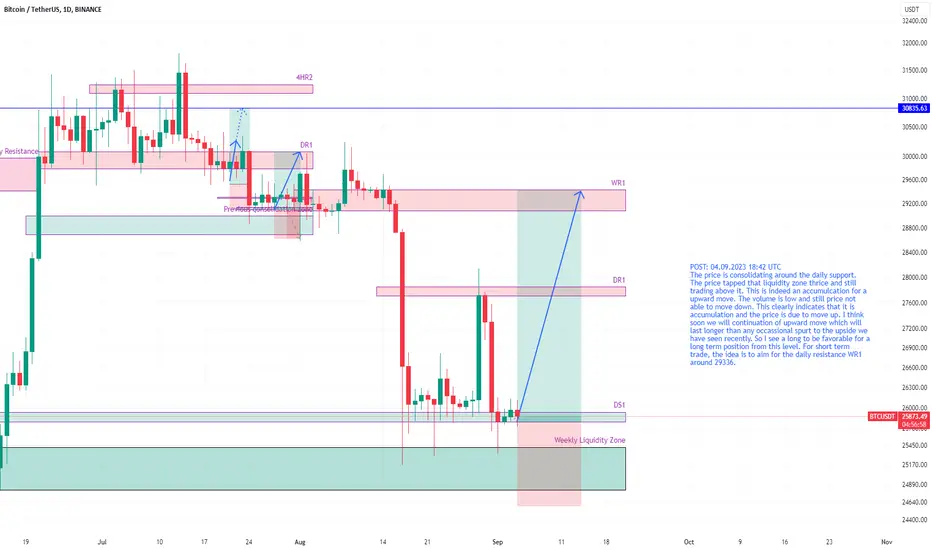
BTCUSDT accumulating for big move upto 29336The price is consolidating around the daily support. The price tapped that liquidity zone thrice and still trading above it. This is indeed an accumulcation for a upward move. The volume is low and still price not able to move down. This clearly indicates that it is accumulation and the price is due to move up. I think soon we will continuation of upward move which will last longer than any occassional spurt to the upside we have seen recently. So I see a long to be favorable for a long term position from this level. For short term trade, the idea is to aim for the daily resistance WR1 around 29336.
Bitcoin's Wild Ride Amid ETF RumorsBitcoin's price surged by 10% in the early hours of New York trading after news broke that the U.S. SEC had approved the iShares Spot BTC ETF. However, this uptick was short-lived due to the confirmation that the news was false.
Long-time traders who had opened short positions faced significant losses, with nearly $80 million in short positions liquidated, alongside about $18 million in long positions. This reaction could signal a potential market crash if the U.S. SEC indeed approves the immediate BTC ETF, an outcome it's currently considering. The false rumors pushed Bitcoin's price down to the $28,000 range, with the Relative Strength Index (RSI) holding above 50.
The unusually long daily candlestick resulting from these mistaken speculations resembles a true 'exhaustion candle' and might indicate an upcoming reversal in the short-term uptrend, hinting at vulnerabilities ahead. Bitcoin's price could lose its entire foundation by October 16, potentially dropping below the psychological support level at $26,000. Breaking below this trendline would confirm even deeper losses.
Only a daily candle closing above the resistance level at $29,747 could confirm the uptrend, paving the way for an extension towards the psychological level of $30,000. In a strong bullish scenario, Bitcoin might surpass July's peak, reaching the upper range of $31,804. Such a move would represent a 15% increase from the current level.
Stay tuned for more updates as Bitcoin navigates these volatile market conditions.
BTC will history repeat?1D time frame
-
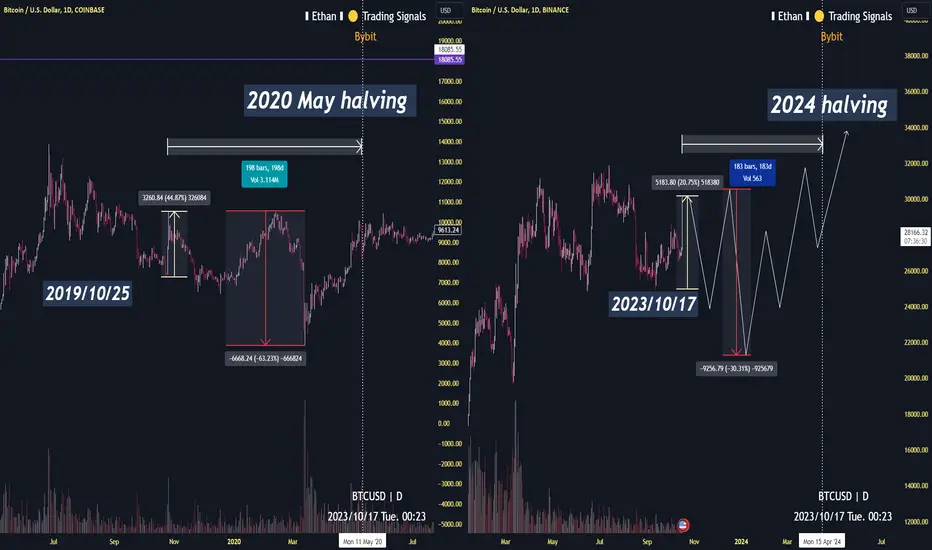
According to left chart, Bitcoin pumped rapidly on 25th Oct '19, which date range was around 198 Days away from 2020 halving, Bitcoin increased by 45% in two days.
Next, Bitcoin made a waterfall over 60% since Feb '20, then Bull market was triggered.
Nowadays, Bitcoin extremely increased by 20% in Oct '23, and we need around 200 Days to reach next halving in 2024. All phenomenons are similar to 2019, so we can expect a huge dump based on previous analysis of Bitcoin top structure(refer to below links). Therefore, stay patient and get ready to buy spot!
Accurate Bitcoin analysis about top structure and bear bottom.
Bitcoin PRZ analysis of Harmonic pattern.
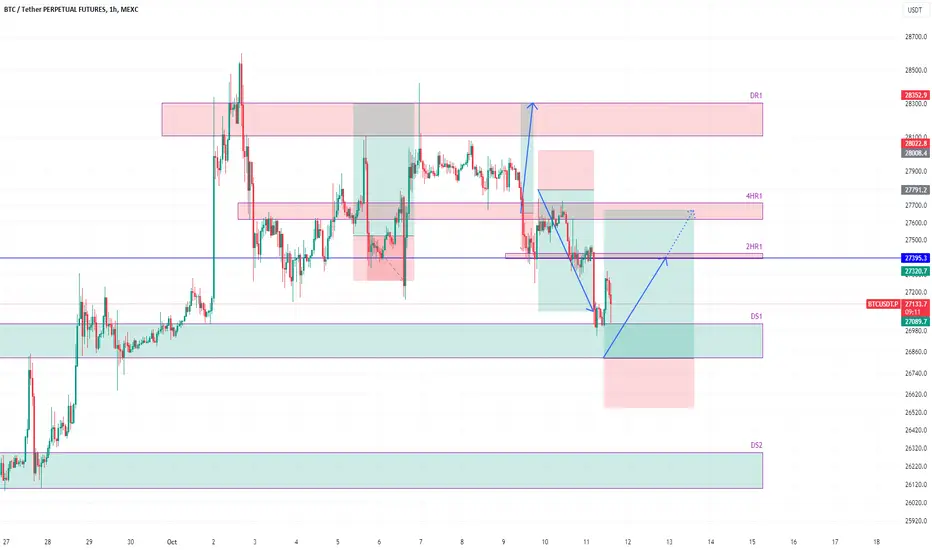
BTCUSDT at daily support and likely to head up to 27636The price has hit the daily support. I think this daily support will hold the price and stop it from moving downward for now. This creates a favorable condition for a long trade as the price is likely to bounce from this support. The price migh go deep further into this support zone so I will slowly build the position as the price moves into this zone. There are two targets for this trade. One target is the hourly resistance around 27396 where the price will face some resistance and pullback. Therefore offloading some size here and then adding again on pullback is favorable. The final target is the 4h resistance 4HR1 around 27636.
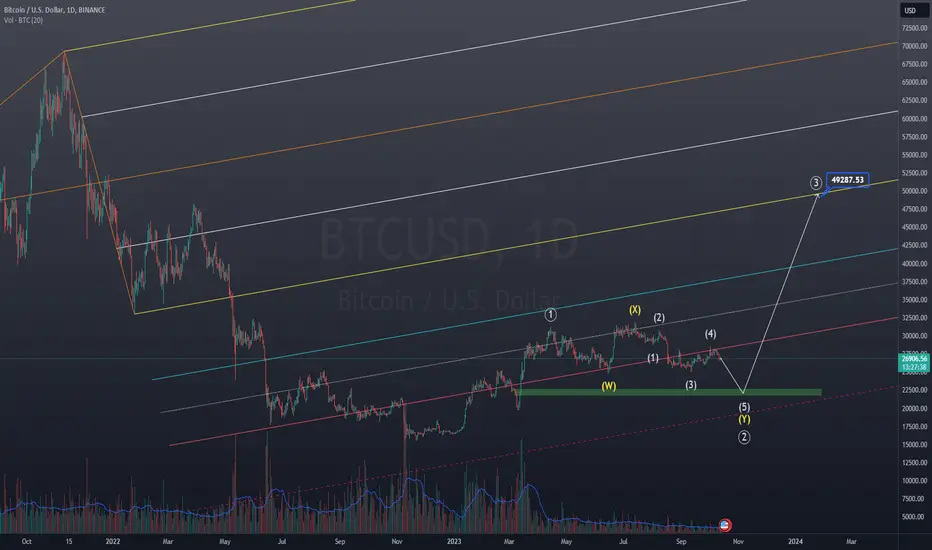
BTCUSD Trend AnalysisExpecting a fall of around 17% towards 22000 level as per the WXY correction after which a massive 120% rally will happen towards 49000 level.
This 17% fall will sweep the liquidity to fuel the upside move and is highly likely to happen.
This is in correlation to Crypto Total Market Cap which is linked below.
Good to look for investment opportunities during this fall instead of panicking.
This is not a buy or sell recommendation, do your own due diligence before taking any action.
Peace!!
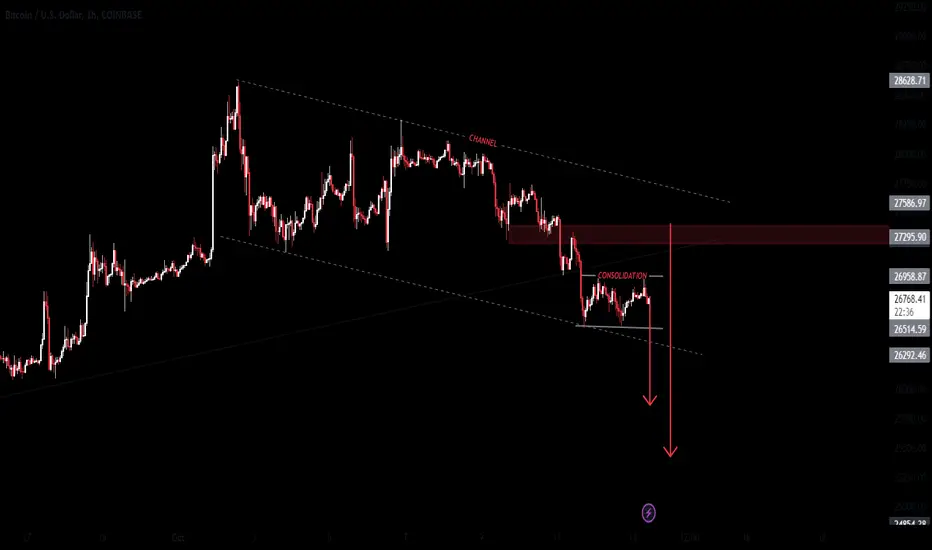
BTCUSD 13/10 MovePair : BTCUSD ( Bitcoin / U.S Dollar )
Description :
Bearish Channel in Long Time Frame and Rejection from the Lower Trend Line and making Consolidation Phase in Short Time Frame if it Breaks Upper Trend Line then it can Reach its Previous Support or Upper Trend Line of Channel
Entry Precautions :
Wait until it Breaks UTL or LTL
BTCUSDT Elliott Waves AnalysisHello friends.
Please support my work by clicking the LIKE button👍(If you liked). Also i will appreciate for ur activity. Thank you!
Everything on the chart.
Im waiting for decreasing in 21-19k zone, then trend reversal.
Good luck everyone!
Follow me on TRADINGView, if you don't want to miss my next analysis or signals.
It's not financial advice.
Dont Forget, always make your own research before to trade my ideas!
Open to any questions and suggestions
Bitcoin consolidates at short-term support, $30k is the targetBitcoin has a bullish structure on both the daily and the 4-hour chart. The retracement to $27.2k collected liquidity and the bulls have since driven prices to $27.6k.
The H4 bullish breaker block at $27.2k was respected as support so far. Given the daily structure, a consolidation around the FWB:27K region over the weekend before another leg higher was possible. The OBV has inched higher over the past week, showing the bulls had a slight advantage
Entry: $27.4k (another revisit to FWB:27K or lower was possible)
Take-Profit: $29.6k (local resistance on the 1-day chart)
Invalidation: $26.6k (a move below the bullish breaker block)

BTCUSDT at resistance, likely to head down to 27066-27166The previous long trade did not work out as the price fell below the support we were expecting to hold the price. Now the price has come up to test that support area which is now acting as resistance. The price may move further down to the 4h support 4HS1.
BTC excellent short entry 29k12h time frame
-
Bitcoin dumps 1.5% today, and many people think the huge dump is coming. However, if we take a look at the uptrend since 24901 on 12th Sep, this uptrend line has not been broken yet which means Bitcoin is still on the upward way. Combining with 0.618 Fibonacci Projection, there is a structural support around 27000~27300. Therefore, we can set up a trading plan once Bitcoin reach and get support at that zone, and target is 29000~29500, also the excellent entry to open short as we pointed out in previous Bitcoin two analysis: the critical pattern-Head and Shoulders(ref.1) and PRZ of Harmonic pattern(ref.2). Both targets are 18500~15800.
-
ref.1 Head and Shouders
ref.2 Harmonic pattern

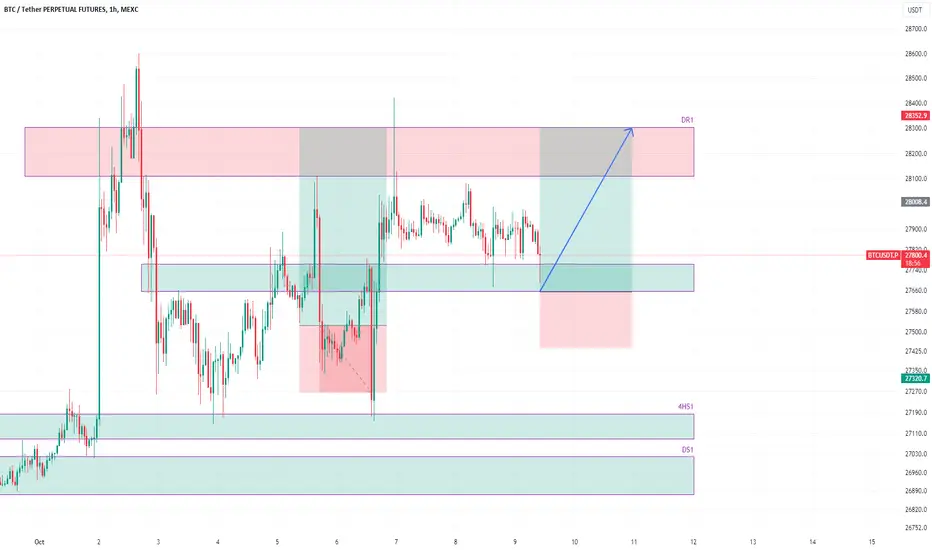
BTCUSDT at suport, likely to bounce to daily resistanceHere is a long idea for BTCUSDT. The price is at support level. It has visited this support before and bounced from there and now it is a revisit of that support. I expect the price to bounce here towards the daily resistance DR1 again.
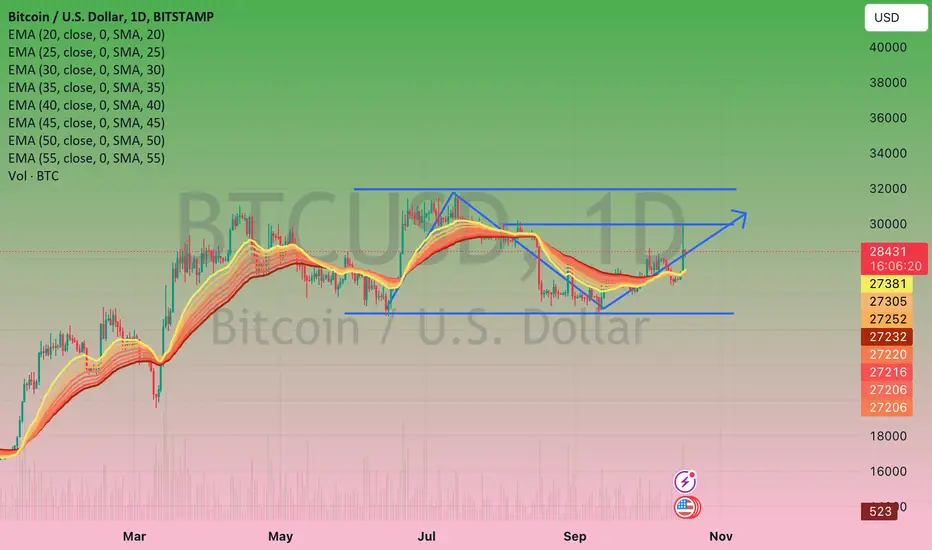
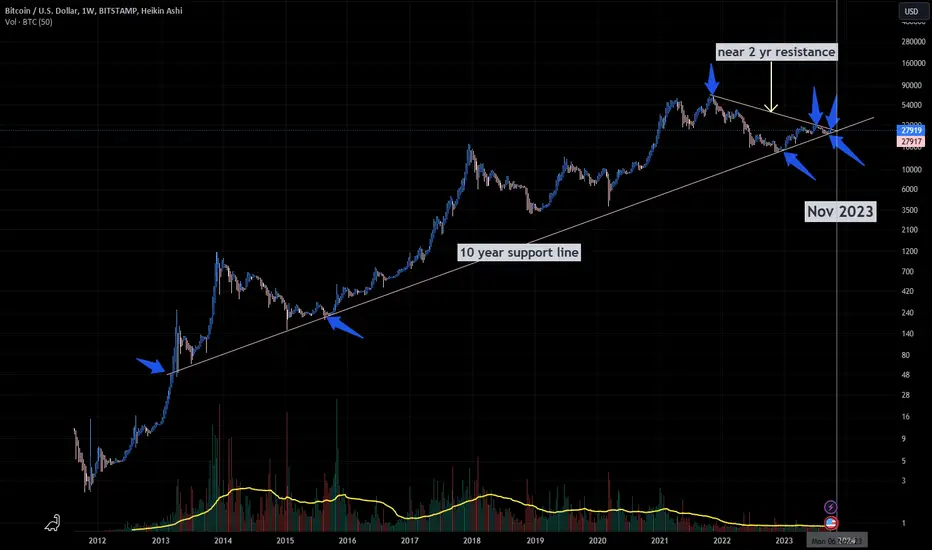
CRUCIAL MONTH FOR BTC TRIANGLEA monumental move could happen at any time in these upcoming weeks. In this weekly chart of BITSTAMP:BTCUSD , the historic triangle or the apex dating back from 2013 is nearing an end. This upcoming month should be a decisive point for the coin, and we should be mindful of it.
From a technical analysis perspective, the triangle consists of a nearly two-year-old resistance and a decade-long support line. Recently, we saw the Bitcoin price stabilization between the 26 to 28k range because of that very strong trendline.
Within the apex from approximately the 1st to 2nd week of November, we should expect outcomes by looking at it in the big picture. We're nearing the end of it, and let's keep in mind, it's a matter of time and patience.
I'm considering bullishness considering the historical monthly return data, the -ber month of October to December is great for Bitcoin, so I'll keep it as that. It is an exciting time for us traders because it's a long time coming for many, and we expect a massive price movement.
What would be the next move? Since I'm bull-biased for upcoming weeks, I will wait for the breakout of the triangle, and then the $29,000 resistance line before entering a possible position entry. If a breakdown happens, short upon confirmation and possibly take profit using fib line areas.
I would like to know your opinion since you reached the end, which trendline should break? The young or the old? Let me know in the comments below. As always, plan your trades as this is a potential long-term movement moving forward, happy trading and in advance, happy holidays :)
BTC target 29k in October4h time frame
-
According to previous analysis about Butterfly pattern on Bitcoin(ref.1), there is a PRZ around 29000~29400. Today, we are going to talk about the time analysis, if take a look at the analysis about Bitcoin bear bottom (ref.2), a potential top structure-head and shoulders was pointed out in that post. Further, separating the left shoulder into two waves, from the dumping wave(31000~24700) took 62 days to create. This date range allows us to estimate the time that right shoulder needs, and the best timing to reach RS top is before end of October.
Obviously, once Bitcoin start pumping and going into PRZ, we can open short there, and there are two scenarios(white & blue trend), I will talk about these two potential scenarios, including target, stop loss and risk in near future
ref.1
ref.2

BTCUSDT likely to head towards daily resistance at 28106-28306The price breached through 4h resistance 4HR1 after being pushed down initially on the test of this resistance from below. Now it has retested this resistance and this resistance is going to probably act as a support. And therefore, the price is going to go higher from there. This makes a conducive environment for a long trade on this pair. The target of this trade should be daily resistance DR1 which is sitting around 28106-28306.

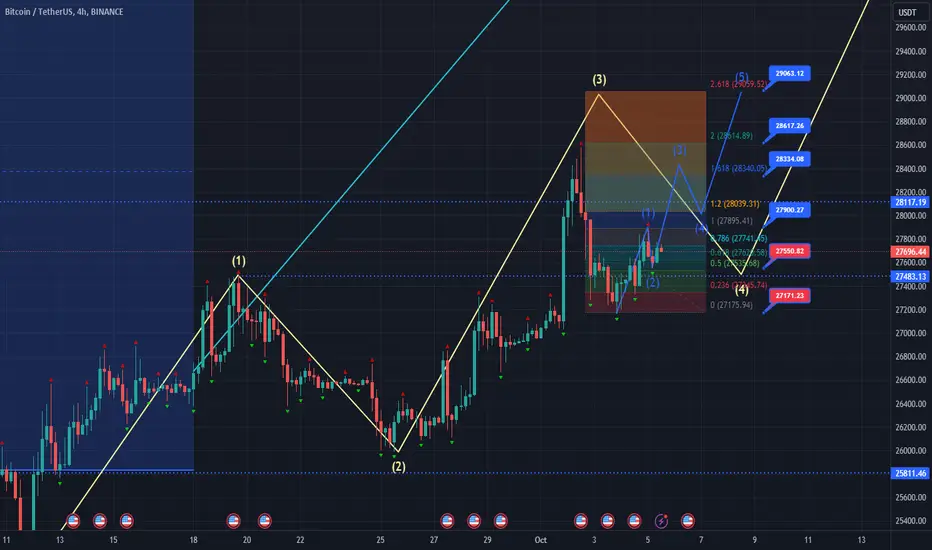
BTCUSDT - H4BTCUSDT
Formation of a three-wave structure, which can give further upward movement to the targets 29063 (The previous analysis worked)
What can you expect now?
Further movement along the trend.
You can consider entering from current levels or breaking through the level of 27900
Targets 28334 - 28617 - 29063
BTC small Heand and Shoulders1h time frame
-
Bitcoin broke the downtrend line on 2nd Oct. Currently, Bitcoin is retesting to search R/S balance zone, also is creating a potential HS on 1h time frame, which is good for retesting structure because it shows potentially available support. However, we need to consider the possibility of longer consolidation, so this bottom HS trading plan will only be triggered while breaking neckline at 27650.
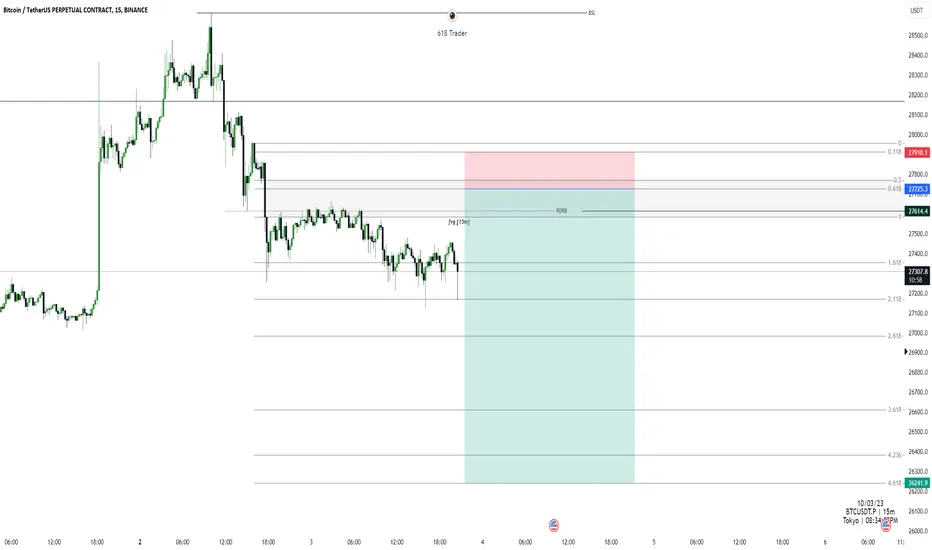
RDRB and FVGhere is the 15m time frame chart, there is 15m fvg and price reacted well on the fvg.
when you switch to 4h time frame the 15m fvg level is the RDRB level Redilevered Rebalanced.
that is the support ideas for this plan
BTC is on the critical support1D time frame
-
Bitcoin has huge volatility in these two days, pumped high and wend back soon. This scenario means bear for most people, but if we take a closer step, Bitcoin is currently on the support zone(27150~27300), which is made of a consolidation on lower time frame. Also, Bitcoin has the probability creating the Break and Retest trend, if getting support well here, we can still aim to higher target(29000~30000)

BTCUSDTDear traders,
Bulls have repeatedly failed to price push higher, indicating a further drop expected.
This also applies to other major CRYPTO PAIRS. Due to strong USD presence in the market.

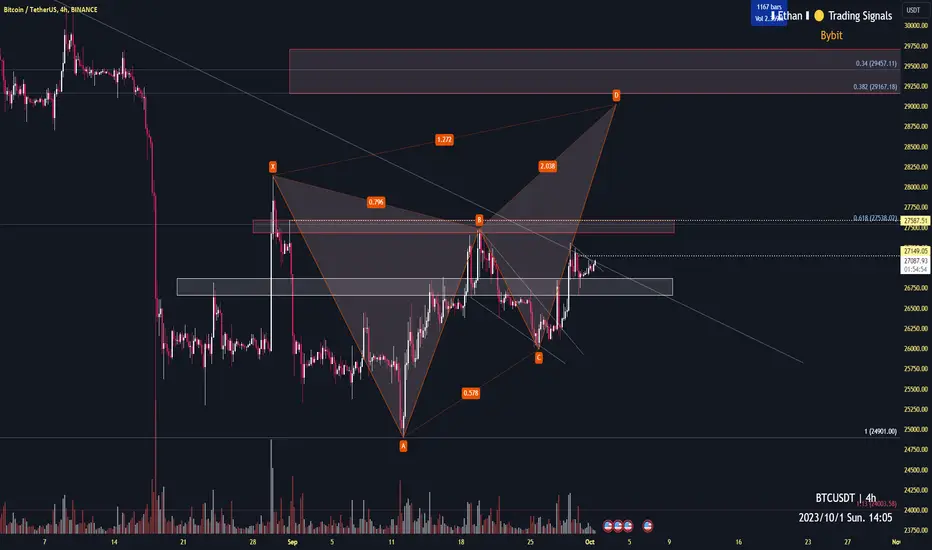
BTC Butterfly Pattern (entry 29100)4h time frame
-
Bitcoin is approaching the falling trendline which Ethereum already broke out, so we can predict Bitcoin tend to go upside in near future. Also, Bitcoin is creating a potential bearish harmonic pattern_butterfly, which utilize 1.272 Fibonacci Projection to estimate PRZ at 28900~29100. Further, combining our previous analysis of potential Head and Shoulders structure, the top of right shoulder might appear at the range 29150~29500. Therefore, once Bitcoin maintain this pumping momentum and go into this zone, we can observe whether reversal PA appear, then it could be the best short entry before this bear bottom.