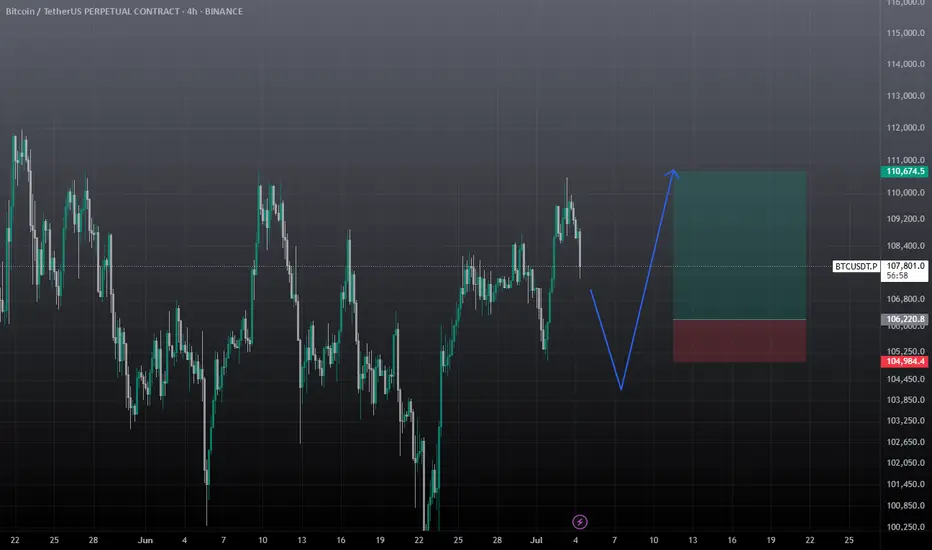
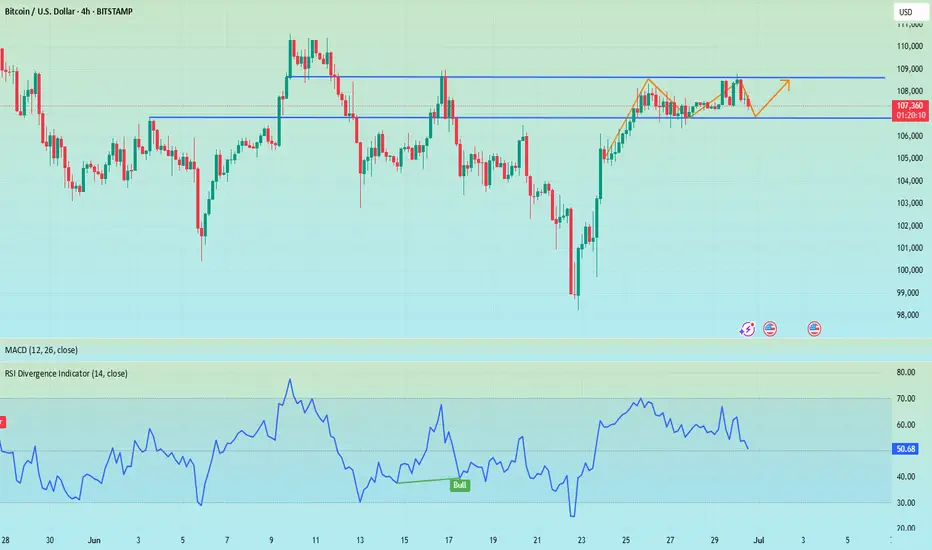
BTC Trade SetupBTC will not take any major correction until it sweeps upside liquidation and close with big red candle, So take the long only on BTC. Wick possible below the SL. I will hold the trade without sl if it comes to entry, if tp achieved first then ignore the trade. Also July breakout possible for BTC, July always positive for BTC, let's see.
Btcusdtanalysis
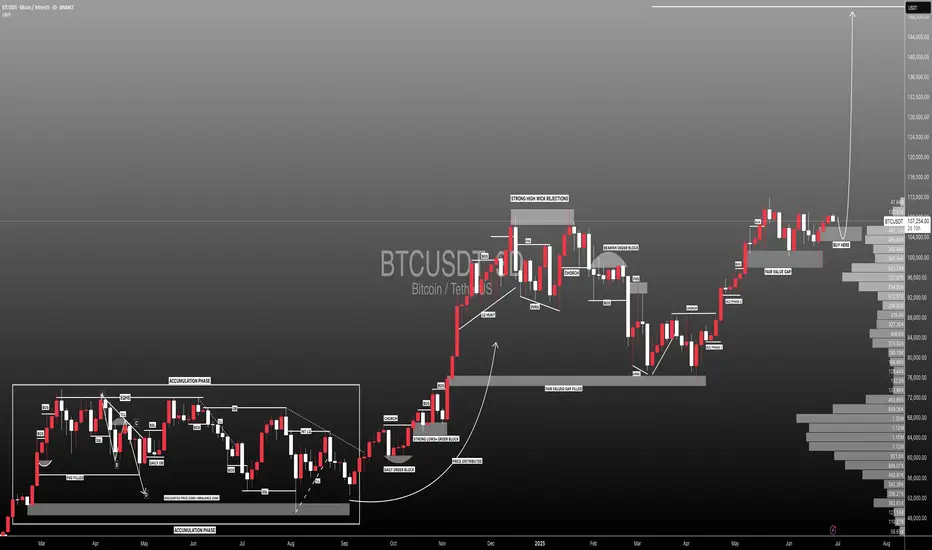
#BTCUSDT: First $120,000 Then $140,000 Swing Move.Bitcoin has accumulated successfully and is currently on the verge of entering the next price zone, which is 120k, followed by 150k. There’s only one entry zone to consider. We’re confident that the price will move as planned, but it’s not guaranteed. Before taking entry, please conduct your own analysis.
If you like our work, please like, comment, and share.
Team Setupsfx_
❤️🚀
BTC SCALP TradeWait for the entry then take with small amount no high risk must use SL. If BTC don't retrace towards 106.5k in coming hours then don't take risk on shorting it will breakout towards 113k
Long positions have achieved profits, BTC market outlook📰 News information:
1. Pay attention to the trend of gold and US bonds
📈 Technical Analysis:
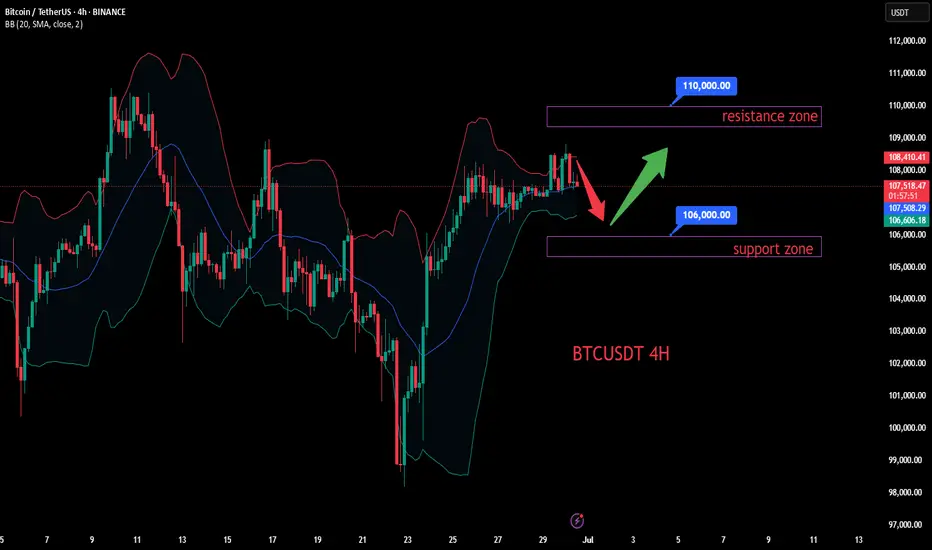
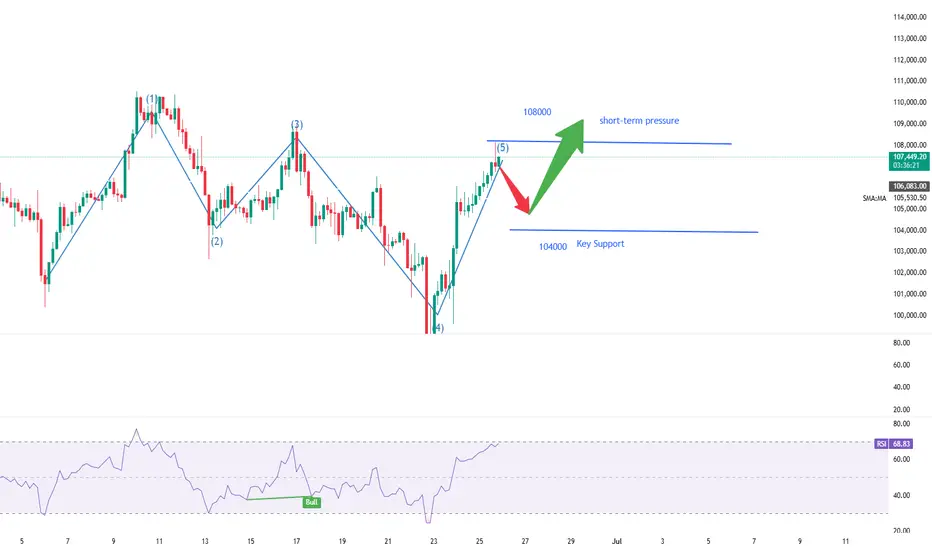
At present, BTC has rebounded and profited, and rebounded to around 108,000 again. 109,000 is also the upper track of the Bollinger Band. There is a certain suppression in the short term. Before the suppression fails to break through effectively, BTC may still fall into a weak and volatile market. If BTC hits resistance and pressure above 108,000-109,000 during the day, you can consider shorting. In view of the current volatile market, everyone must strictly control their positions, use leverage prudently, and do a good job of risk management to cope with market uncertainties.
🎯 Trading Points:
SELL 108,000-109,000
TP 107,000-106,000-105,000
In addition to investment, life also includes poetry, distant places, and Allen. Facing the market is actually facing yourself, correcting your shortcomings, confronting your mistakes, and strictly disciplining yourself. I hope my analysis can help you🌐.
TVC:GOLD OANDA:XAUUSD FX:XAUUSD FOREXCOM:XAUUSD PEPPERSTONE:XAUUSD FXOPEN:XAUUSD
BTCUSDT - UniverseMetta - Signal#BTCUSDT - UniverseMetta - Signal
D1 - Formation of the 3rd wave + potential exit from the channel. Stop behind the minimum of the 2nd wave.
Entry: 107481.70
TP: 111110.12 - 115670.15 - 119641.79 - 126457.32
Stop: 104882.98

BTCUSDT Trade SetupBTC Still in sideways no major move, wait for the entries. While on weekly tf still expecting a final shakeout, 95-93k then a final leg up towards to 120k. For now wait for the entries to be filled first then must use sl.

Analysis and layout of BTC trend in the third quarter📰 News information:
1. Pay attention to the movement of the cryptocurrency market
2. The impact of DAA, etc.
📈 Technical Analysis:
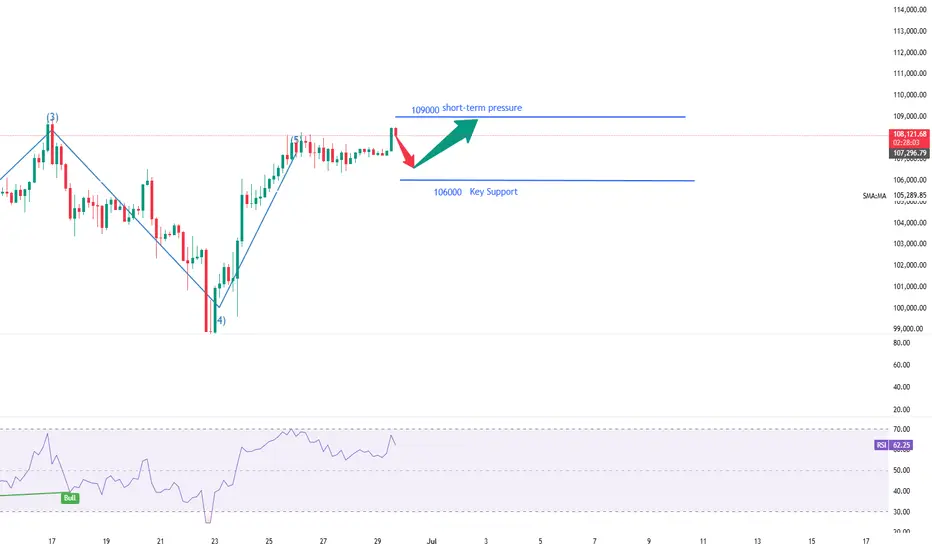
As demand weakens and supply pressure rises, BTC's network valuation exceeds the speed of activity. Exchange inflows and negative DAA divergences indicate that despite price stability, the risk of selling remains. Currently, BTC is experiencing a retracement after a rebound. In the short term, it is still possible to retrace to 106,500 and then rise after stabilizing.
🎯 Trading Points:
SELL 108000-107500
TP 107000-106500
BUY 106500-106000
TP 107500-108000
In addition to investment, life also includes poetry, distant places, and Allen. Facing the market is actually facing yourself, correcting your shortcomings, confronting your mistakes, and strictly disciplining yourself. I hope my analysis can help you🌐.
BTCUSDT:Sharing of the Latest Trading StrategyAll the trading signals last week have resulted in profits!!! Check it!!!👉👉👉
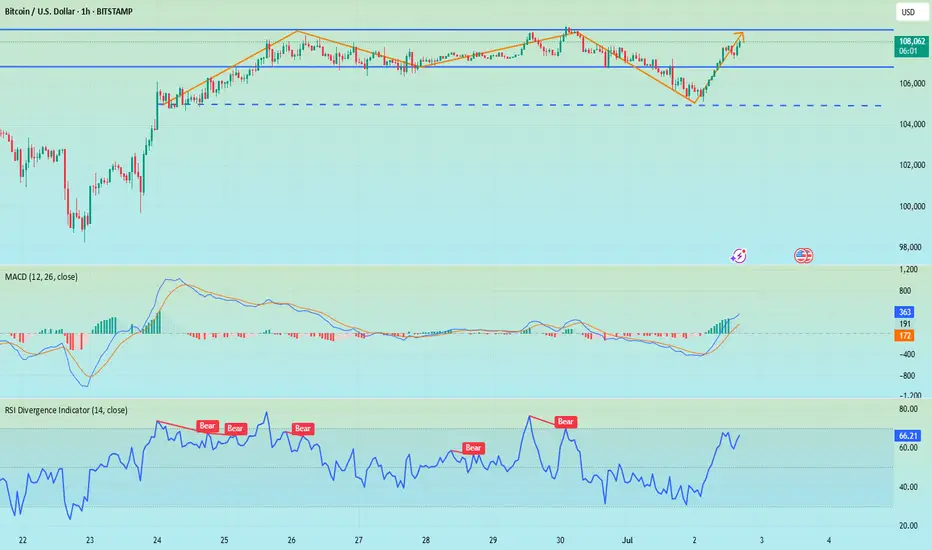
Bitcoin Technical Analysis (4-Hour Chart):
Price remains within an ascending channel. The MACD above the zero line with expanding red histograms indicates bullish dominance. After firmly breaking above the key resistance at $105,000, price is testing $110,000.
Caution: The RSI near 70 has entered overbought territory, increasing short-term pullback risks.
Support levels: $106,000 and $105,000.
Trading Recommendation for Aggressive Traders
Consider light long positions near $106,000 on pullbacks, with stop-loss set below $105,000.
Trading Strategy:
buy@105000-106000
TP:108000-110000
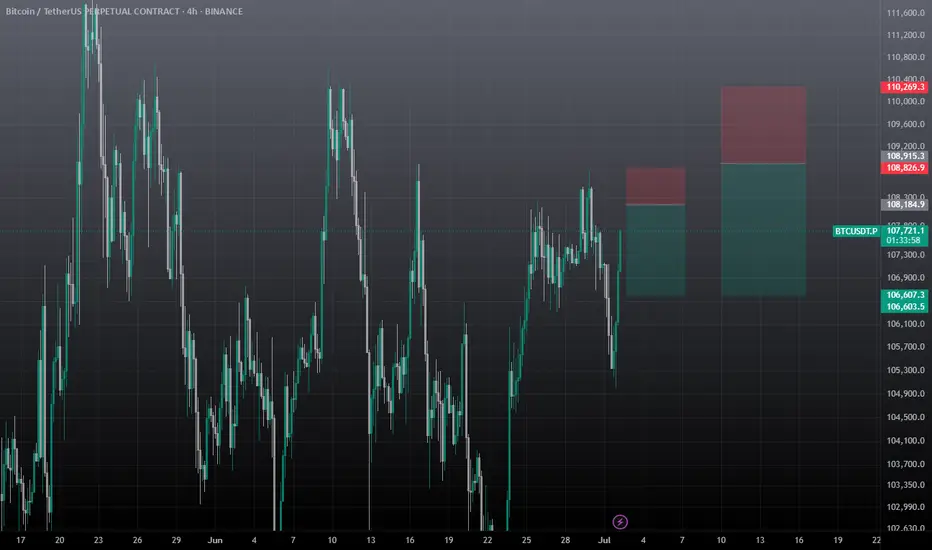
BTCUSDT Hello traders. Wishing you a great start to the week!
This week’s first trade opportunity comes from the BTCUSDT pair. Over the weekend, the pair showed significant volatility, dropping from 108,776 to 107,565 in just a few hours. However, I see this drop as a potential buying opportunity.
In my view, the price is likely to bounce back towards the 108,930.12 level in the short term. Therefore, I’ve activated the trade and I’m sharing the details with you below:
🔍 Trade Details
✔️ Timeframe: 1-Hour (H1)
✔️ Risk-to-Reward Ratio: 1:3.20
✔️ Trade Direction: Buy
✔️ Entry Price: 107,590.73
✔️ Take Profit: 108,930.12
✔️ Stop Loss: 107,181.36
🕒 If momentum weakens or price consolidates in a tight range, I will keep this trade open only until 23:00 (UTC+4). After that, I’ll manually close it—whether in profit or loss—based on how price action evolves.
🔔 Disclaimer: This is not financial advice. I’m simply sharing a trade I’ve taken based on my personal trading system, strictly for educational and illustrative purposes.
📌 Interested in a systematic, data-driven trading approach?
💡 Follow the page and turn on notifications to stay updated on future trade setups and advanced market insights.

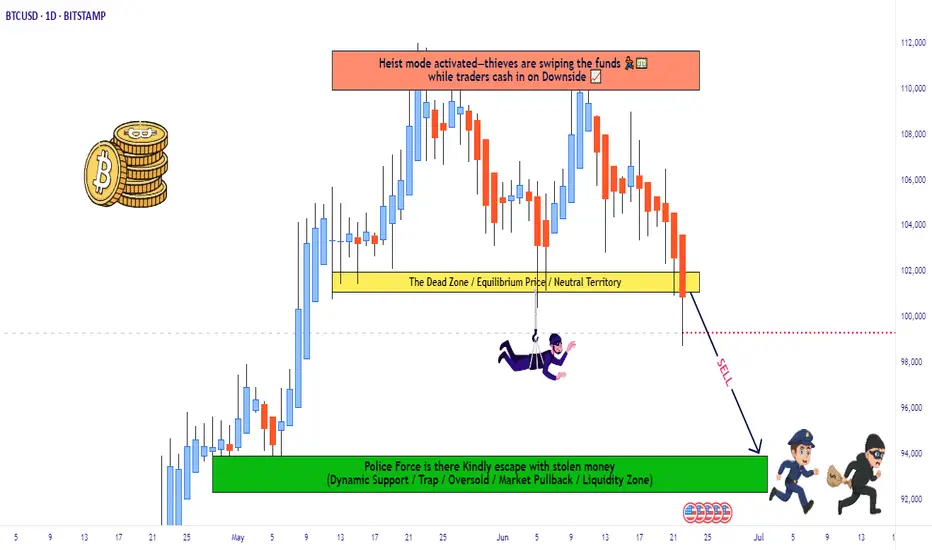
Thief Trader Setup: Robbing the BTC/USD Market Reversal🏴☠️💰 Bitcoin Heist Blueprint: BTC/USD Robbery Plan by the Thief Trader Crew 💰🏴☠️
(Swing & Day Trade Outlook – Clean Entry, Clean Exit, No Fingerprints Left Behind)
🌟 Hi! Hola! Ola! Bonjour! Hallo! Marhaba! 🌟
To All Market Raiders & Silent Money Makers 🤑💸💰✈️
This isn't your average BTC/USD analysis — this is a strategic market heist, crafted from the Thief Trading Playbook.
We're planning a clean operation based on both technical setups and fundamental awareness.
Let’s enter smart, exit faster, and leave no trace — just profit. 🏆
🎯 THE GAME PLAN: Unlocking the BTC/USD Vault
📈 Entry – “The Vault’s Cracked Open!”
The plan kicks off with retest entries on the 15 or 30-minute chart.
Sell limits should be placed around recent highs or lows where market momentum pulls back.
Precision and patience are your tools.
🛑 Stop Loss – Backup Escape Route
Use the 1D swing high/low (e.g., 104.500) as your SL zone.
Position size smartly, factoring in risk %, lot size, and number of active orders.
🏁 Target – 94.000 (Or Bail Out Before It Gets Hot)
Don’t stick around too long — cash out near the zone or before if price slows or traps emerge.
Secure the bag, vanish before resistance bites back.
🧲 Scalpers – Quick In, Quick Out!
Stick to the short side only — short the bounces, trail your SL, and move with stealth.
Big players can strike straight; others can shadow the swing crew and trail behind with protection.
🧠 Why This Works – Market Pulse
BTC/USD is facing overbought pressure, consolidation traps, and is nearing a critical MA Zone where reversals tend to form.
Momentum shows signs of weakening, and the bears are regrouping — that’s where we slip in and out.
Supporting Factors Include:
Macro trends
Fundamental sentiment
COT positioning
On-Chain signals
Intermarket flow
Key psychological levels
🔍 All these build the narrative behind this bearish setup. This is more than just price action — it's a calculated move.
⚠️ Trading Risk Alert: Stay Off the Radar During News Drops 📰🚨
Avoid new entries during major news events — increased volatility = increased risk.
Use trailing stop-losses to lock in profits while staying protected during spikes.
❤️ Like the Plan? Power the Crew!
If this setup helped you see the market differently, hit the 💥Boost Button💥.
Every like supports the effort and helps sharpen our future plans.
Trade with style, move with purpose — Thief Trader Style.
🚀 Stay tuned for the next setup from the shadows. Until then — stay sharp, stay strategic, and always protect your profits. 🐱👤💰📉📈
BTC Slumps Below 100000, Rebounds to Test 109500 Short Zone💎 BTC Rebounds After 100000 Drop, Eyes Short at 109500 Resistance 📊
BTC dipped below the 100000 threshold 🔻 before rebounding near 98000 🔺—a move tied to DXY weakness and easing geopolitical tensions. Now challenging the 110000 mark 🔼, it faces stiff resistance at 109500. First-time 110000 tests often spark pullbacks, making shorts the favored play here 📉.
🚀 Sell@108500 - 107500
🚀 TP 106500 - 105500
Accurate signals are updated every day 📈 If you encounter any problems during trading, these signals can serve as your reliable guide 🧭 Feel free to refer to them! I sincerely hope they'll be of great help to you 🌟 👇
Analysis of Bitcoin Market StrategyTechnical Analysis of Bitcoin (BTC) Contracts: In terms of today's market, the daily chart of the large cycle closed with a small bullish candle yesterday. The K-line pattern shows consecutive upward movements, with the price above the moving averages. The attached indicators are in a golden cross, indicating an obvious upward trend in the long term. However, the current upward momentum and sustainability are relatively weak. Therefore, it is recommended to maintain short-term trading and strictly control risks.
In the short-term hourly chart, the overall price has been consolidating at high levels. The current K-line pattern is in consecutive bullish candles, with the price above the moving averages, and the attached indicators are in a golden cross. Therefore, an upward movement is highly probable today, with the support level near the 106,300 area.
you are currently struggling with losses,or are unsure which of the numerous trading strategies to follow,You have the option to join our VIP program. I will assist you and provide you with accurate trading signals, enabling you to navigate the financial markets with greater confidence and potentially achieve optimal trading results.
Trading Strategy:
buy@106300-106500
TP:108000-108500
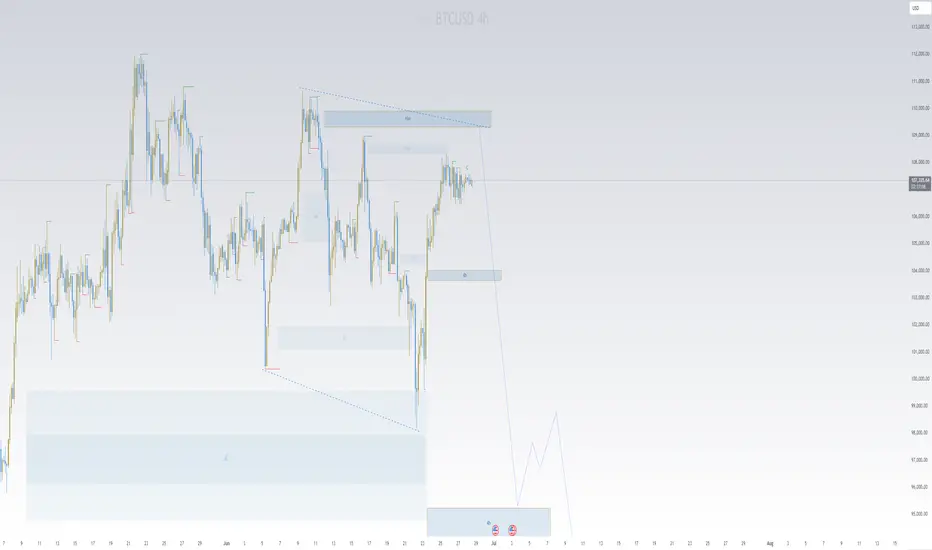
BTCUSD Trade Setup - 28/Jun/2025Hi Traders,
I expect this pair to go Down after finishing the correction.
1) Need to wait for market to show changing of the direction.
2) The first reaction zone foe me will be at 95000 level followed by 89000 level.
3) Need to observe the characteristic of the move coming down in order to understand if market is planning to go up without coming to those levels.
Current expectation for investing is to see market dropping to 89000 level and then start to look for entry.
I only invest in BTC so no shorts for me but market shows potential to give a reversal soon and give a decent down move.
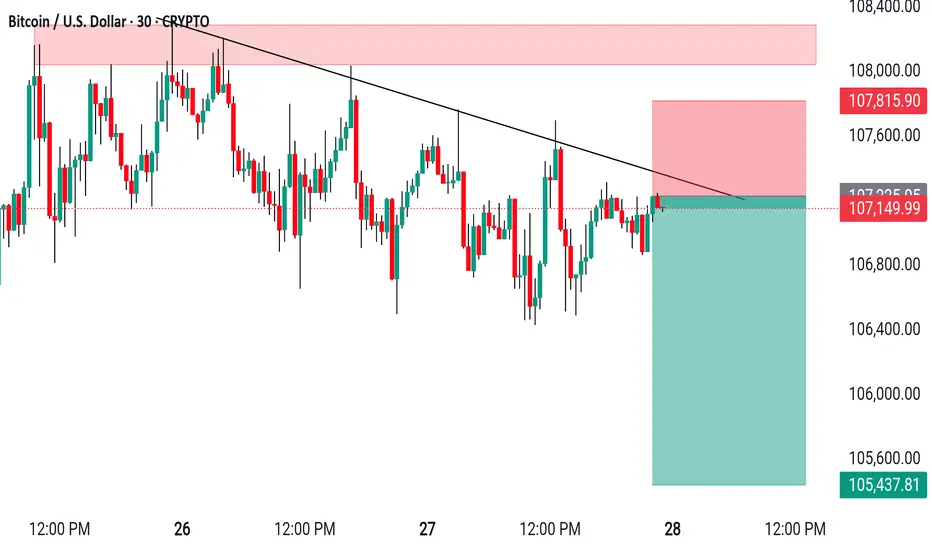
BTCUSD Short setup on the 30-min chart#BTCUSD Short setup on the 30-min chart.
Resistance holding strong.
> Entry: ~$107,140
> SL: $107,815
> TP: $105,437
> What are your thoughts? #Bitcoin #Crypto #TradingView
BTC Rebounds After 100000 Drop, Eyeing Short at 109500 Resistanc📈 BTC Rebounds After 100000 Drop, Eyeing Short at 109500 Resistance
BTC dropped below the 100000 threshold 🔻 and then rebounded near 98000 🔺. This movement is related to the decline of DXY and the reduction of geopolitical risks. Now, BTC is challenging the 110000 level 🔼. The overhead resistance is around 109500. First - time tests of the 110000 level typically trigger pullbacks, so we favor short positions here 📉
🚀 Sell@109500 - 108500
🚀 TP 107500 - 106500 - 105500
Accurate signals are updated every day 📈 If you encounter any problems during trading, these signals can serve as your reliable guide 🧭 Feel free to refer to them! I sincerely hope they'll be of great help to you 🌟 👇
Here is an analysis of the latest Bitcoin market trendBitcoin has surged to around $106,700 at its peak and hovered around $104,800 at its low. Overall, the trend remains relatively stable, continuing to stay at a relatively high level. What is driving the market?
First, institutional funds have flowed in again. Recently, many investors have bought Bitcoin through ETFs, with substantial capital inflows, which has formed support for this price level.
Second, the technical outlook is promising. Various technical indicators suggest that it is still a bullish market, meaning the price may continue to rise.
Third, regarding support and resistance levels: if the price declines, it may first find support near $104,000. If it breaks upward, the next target is roughly between $108,000 and $110,000.
What about the short-term trend? If it can break through $107,000, it may then surge toward $109,000 or even the high of $112,000. If it fails to break through, it may fluctuate repeatedly within the range of $104,000 to $106,000 for a period.
you are currently struggling with losses,or are unsure which of the numerous trading strategies to follow,You have the option to join our VIP program. I will assist you and provide you with accurate trading signals, enabling you to navigate the financial markets with greater confidence and potentially achieve optimal trading results.
Trading Strategy:
buy@104300-104800
TP:107000-107500
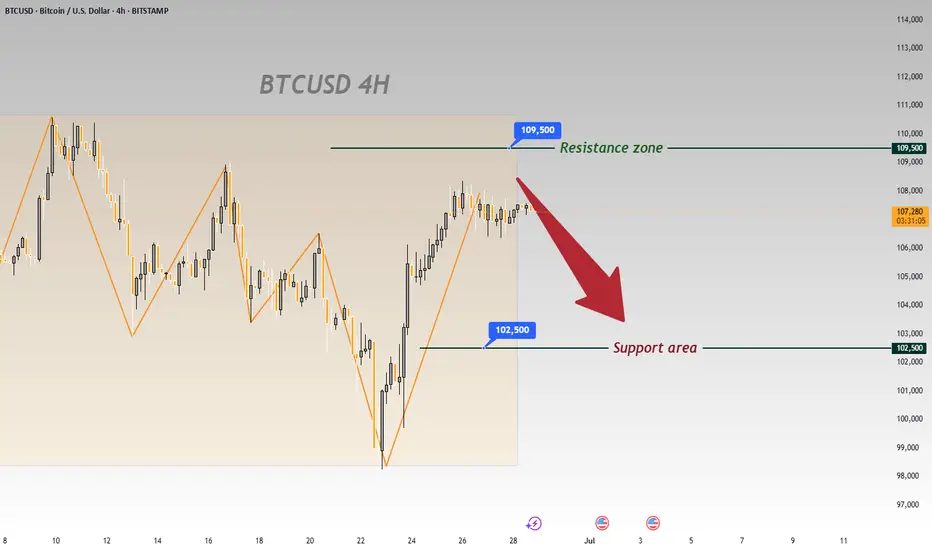
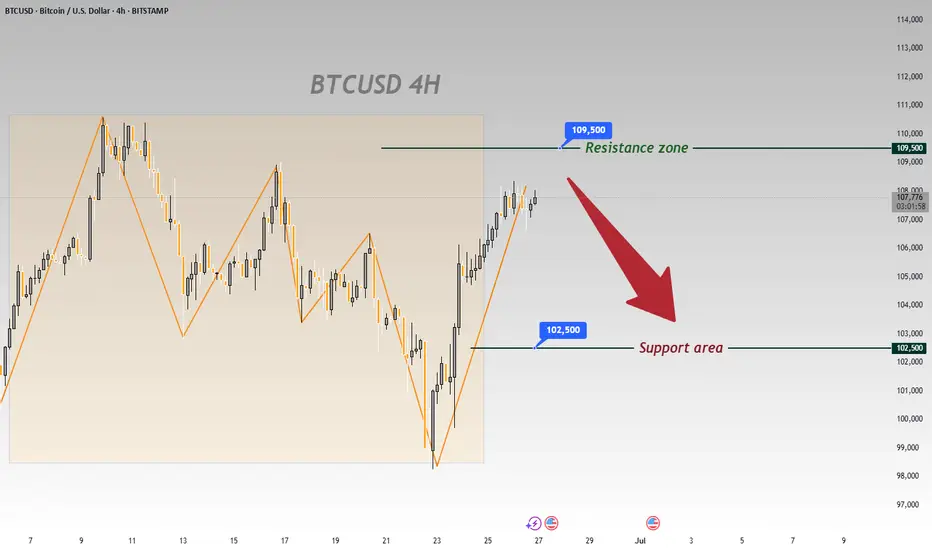
BTCUSD 4-Hour Chart Analysis: Range Bound with Bearish BiasFrom the 4 - hour chart of BTCUSD, the price movement shows obvious range - bound fluctuation characteristics 📊.
Currently, it is necessary to focus on the key resistance and support zones 🎯:
From a technical perspective, BTC is likely to oscillate repeatedly within the range in the near term 🔄, yet the overall trend leans bearish 🐻.
In the short term, opportunities for buying low and selling high within the range can be monitored 📈📉
⚡️⚡️⚡️ BTCUSD ⚡️⚡️⚡️
🚀 Sell@106500 - 105500
🚀 TP 104500 - 103500
🚀 Buy@102500 - 103500
🚀 TP 104500 - 105500
Accurate signals are updated every day 📈 If you encounter any problems during trading, these signals can serve as your reliable guide 🧭 Feel free to refer to them! I sincerely hope they'll be of great help to you 🌟 👇

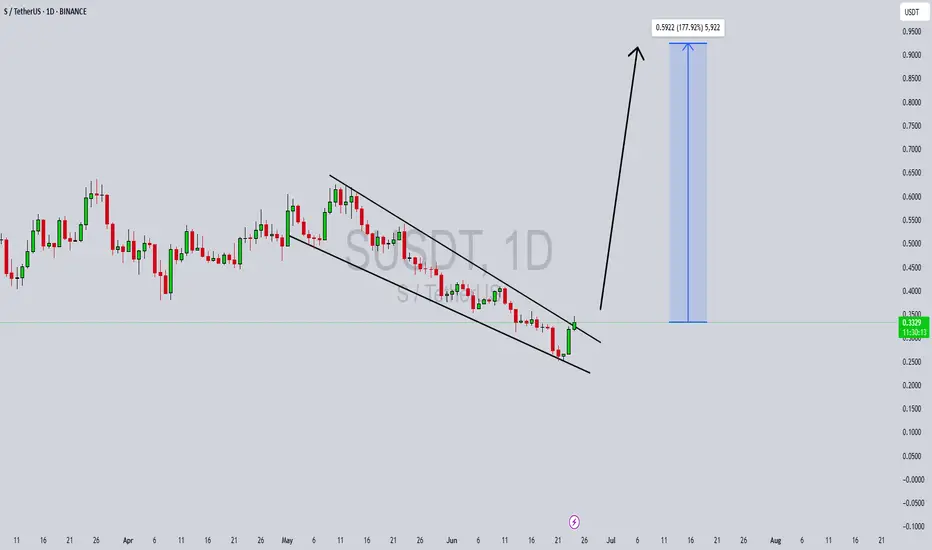
SUSDT Forming Falling WedgeSUSDT is currently displaying a textbook falling wedge pattern, a bullish reversal formation often seen at the end of a downtrend. This setup is known for signaling a breakout to the upside once the price compresses within the narrowing range. In the case of SUSDT, the wedge has been forming with consistent downward sloping resistance and support lines, accompanied by steady volume — a key confirmation of this pattern’s strength. The current technical outlook suggests that a bullish breakout could be imminent.
Technical indicators and chart structure support a possible breakout that could deliver a substantial move. Based on historical wedge breakout performance, SUSDT has the potential to rally with a projected gain of 140% to 150%+ from current levels. This would place the asset in a prime position for traders looking to capitalize on early-stage momentum. The increasing volume profile further adds conviction, signaling active accumulation and growing market interest.
Recent activity and sentiment around SUSDT indicate that investors are starting to pay attention to this opportunity. As capital flows into smaller-cap altcoins showing strong technical setups, SUSDT stands out with its clean wedge formation and bullish potential. If the price breaks above the wedge resistance with volume confirmation, it could trigger a strong upward rally, attracting both short-term traders and long-term holders.
This pattern-driven setup, combined with bullish market behavior and investor activity, puts SUSDT in a favorable zone for significant upside. Keep an eye on key resistance levels and watch for bullish engulfing candles or breakout confirmation to enter at optimal points.
✅ Show your support by hitting the like button and
✅ Leaving a comment below! (What is You opinion about this Coin)
Your feedback and engagement keep me inspired to share more insightful market analysis with you!
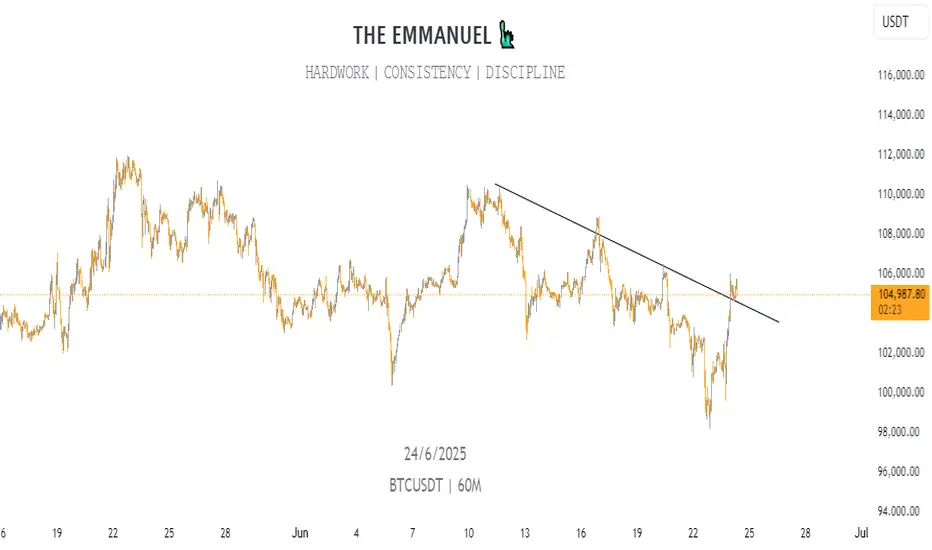
NEW BTC HIGHS?BTC just broke a previous resistance zone. Previous data indicates a more upward push.
This may even lead to new highs.
USD Index (DXY) Bullish Reversal & Breakout PotentialThe DXY chart displays a strong bullish reversal structure from the support zone near the 99,800–100,200 area. Here’s a professional breakdown of the technical setup:
🔍 Key Observations:
🟢 Bullish Reversal Formation
The price rebounded aggressively from a strong demand zone (support), marked by a green arrow and orange highlight.
Multiple historical reaction zones confirm this level's validity as a reliable support.
📉 Previous Decline & Correction
After reaching the resistance area near 110.400, the price corrected with a bearish channel.
This pullback formed a classic bull flag, a bullish continuation pattern, eventually leading to the current breakout.
🟦 Current Price Action
The market has broken out of the recent downtrend and is forming higher highs and higher lows.
A strong bullish impulse candle confirms renewed buying interest.
🧱 Support & Resistance Levels:
🔵 Resistance Zone (Target): 110.409 — a historically respected area and target for the bullish move.
🟣 Current Support Zone: 105.061 — previously resistance, now likely to act as support after the breakout.
🎯 Bullish Target Projection
If price retests and holds the support at 105.061, the next potential leg can extend towards 110.409, offering a strong risk-to-reward setup.
⚠️ Caution
Watch for a pullback and retest near the support level.
A failure to hold above 105.061 could invalidate the bullish structure.
🧠 Conclusion
The DXY is showing a bullish trend continuation after a breakout from a corrective structure. A successful retest of support could propel price towards the 110.400 target zone 📊.
Bias: ✅ Bullish above 105.061
Invalidation: ❌ Below 105.000

#BTC Bounced, 100EMA saved the day!100 EMA saved the day.
But the one concern? We’ve printed a new Lower Low, not a great sign.
The chart looks bouncy, but the overall structure still feels uncertain.
No point guessing or forcing trades here, I’d rather wait for clear confirmation.
I’ll share updates if I spot any changes or interesting altcoin setups.
For now, patience is our best edge. I know many altcoins might look great, but BTC Dominance is not yet done. I'll be sharing that chart tomorrow.
Stay sharp.
Hit that like button if you find this short update useful.
Thank you
#PEACE
A bearish trend is gradually taking shape.From a technical perspective, the complete breakdown of the box bottom, coupled with the MACD indicator about to fully crossing below the zero axis, both indicate that bullish momentum is weakening and a bearish trend is gradually forming. Short-term bulls need to take a temporary break and wait for the construction of a stabilizing platform. For bears, according to the current trend, they can lay out short positions on rallies. The ideal entry position is near the lower edge of the box, and they can try to lay out positions boldly after setting stop-losses.
On the news front, "Laote"'s policies change frequently, with extremely high uncertainty. The market needs global stability, and there has been no bull market in history built in a turbulent environment. Therefore, we need to treat market conditions cautiously, avoid blind and radical operations, and only by maintaining rationality can we respond to market changes.
you are currently struggling with losses,or are unsure which of the numerous trading strategies to follow,You have the option to join our VIP program. I will assist you and provide you with accurate trading signals, enabling you to navigate the financial markets with greater confidence and potentially achieve optimal trading results.
Trading Strategy:
sell@102300-102800
TP:100000-100500
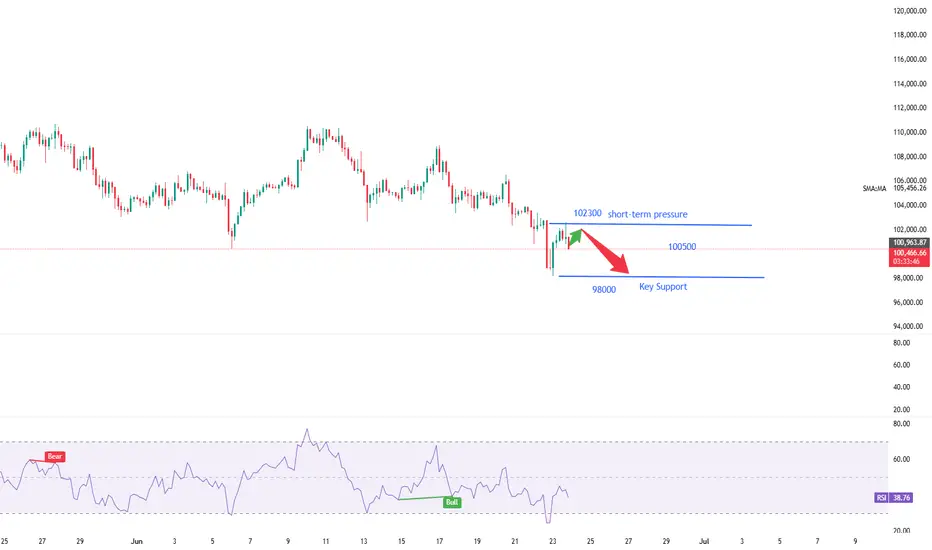
BTCUSDT Hello traders.
The BTCUSDT trade I shared the other day played out just as expected, with BTC experiencing a significant drop in value shortly after. The price fell all the way down to the 98K level.
Following this decline, I anticipate a short-term rebound toward the 102K–103K range, after which I expect the downtrend to resume. Therefore, I’ve placed a Sell Limit order at 102,350, and I’m currently waiting for the price to reach that level.
If you'd like, you can consider this opportunity in the same way.
🔍 Trade Details
✔️ Timeframe: 1-Hour
✔️ Risk-to-Reward Ratio: 1:2
✔️ Trade Direction: Sell Limit
✔️ Entry Price: 102,350.24
✔️ Take Profit: 100,250.08
✔️ Stop Loss: 103,399.62
🕒 If the trade doesn’t gain strong momentum, I will keep the position open only until 23:00 (UTC+4) today. Otherwise, I will manually close the trade—either in profit or at a loss—depending on price action.
🔔 Disclaimer: This is not financial advice. I’m simply sharing a trade I’ve taken based on my personal trading system, strictly for educational and illustrative purposes.
📌 Interested in a systematic, data-driven trading approach?
💡 Follow the page and turn on notifications to stay updated on future trade setups and advanced market insights.
