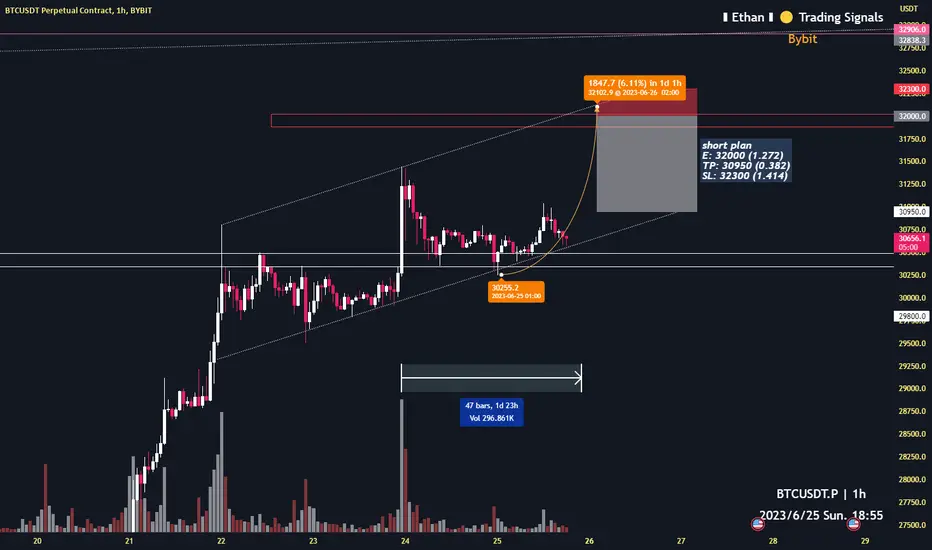
Bitcoin will pump to 32k before June 271h time frame
-
32000 is easy to reach with this rising wedge.
At that time, we can open short.
Entry: 32000
TP: 30950
SL: 32300
Btcusdtanalysis
TOTALMARKETCAP :CRYPTOHi Guys Hope you well.
As it was said, the downtrend channel was broken and made a significant growth. Now I am waiting to reach the daily supply area, after which we can move towards the trend again. Just note that due to the dominance of Bitcoin, the status of other altcoins is different from Bitcoin.
SecondChanceCrypto
⏰25/JUNE/23
⛔️DYOR
Always do your research .
If you have any questions, you can write them in the comments below.and I will answer them.
And please don't forget to support this idea with your likes and comments.

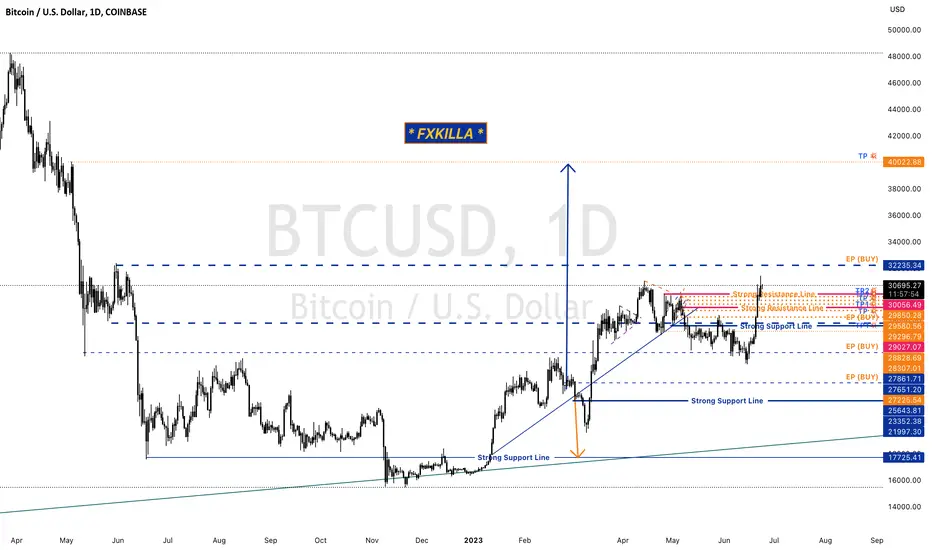
🚨 BTCUSD HIGH PROBABILITY BUY SETUP 🚨🚨 BTCUSD HIGH PROBABILITY BUY SETUP 🚨
* Here we can see clearly the next potential move for Bitcoin coming hours.
* Baring in mind this is going to be a QUICK SCALPING BUY MOVE.
* Before Reversal Happening SOON.
* EP(BUY): 30831.25
* TP: 31290.23
* SL: 30493.42
* Keep your eye close on your trading positIons.
* Happy pip hunting traders.
* FXKILLA *

🚨 BTCUSD UPDATE 🚨🚨 BITCOIN UPDATE 🚨
* Here we can see clearly BTCUSD has according to our previous post on Feb 25/2023.
* Let's see if Bitcoin ( Crypto King ) is going to our next level of $40k.
* Keep your eye close on your trading positions.
* Happy pip hunting traders.
* FXKillA *
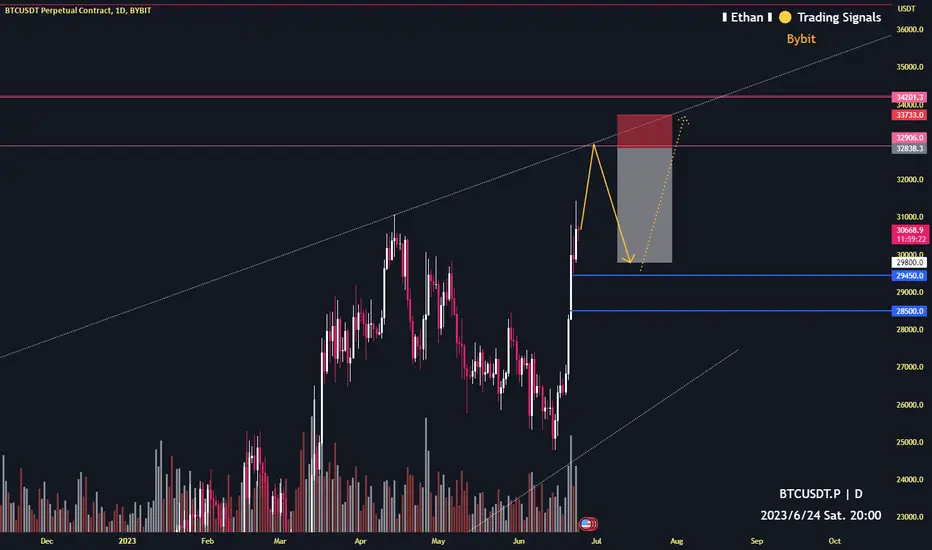
Bitcoin short plan at 32750 1D time frame
-
Multi superposition of resistance around 32750
There is a good price to open short
Further, Bitcoin will probably create top structure.
Target: 29800
SL: 33700
BTCUSDT at LTF support, may head up to 31236Thats the trade I am looking for on small time frame. The price is coming clode to the LTF support and probably should get a bounce towards the LTF resistance.

Bitcoin Cup & Handle Bullish!CME:BTC1!
CRYPTOCAP:BTC has printed a massive Cup & Handle.
Also looks like an Inverse Head & Shoulders.
Idea tagged as Neutral, as I need to see more confirmation - read below:
Measured move to 48k over time.
Requires Break and Flip of the Breakout level around 31k.
Plan A: Long Break and Retest of 31.5k level - if you're a pro trader you can look for lower bounce ideas prior to the breakout - but gathering data every second.
Plan B: Short to Possible Pullback level and watch for hold of this support for next attempt or further downside to.
No Prediction - Preparation. When CRYPTOCAP:BTC moves we move.
Thanks for all the support from my followers!
Always having Plan A and Plan B scenarios so we can react once the markets provide an opportunity to execute our edge.
If you liked this idea or if you have your own opinion about it, write in the comments.
The information and publications are not meant to be, and do not constitute, financial, investment, trading, or other types of advice or recommendations.

BTCUSDT may head up towards 30633 zoneThe price is trading at LTF support. I think a long is favorable here towards 30633 area. The price is trading broke through the weekly resistance WR2 but came back inside the resistance zone and currently trading inside it. However, it seems the price is now ready to make another push upward at least towards the recent high it made.

BTCUSDT--20K or 30K ??Observations::
End of bearishness in the BTCUSDT.....
the crypto currency is now @ Golden zone...
It is going to reversal from this area ...
If the previous resistance acts as support, will observe the price is going and will to reach 30K again.
it forms a triangle pattern,
Bitcoin potential reversal price $318784h time frame
-
Bitocoin creating a potential harmonic structure(shark).
Reversal price is 30345 and 31878, depend on small or big shark.
We can have great RRR if open short at these prices.
Stay prepared for it!

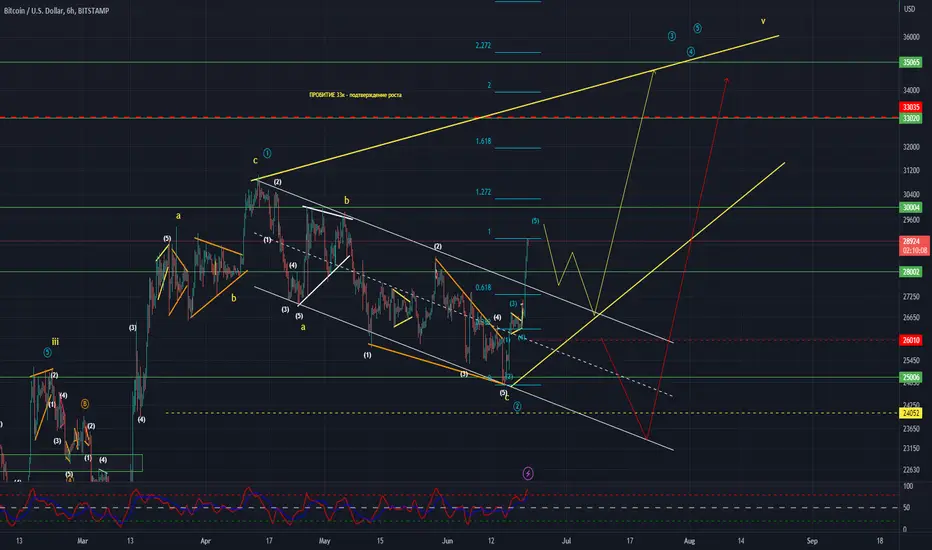
BTCUSDT Elliott Waves AnalysisHello friends.
Please support my work by clicking the LIKE button👍(If you liked). Also i will appreciate for ur activity. Thank you!
Everything on the chart.
2 options on the chart
now a rollback to the 27k area is likely (to retest the broken channel),
Fixing BTC above 30k will send the price to the 35k area.
Return under 26k - let's go test the 23k zone
In any case main target zone: 34-36k
SL: depending of ur risk
Good luck everyone!
Follow me on TRADINGView, if you don't want to miss my next analysis or signals.
It's not financial advice.
Dont Forget, always make your own research before to trade my ideas!
Open to any questions and suggestions.
BTCUSD Potential Breakout Trade SetupBTCUSD breakout trade on either side, if broke resistance or support. Place TP and SL with buy stop and sell stop orders.

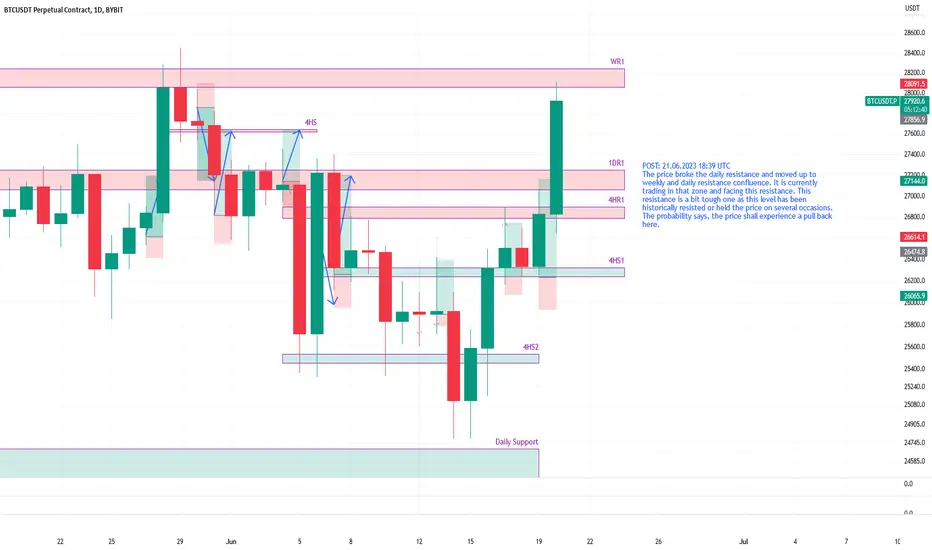
BTCUSDT at weekly resistance, may experience pull backThe price broke the daily resistance and moved up to weekly and daily resistance confluence. It is currently trading in that zone and facing this resistance. This resistance is a bit tough one as this level has been historically resisted or held the price on several occasions. The probability says, the price shall experience a pull back here.
BTCUSDT may move up to 26980The price has been rejected from daily resistance 1DR1. I think this push back from that resistance has created another small long opportunity. The price may move up to the hourly resistance 26980.

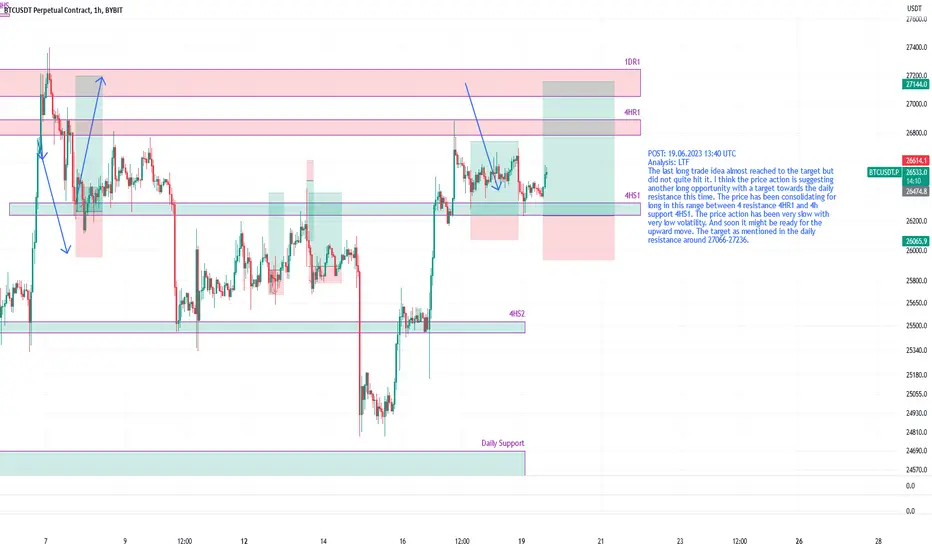
BTCUSDT ready to head up towards daily resistance 27066-27236Analysis: LTF
The last long trade idea almost reached to the target but did not quite hit it. I think the price action is suggesting another long opportunity with a target towards the daily resistance this time. The price has been consolidating for long in this range between 4 resistance 4HR1 and 4h support 4HS1. The price action has been very slow with very low volatility. And soon it might be ready for the upward move. The target as mentioned in the daily resistance around 27066-27236.
BTCUSDT - Time for a bullish trup
my past idea
if you like the idea, please "Like" it. This is the best "Thanks!" for the author 😊 P.S. Always do your own analysis before a trade. Put a stop loss. Fix profits in installments. Withdraw profits in fiat and please yourself and your friends.

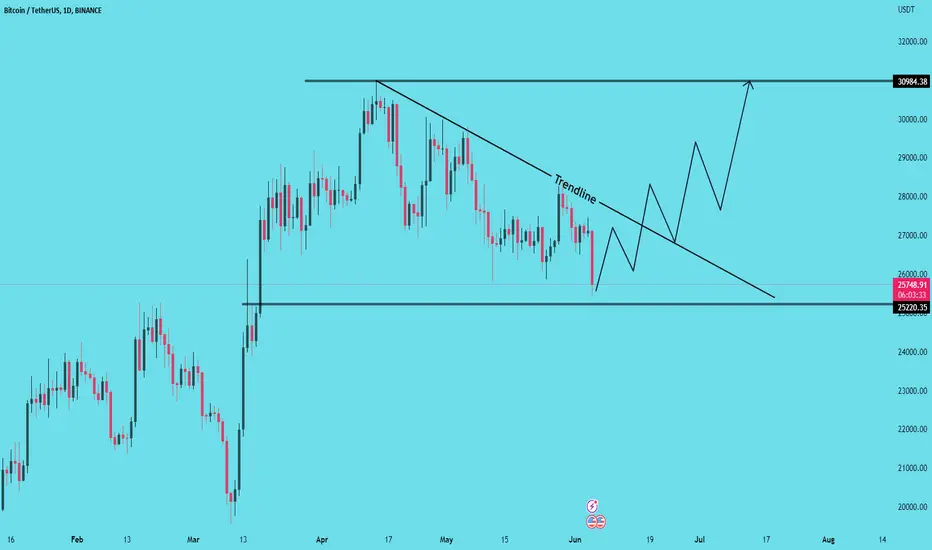
SIMPLEST VIEW OF BTC #BTC UPDATE
On the daily timeframe chart, #BTC is still advancing inside the wedge pattern and is currently situated above a major trendline.
A potential bullish rally of about +20–25% might be anticipated if Bitcoin maintains its position above the trendline and successfully breaks out from the wedge to the upside.
However, a bearish rally towards 21.5k may materialize if Bitcoin loses the support of the major trendline.
Significant volatility is anticipated next week because of the US CPI and FOMC schedules.
For more quality Charts analysis, follow us.
I'm grateful.

BITCOIN range and correction 💡📖Hello 🐋
based on the chart, the price again sticks in the range position middle of the parallel channel 📖💡
for
any other huge pump, we need even more correction to the downside ❌🧨
beside
brief amount of gain and green candlestick is logical 📖💡
and
range candlesticks to the upside and downside before any other sharp movement is logical too 📖💡
Please, feel free to share your point of view, write it in the comments below, thanks 🐋

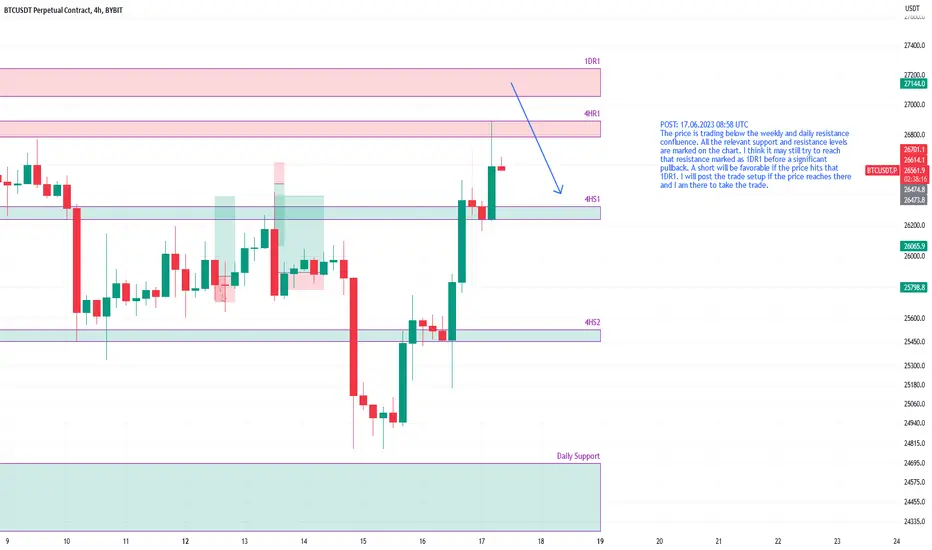
BTCUSDT may hit daily resistance and then pullbackThe price is trading below the weekly and daily resistance confluence. All the relevant support and resistance levels are marked on the chart. I think it may still try to reach that resistance marked as 1DR1 before a significant pullback. A short will be favorable if the price hits that 1DR1. I will post the trade setup if the price reaches there and I am there to take the trade.
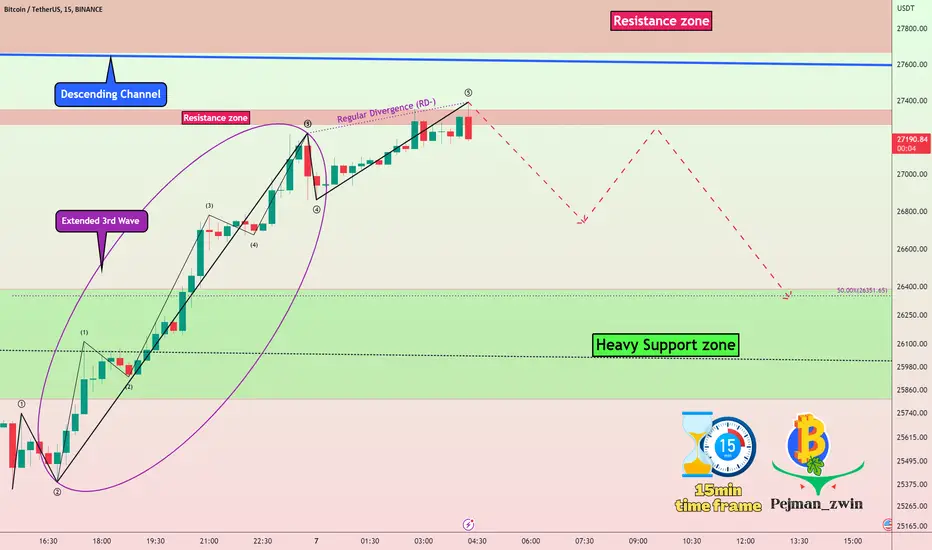
Bitcoin Road Map(15-Min)🗺️!!!Bitcoin started to grow again as I expected; the structure of impulse waves of Bitcoin is such that wave 3 is extended, and wave 5 finished in the resistance zone.
I tried to show the road map of BTC in a 15-minute time frame.
Bitcoin Analyze ( BTCUSDT ), 15-minute time frame ⏰.
Do not forget to put Stop loss for your positions (For every position you want to open).
Please follow your strategy, this is just my Idea, and I will be glad to see your ideas in this post.
Please do not forget the ✅' like '✅ button 🙏😊 & Share it with your friends; thanks, and Trade safe.
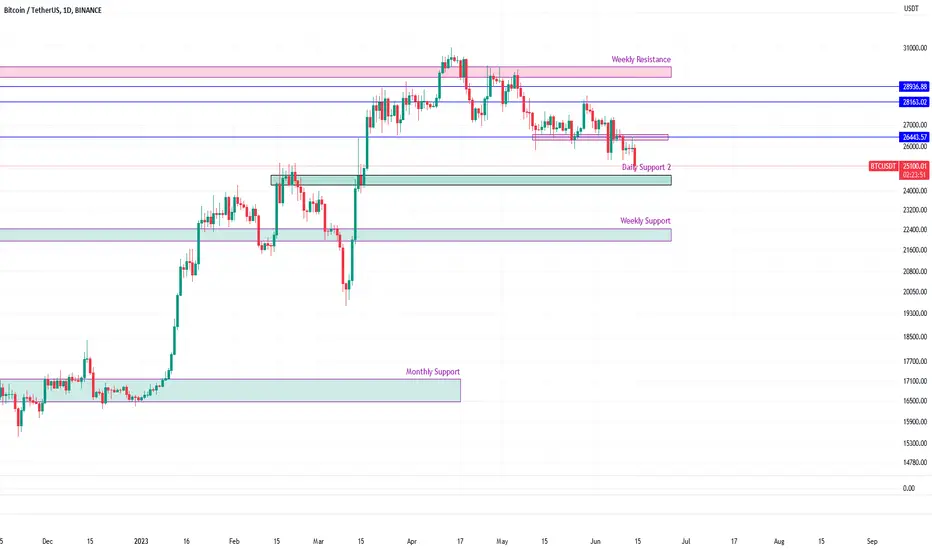
BTCUSDT close to daily support, long term long is favorable hereThe price has come close to the daily support zone which we talked for HTF analysis on the first drop on 5th June. The price is still a bit short of touching the daily support. So it might dip one more time to hit it formally. But lets see.
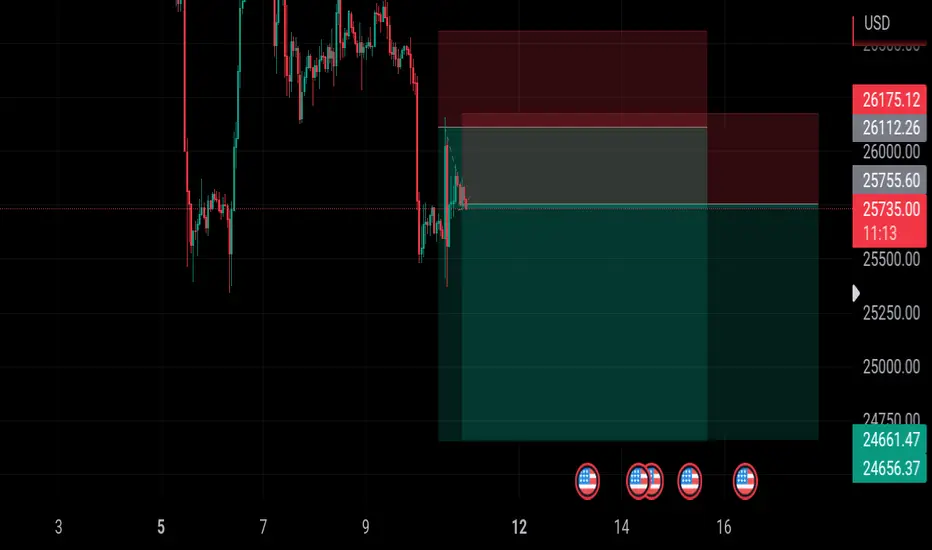
BTC will pump to $32500 then dump to $20000 by the end of 20231D time frame
-
Based on the falling wedge
We might see 32500 soon
And there is a very great entry to short Bitcoin
Be careful the potential severe dump to 20k in November.

BTCUSDCaught a re-entry trade on BTCUSD. I am expecting a drop to the downside and forming a Lowe low. Although the price movement seems to be slowish, but still holding and waiting patiently for the drop.