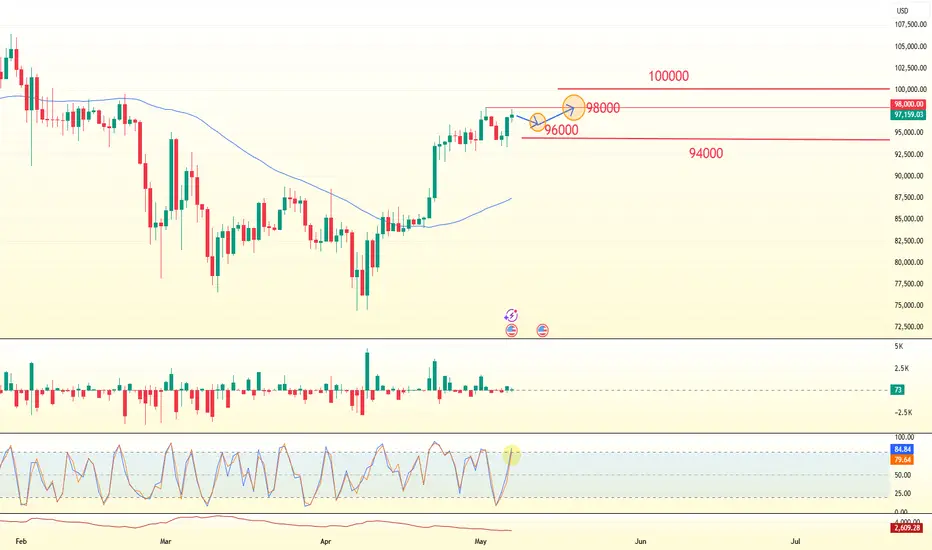
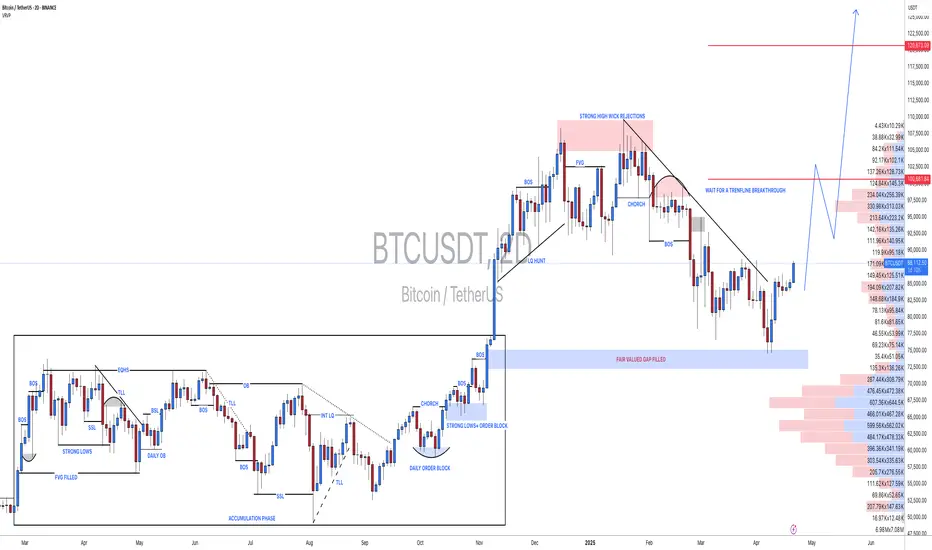
Bullish Continuation SetupThe price of Bitcoin fluctuated sharply on May 7 and showed an upward trend, once approaching $98,000. The overall market is in a strong bullish state, but potential risks brought by a top divergence need to be watched out for. In terms of capital flow, although there is a lack of a large amount of new capital inflow, the increase in holdings by existing holders has driven the price up. If the price can hold firm at $96,000 and continue to rise, the bulls will keep pushing up, and there is hope for further upward space. If it fails to break through the pressure level of the middle band of the Bollinger Bands at $97,650, the bulls may consider taking profits, and the price is likely to return to the trading range for adjustment. The key support level below is in the range of $94,000 - $94,500. If this range is broken, there may be a further decline to $93,000 or even lower.
you are currently struggling with losses, or are unsure which of the numerous trading strategies to follow, at this moment, you can choose to observe the operations within our channel.
Btcusdtanalysis
btcusd sell signal. Don't forget about stop-loss.
Write in the comments all your questions and instruments analysis of which you want to see.
Friends, push the like button, write a comment, and share with your mates - that would be the best THANK YOU.
P.S. I personally will open entry if the price will show it according to my strategy.
Always make your analysis before a trade
Analysis of the Latest SignalsThe advancement of the Bitcoin Reserve Bill in many US states, such as Arizona's plan to allocate 10% of state assets to BTC, combined with the discussion on the regulatory framework at the White House Crypto Summit, may make policy clarity a catalyst for future market conditions. The market is watching this week's FOMC decision. If the rate - cut expectation heats up, it may promote the recovery of Bitcoin liquidity.
you are currently struggling with losses, or are unsure which of the numerous trading strategies to follow, at this moment, you can choose to observe the operations within our channel.
Trading Strategy:
buy@93500-94000
TP:95500-96000

BTCUSDT LONG/BUYBy utilizing Fibonacci retracement levels, historical patterns, , we can formulate a hypothesis that the market might follow a similar trajectory if bullish sentiment prevails.
BTCUSD short-term view.It is a good opportunity to sell BTCUSD in real time. Short-term is based on the right side of the swing trading, with a target of 93000-92500. In addition, the uncertainty of the news on BTCUSD. It is a good time to sell now.

Bullish sentiment is favorable.Bitcoin is currently in a crucial stage of the battle between bulls and bears. There is both short-term pullback pressure and technical support. The movements of institutional funds and policies remain the dominant factors.
The single-day net inflow of BlackRock's IBIT Bitcoin ETF reached a record of $1 billion. The continuous inflow of institutional funds provides support for the price.
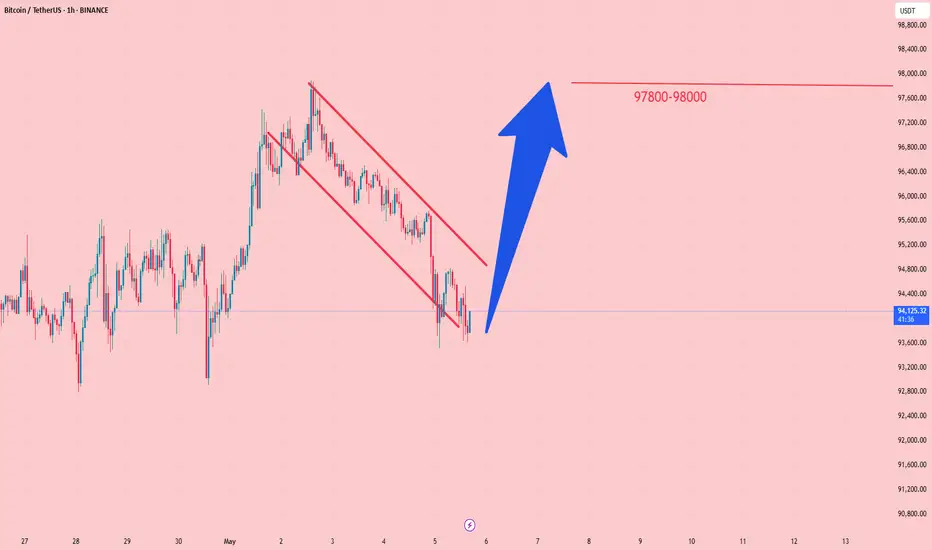
The resistance levels have recently concentrated in the range of $97,800 - $98,000. Once broken through, it may challenge the $100,000 mark.
you are currently struggling with losses, or are unsure which of the numerous trading strategies to follow, at this moment, you can choose to observe the operations within our channel.
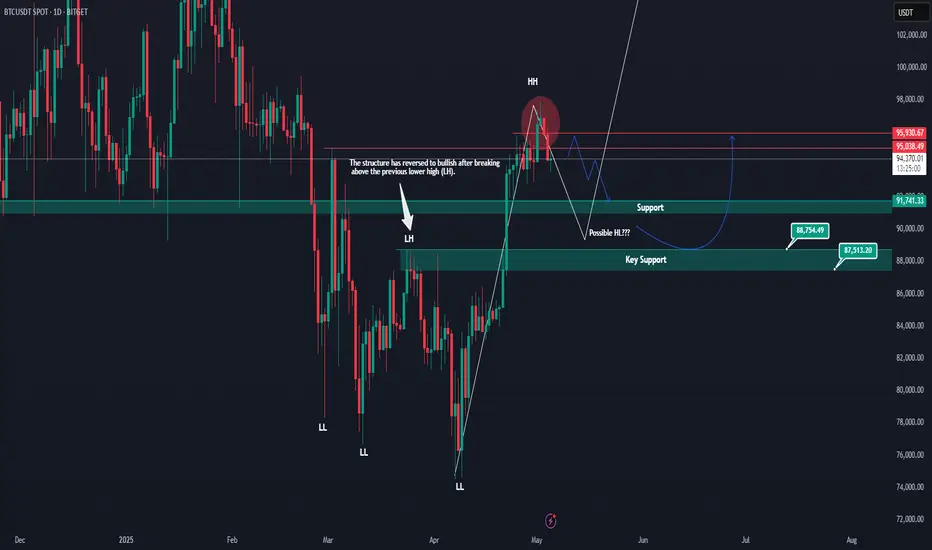
BTC Forming Bullish Structure — But Wait for the Higher LowAfter months of lower lows and lower highs, Bitcoin has finally broken structure by pushing above the previous lower high, officially forming a new higher high (HH). This is an early sign of a potential trend reversal back into bullish territory.
However, before momentum continues upward, a healthy retracement could occur. The key level to watch is the support zone around $91,200. If price pulls back and forms a higher low (HL) here or slightly lower around the $88,700–$87,500 zone, it would confirm the bullish structure and potentially kickstart the next leg up.
Patience is key here — let the higher low form before looking for long setups.
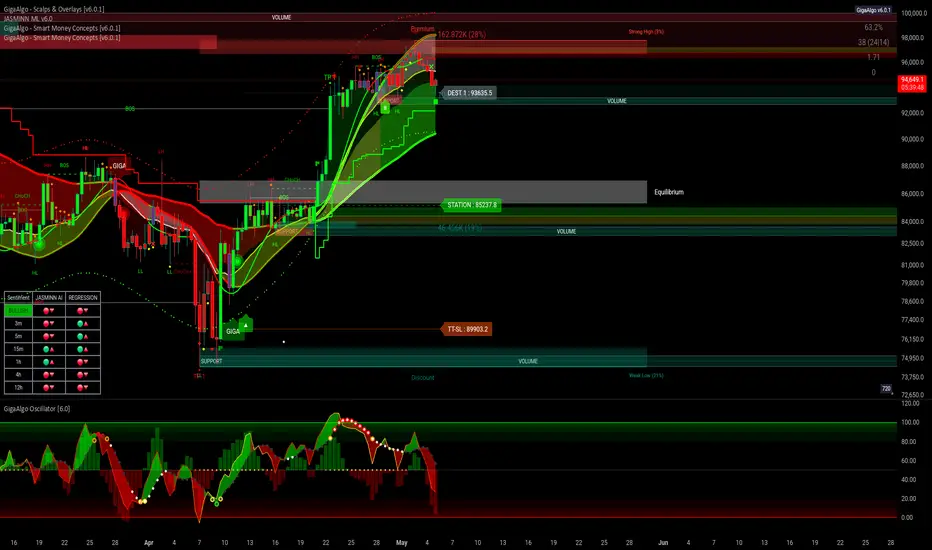
BITCOIN BULLISH BTC/USDT Analysis – GigaAlgo SMC | May 5, 2025
Price has recently tapped into a premium OB zone with strong volume rejection. Although JASMINN ML flags bearish sentiment, the structure still supports bullish momentum up to 96K unless the 93K support fails. If that breakdown occurs, the next significant support lies around 83K, aligning with previous volume zones and the STATION marker.
The GigaAlgo Oscillator shows a deep red bar print, hinting at increasing bearish pressure short-term, while multi-timeframe sentiment shows a mix of red and green — signaling indecision and potential range-bound action.
Btcusd going down an up again forward up as it will be after theBtcusd going just a bit down as a little retraction before going up again beating it's own record,
Just keep Ur own savings and investment safe
And dyor - do your own research
For myself keeping in a Elliot waving if market doesn't spikes
Just keep Ur investments safest and do Ur o n research always, and don't go for anyone else and not myself as well
This is only an idea
Keep it safe
Summary of the Bitcoin Market This WeekThis week, the Bitcoin market showed a trend of steady increase and broke through the key resistance level.👉👉👉
Technically, the MACD indicator on the daily chart shows a strong bullish signal, and the price has also held above the key moving average, confirming the short - to medium - term upward trend. Overall, market sentiment is relatively optimistic, and investors' expectations for it to break through the psychological barrier of $100,000 have increased. However, when Bitcoin approaches the $98,000 level, it may form a short - term resistance, and as the price gets closer to the $100,000 mark, the overly optimistic market sentiment also increases the risk of a pullback.
The better than expected performance of the US job market has alleviated recession concerns, boosted the sentiment of risky assets, and provided support for Bitcoin. Meanwhile, the signs of easing in US - China trade relations have had a positive impact on the global financial markets, including the cryptocurrency market.
This week, the Bitcoin market has performed strongly driven by various factors. Both on-chain data and market indicators have shown positive signals. However, during the process of price increase, it's also necessary to pay attention to the potential risk of a pullback.

BTCUSDT to head towards 106kBTCUSDT is currently trading inside weekly resistance zone WR1 and currently holding inside this zone. However, since it has not been rejected outrightly from there showing the strength and a high probability of it breaking this resistance and moving to the upside towards 106k area. Later we can see pullback from there towards WR1+DS1 zone testing as support and then bounce again from there towards clear sky as depicted on the chart. This structure will also create a giant inverse head and shoulder fueling the upward move later on. However, those we will assess later after more price action is there. But for now, lets focus on this long trade from weekly resistance zone WR1 to 106k.

The decisive day of major data (BTCUSD)Yesterday, it was mentioned that the expectation of continuing to buy after a retracement of 96k was completely correct. Followers also made good profits.
BTCUSD bulls are still strong. The retracement is mainly long trading, which needs to be paid attention to at present. 96k/95k are both good buying opportunities.
TP98K-100K
#BTC/USDT Update. Bitcoin is currently trading around a key resistance zone.
The immediate support lies near $95,554, while a confirmed breakout above $97,300 could trigger an uptrend toward $104,000.
Until then, trade with caution.
DYOR. NFA.

Can BTCUSD continue to be purchased? The answer is definitely.Can BTCUSD continue to be purchased? The answer is definitely.
The current trend is a rebound trend after a volatile decline. The space for a short-term increase of 1,500 points is very simple. The target position is 94,700-95,200. Friends who like to do short-term swing trading can follow.

Buy@9500096000: This represents the resistance level adjacent to the upper trend-line of the current ascending wedge. The price has repeatedly probed this zone but hasn't managed to achieve a decisive breakthrough, underscoring significant selling pressure at this crucial juncture 💥.
97500: It stands as a more elevated resistance milestone. Should the price powerfully breach the 96000 resistance barrier and sustain its upward momentum, it could potentially challenge this level 🎯.
⚡⚡⚡ BTCUSD ⚡⚡⚡
🚀 Buy@95000
🚀 TP 96000 - 97000
Accurate signals are updated every day 📈 If you encounter any problems during trading, these signals can serve as your reliable guide 🧭 Feel free to refer to them! I sincerely hope they'll be of great help to you 🌟

BTCUSDT 1W UpdateYes, history is likely to repeat itself, making it possible for Bitcoin to reach a new all-time high in the range of $130K to $150K this year.
Are you ready?

#BTCUSDT: From $74,000 to $88,000 Moving Well! More Growth CominIt’s been on a steady climb from $74,000 to $88,000. We’re expecting even more growth in the coming weeks. The price has finally broken free from its consolidation phase and is now on the rise. We think it’ll reach $94,000, then $100,000, and maybe even go up to $120,000 by the end of the year.
What do you think? Let me know in the comments below!
Thanks!
Team Setupsfx_
Bitcoin Technicals & FundamentalsBitcoin/US Dollar (BTC/USD)
Price Action Observations:
Trend: Strong bullish trend — price is above the middle Bollinger Band and riding the upper band.
Current Price: ~$95,410 (as of the chart time).
Immediate resistance near the upper Bollinger Band (~$95,921).
A major horizontal resistance is at around $98,000 (thick black line).
Local pivot/support zone marked around $92,400 – $93,100 (purple horizontal lines).
20-SMA (middle BB) acts as dynamic support (~$93,085).
Stronger support around $90,200 (lower BB).
Volume increasing on the bullish candles after the breakout around the 21st-22nd April.
Higher volume on green candles suggests genuine buying interest — not just a low-volume rally.
Bollinger Bands: Bands are expanding — classic signal for a volatile move.
Price is walking the upper band → continuation pattern as long as price doesn't break below the 20-SMA.
Trendlines: Ascending trendline beneath the current price → confirming higher lows.
There is a larger upper channel line sloping upwards targeting ~$105,000–$106,000.
Bias: Strong Bullish
Above 92,400–93,100 pivot zone = bullish structure maintained.
Immediate target: $98,000
Stretch target: $100,000 - $105,000 (upper channel resistance)
Invalidation: If price closes below ~$92,000 (break below pivot + mid-BB).
Fundamental Analysis (as of April 25, 2025):
If US Dollar (DXY) is weakening, it favors Bitcoin.
Fed policies — if there’s talk of rate cuts or holding rates steady, Bitcoin rallies.
Halving hype: Bitcoin halving happened earlier in 2024. Historically, it leads to a delayed but strong rally about 12-18 months later — we are now entering that "parabolic" zone.
ETF Inflows: BTC ETFs launched earlier have been drawing huge institutional interest.
Supply Shock: Fewer Bitcoins available on exchanges post-halving = price pressure upwards.
Global uncertainty (recession fears, wars, bank failures) = safe-haven demand for BTC.
Bitcoin being seen as "digital gold" strengthens its position.
My Final View:
Bitcoin remains in a strong bullish structure technically and fundamentally.
As long as it holds above ~$92,000–$93,000 zone, expect moves toward $98,000–$100,000+. A deeper retrace to $90,200 could still maintain the bull trend, but below that would signal weakness.

BTCUSDT 1W AnalysisBTC ~ 1W Analysis
#BTC It is necessary to wait until this pattern is successfully broken to confirm a sustained bullish trend.

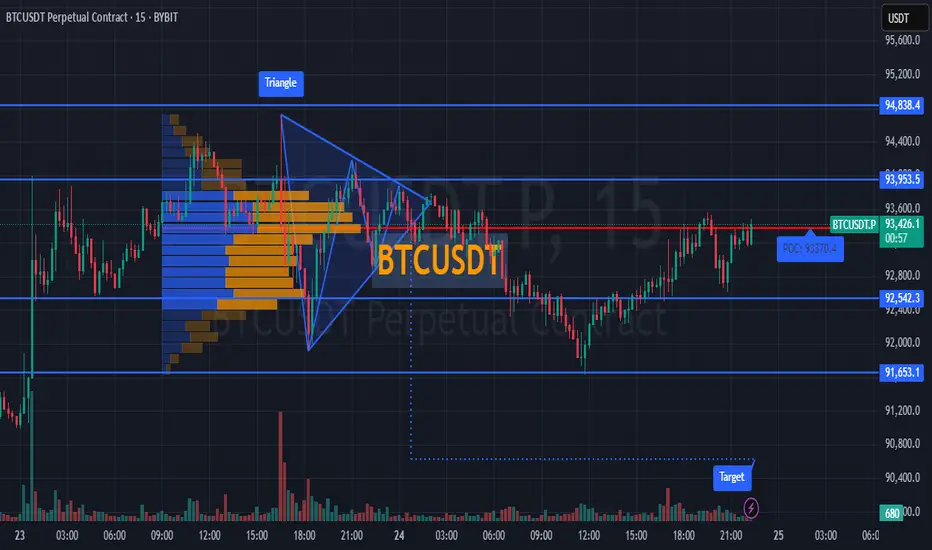
Market Analysis: #BTCUSDT💰 On the BYBIT:BTCUSDT.P chart, a clear symmetrical triangle pattern has formed and already broken down, leading to a confirmed bearish impulse. Price has now returned below the POC level at $93,370.4 (Point of Control by volume), indicating weakness from buyers.
📊 Key Levels
🔴 POC BYBIT:BTCUSDT.P $93,370.4
— This is the highest volume area, now acting as strong resistance. As long as price remains below, short bias is favored.
🔵 Support BYBIT:BTCUSDT.P $91,905.5
— A short-term target if the bearish momentum continues.
🎯 Lower Target Zone
— Indicates the full depth of the breakdown move, aiming at the $90,800–$91,000 range.
📈 Volume
➡️ Volume increased during the breakdown, then dropped as price revisited the $93,000 zone — this signals a weak retest and seller control.
📍 Important Notes
➡️ Currently, BYBIT:BTCUSDT.P is trading between two key zones — the POC above and the $91,900 support below.
➡️ Failure to break and hold above $93,370 keeps the bearish scenario in play.
➡️ A move below $92,600 will confirm continuation of the downtrend.
📢 Strategy Recommendations:
🚨 SHORT Scenario BYBIT:BTCUSDT.P
Entry: on a retest of $93,000–$93,200 and rejection
Stop Loss: above POC ($93,450)
Targets: $92,100 → $91,900 → $90,800
🚨 Alternative LONG Scenario BYBIT:BTCUSDT.P (only if POC is broken):
Entry: after a solid breakout and hold above $93,400 with volume
Target: $94,200–$94,800
Stop Loss: below $93,000
🚨 Conclusion :
BYBIT:BTCUSDT.P has completed the triangle pattern and is now in a retest phase. So far, signs still point to bearish continuation, with final confirmation coming from a break below $92,600.
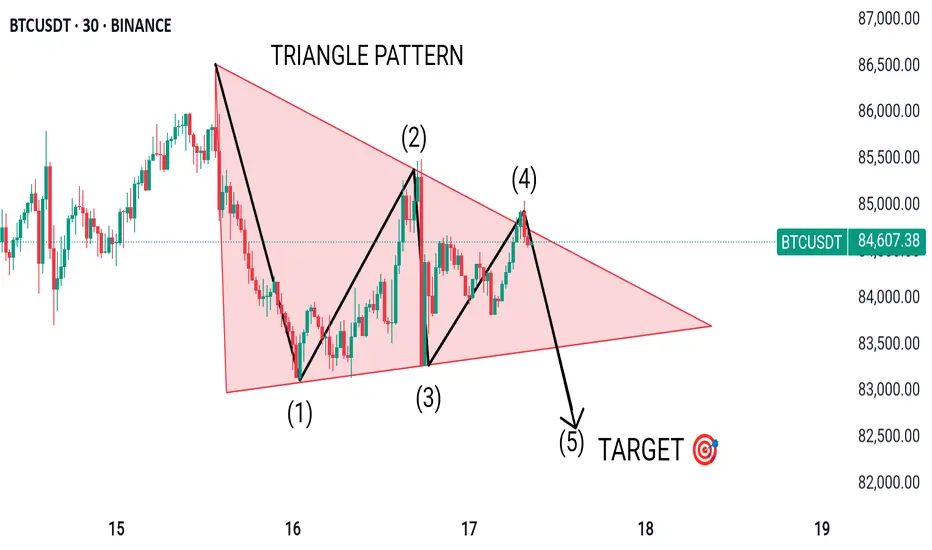
BTCUSDT TRIANGLE PATTERN IN 30-MI Created This BTCUSDT Chart Analysis In 30-M Tf
ENTRY LEVEL. 84600
Resistance zone : 84800
Target Well Be : 82800
BTCUSDT made Triangle Pattern, It's Take Resistance BTC went to Downtrend Soon
Bitcoin 15-Minute Chart – Projected Target PriceCurrently, the trend appears to be upward.
If the bullish trend continues, the price is expected to rise toward approximately 90,452.
On the other hand, if it declines, a drop toward around 83,808 is expected.
However, considering the current time of day, the market seems to be losing some momentum, so it's more reasonable to expect a short-term uptrend or sideways movement for now.

BTCUSDT at daily resistance, likely to head to 84kThe price has hit the daily resistance as expected in the quoted post. I see a pullback here which is already started. A short trade setup is favorable gere, We take a short in this zone and target towards daily support DS1. The correction can go upto weekly suppor WS1 but lets focus on this short trade first. risking 1.5% for 4.5% win.
