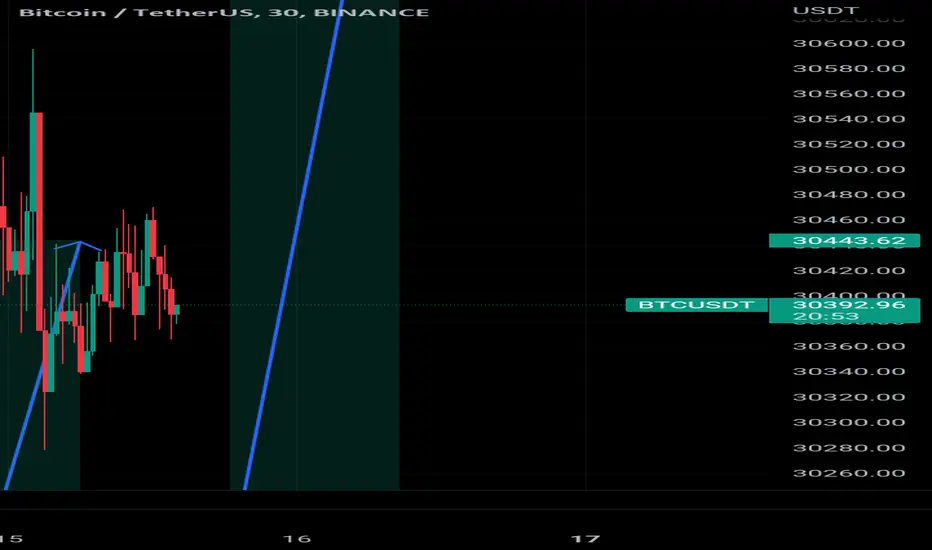
BTCUSDT to head towards 30836 at least from daily supportThe price will retrace to a level around the start of the daily support zone and will bounce back. A long will be favorable from that area around 30236. The preliminary target for this long should be 30836 but it may go higher. But for now lets focus on this 30836 level. Will hold or close depending on how the price reaches there.
Btcusdtbuy

BTCUSDT to head at least to 30836 from daily supportThe price will retrace to a level around the start of the daily support zone and will bounce back. A long will be favorable from that area around 30236. The preliminary target for this long should be 30836 but it may go higher. But for now lets focus on this 30836 level. Will hold or close depending on how the price reaches there.
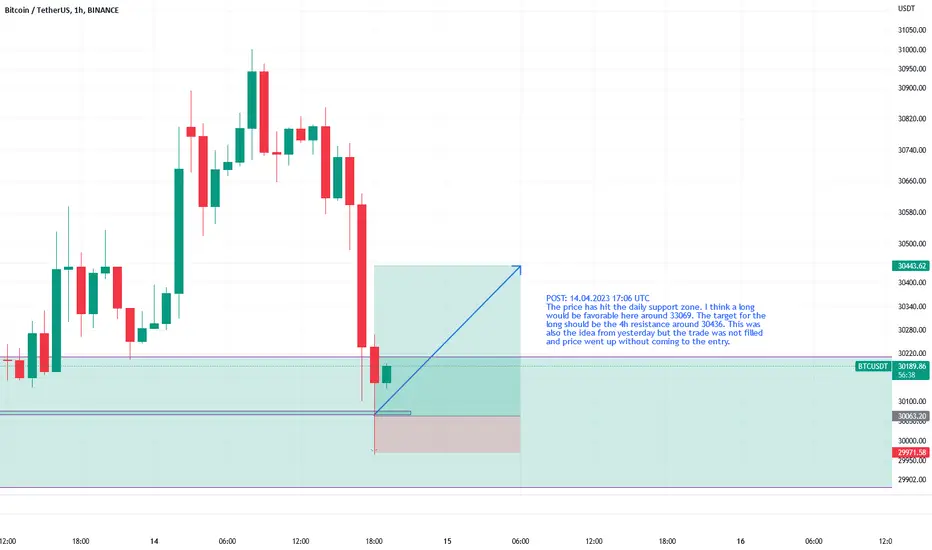
BTCUSDT at daily support, likely to head to 30436The price has hit the daily support zone. I think a long would be favorable here around 33069. The target for the long should be the 4h resistance around 30436. This was also the idea from yesterday but the trade was not filled and price went up without coming to the entry.
BTCUSDT long from 30069 towards 30436
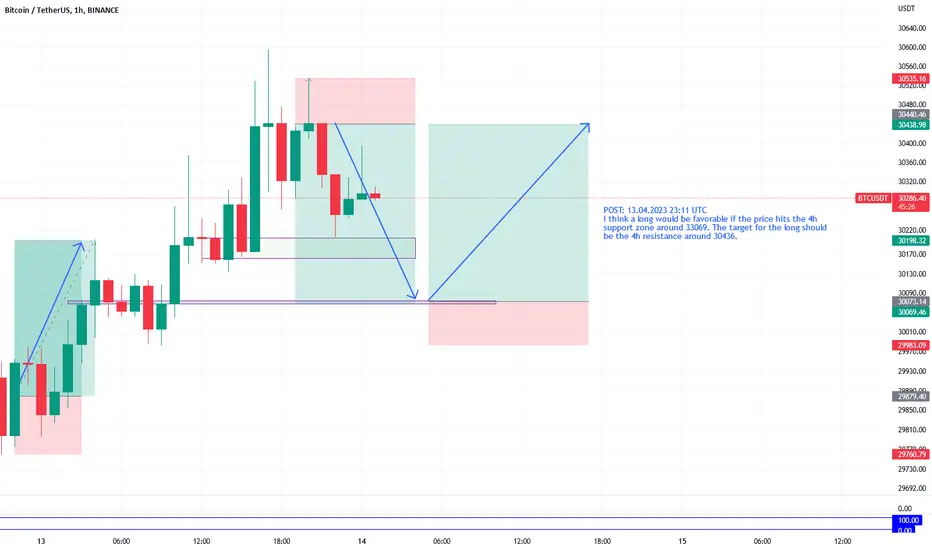
I think a long would be favorable if the price hits the 4h support zone around 33069. The target for the long should be the 4h resistance around 30436.
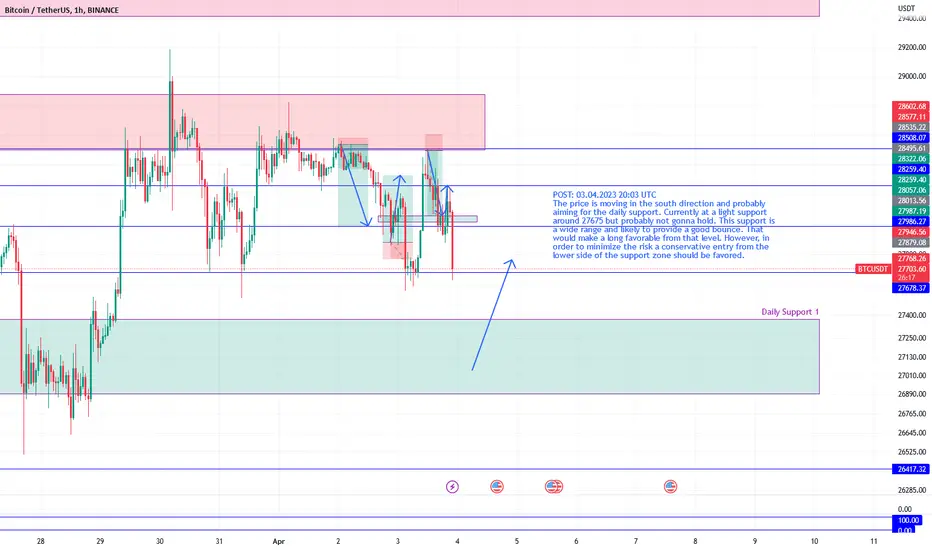
BTCUSDT may head to daily support before bounceThe price is moving in the south direction and probably aiming for the daily support. Currently at a light support around 27675 but probably not gonna hold. This support is a wide range and likely to provide a good bounce. That would make a long favorable from that level. However, in order to minimize the risk a conservative entry from the lower side of the support zone should be favored.
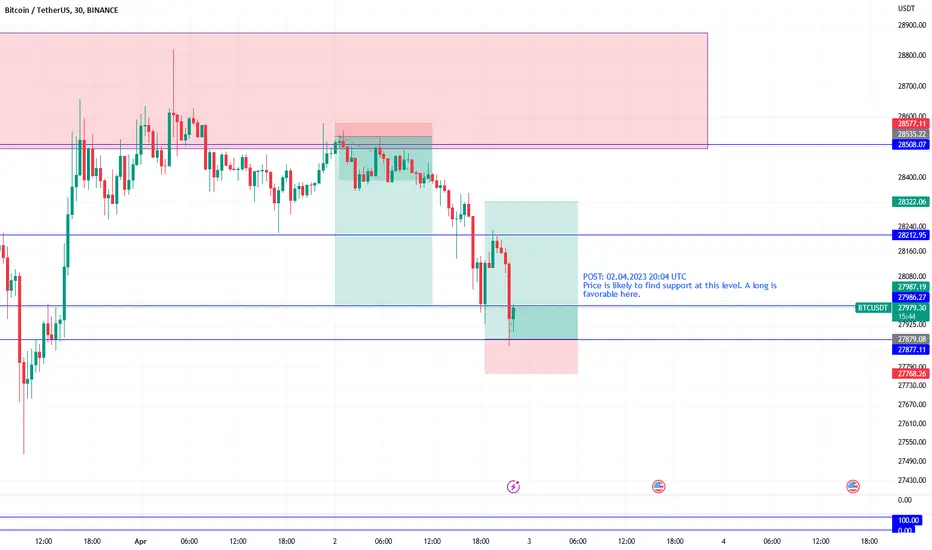
BTCUSDT likely to bounce here, a long is favorablePrice is likely to find support at this level. A long is favorable here.
#BTC is getting ready for the Big move!!Hi guys, This is CryptoMojo, One of the most active trading view authors and fastest-growing communities.
Consider following me for the latest updates and Long /Short calls on almost every exchange.
I post short mid and long-term trade setups too.
Let’s get to the chart!
I have tried my best to bring the best possible outcome to this chart, Do not consider financial advice.
#BTC UPDATE
BTC has completed an inverse head and shoulder pattern, which is technically a strong bullish pattern.
As of now, bulls are showing momentum as the bullish volume is expanding, and a solid breakout above the strong horizontal resistance of $25K.
we need a daily candle close above it, then it will be the confirmation of the bull run in the market.
I would also love to know your charts and views in the comment section.
Thank you

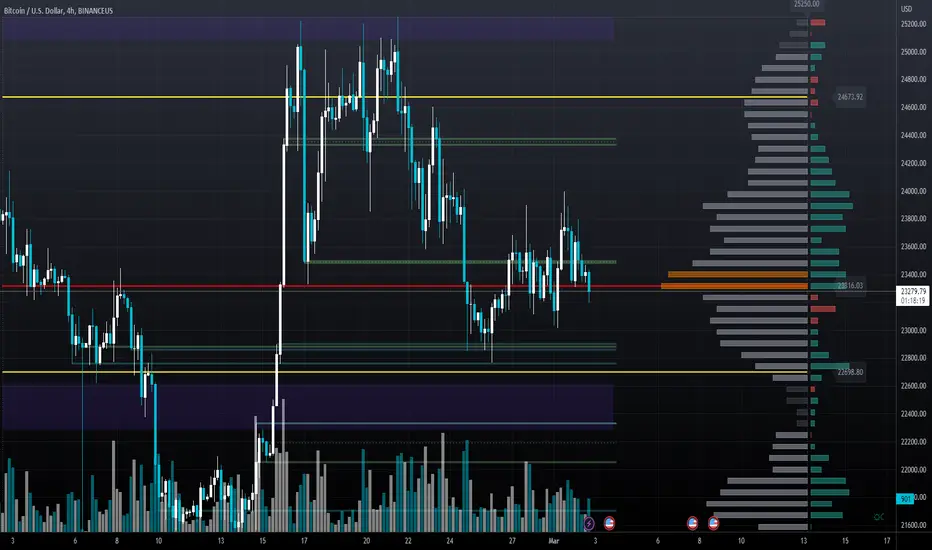
BTC/USD market commentary on 3/3/2023On the daily chart below, we can see that the buyers failed to break the 25K level with conviction and gave way to the sellers. The top came exactly at the previous August 2022 high and the divergence with the MACD signals that the price is likely to fall back to 21500 level which is the first target for the sellers.
There was some uncertainty in the market given the talk of seasonal factors skewing the economic data based on the month of January, but since the S&P Global US PMIs are based on the recent month of February and they came out strong, the market got that extra confirmation that things are really turning for the worse.
On the 4 hour chart below, we can see that the price has pulled back a bit into the 50% Fibonacci retracement level and it’s now eyeing a breakout to the downside of the counter-trendline. The breakout will be the signal for the sellers to start piling in with the target at 21500.
Yesterday, the market got some bad news again from the ISM Manufacturing PMI which showed a notable bounce back into expansion of the “priced paid” sub-index, used as a proxy for inflation. The market is increasingly worrying of another wave of inflation and a more hawkish Fed. These are bearish developments for the crypto market.
On the 1 hour chart below, we have a more closer look at the near-term price action. For the sellers the breakout of the counter-trendline is the one to watch, while for the buyers, the breakout above the 24000 level would give some hope for another test of the 25000 top.
Tomorrow, we have the ISM Non-Manufacturing PMI which is another key economic report. Strong readings will push the prices even lower, while weak data may give the buyers some relief.
Recommendations for trading BTCUSD:
SELL BTCUSD ( 24.200 - 24.000 )
Stoploss : 24.600
Takeprofit 1 : 22.700
Takeprofit 2 : 21.500
Takeprofit 3 : 21.000
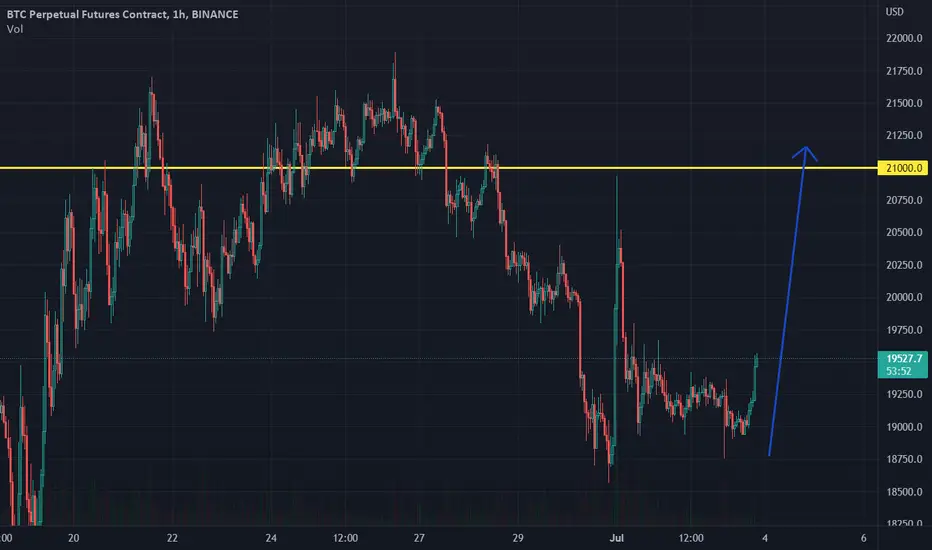
BUY BTCUSD ( 20.800 - 21.000 )
Stoploss : 20.500
Takeprofit 1 : 21.700
Takeprofit 2 : 22.300
Takeprofit 3 : 23.500
Note: Always install TP and SL in all cases
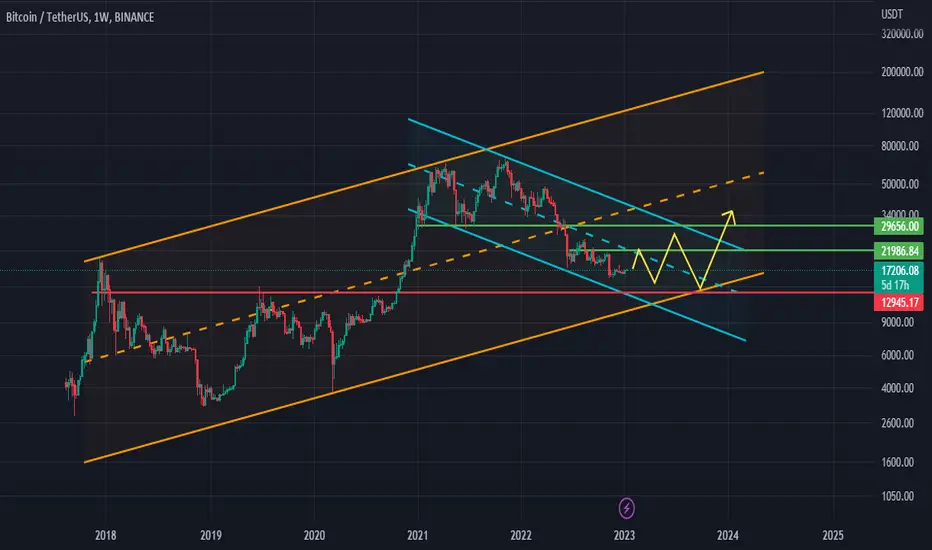
BTC :: BTC movement trend in W time frame .BTC/USDT :::
In general, it has been moving below the middle line of the blue channel for some time, and the trend will change with its failure .
The price may come down a little, but it is very small compared to the growth it will have in the future .
<<< Good luck >>>
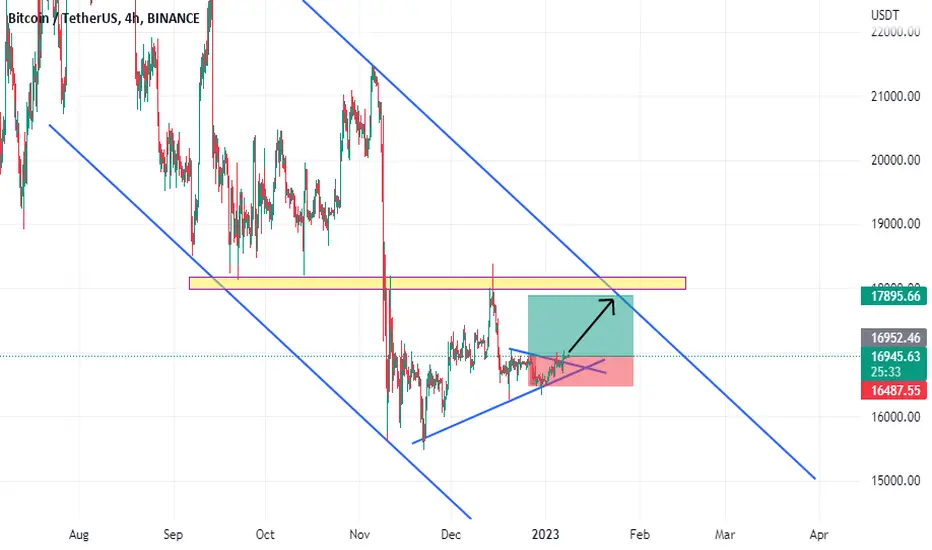
BTCUSDT : Long Trade , 4hBTCUSDT buy Entry : 16952.46
Stop : 16487.55 , Target : 17895.66
Risk/Reward Ratio : 2
#BTC: The bottom is in!🥶Hi guys, This is CryptoMojo, One of the most active trading view authors and fastest-growing communities.
Consider following me for the latest updates and Long /Short calls on almost every exchange.
I post short mid and long-term trade setups too.
Let’s get to the chart!
I have tried my best to bring the best possible outcome to this chart, Do not consider financial advice.
BTC UPDATE
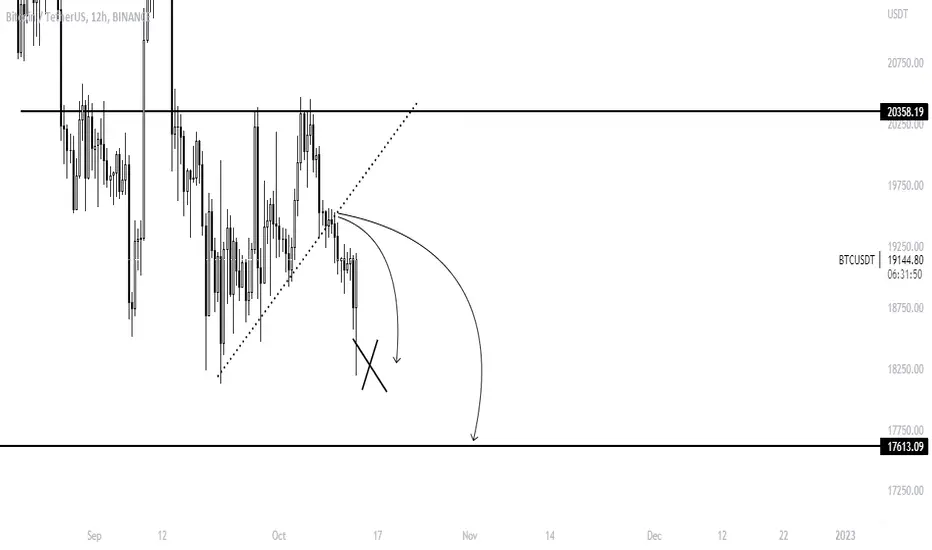
As Per chart #BTC is currently trading in Descending Triangle in Daily Chart which is a bearish pattern.
Now Two Scenarios:-
Scenario 1:- if BTC breakout Upward $20600 and the Daily candle closes above then We can see a 54% Upward move toward $31800
Scenario 2:- If $BTC failed to Hold Recently Bottom or Support Level $18000 then we can see $12000-$13000 Level.
So Watch closely and trade.
Support:- $12800
Resistance:- $20600/$25000/$31800
I know everyone is talking about this descending triangle pattern, but IMO BTC Will Surprise us As It Did Before The Start Of the bull run on July 2O21
Stay tuned
Stay tuned and don’t forget to like this chart.
This chart is likely to help you make better trade decisions if it does consider upvoting it.
I would also love to know your charts and views in the comment section.
Thank you

BTC/USDTBTC/USDT hit first target now wait for the the next one, i will update here if i see something wrong in market.
#BTC/USDT UPDATE Hi guys, This is CryptoMojo, One of the most active trading view authors and fastest-growing communities.
Consider following me for the latest updates and Long /Short calls on almost every exchange.
I post short mid and long-term trade setups too.
Let’s get to the chart!
I have tried my best to bring the best possible outcome to this chart, Do not consider it as financial advice.
#BTC/USDT ANALYSIS
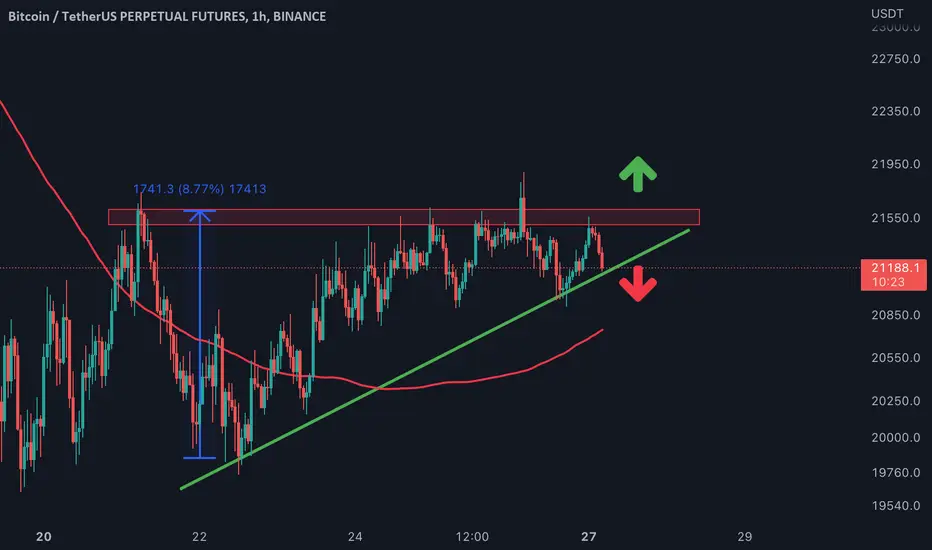
BTC make this ascending triangle pattern currently, it is holding the lower support of this pattern, A sustain break down or breakout will confirm the next the move of BTC.
Let's see how the market will react in few hours.
Stay tuned
This chart is likely to help you make better trade decisions if it does consider upvoting it.
I would also love to know your charts and views in the comment section.
Thank you
Btcusdt Do u think that the retest is done? Are you guys still with me?
Btc all the way up in open target
Risky
BTC Perfectly following the bullish patternBull Market ahead
Whether long or short term, a bullish pattern formed on the 4H TIMEFRAME
Safest play stop loss at 29k

#BTC/USDT UPDATE Hi guys, This is CryptoMojo, One of the most active trading view authors and fastest-growing communities.
Consider following me for the latest updates and Long /Short calls on almost every exchange.
I post short mid and long-term trade setups too.
Let’s get to the chart!
I have tried my best to bring the best possible outcome to this chart, Do not consider it as FINANCIAL ADVICE.
#BTC/USDT ANALYSIS
It bounced from the horizontal support and currently it is on the support of this horizontal and trendline. MACD crossover is showing bullish momentum.
IF IT BREAKS LOWER SUPPORT THE CART WILL BE INVALIDED.
We might see some upside move from here but a certain breakout or breakdown will come from its next move.
Stay tuned
This chart is likely to help you make better trade decisions if it does consider upvoting it.
I would also love to know your charts and views in the comment section.
Thank you
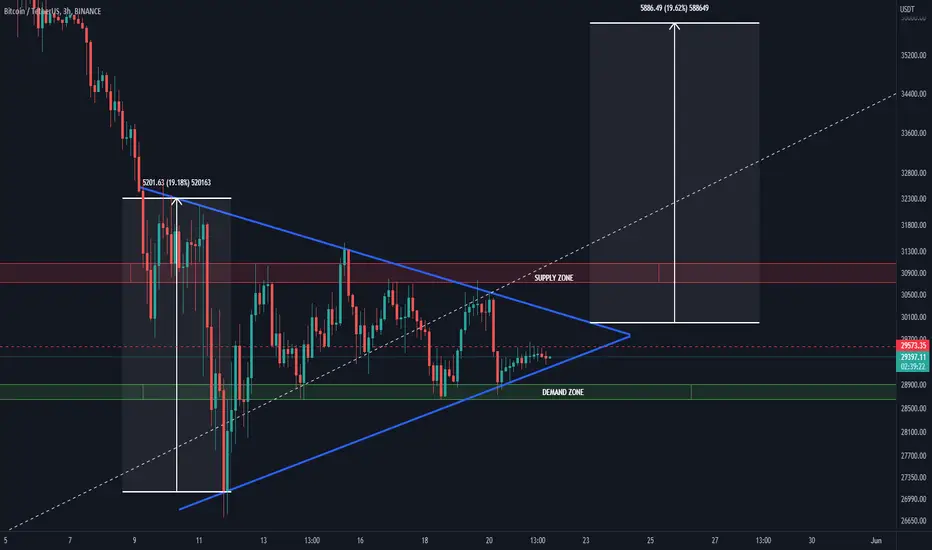
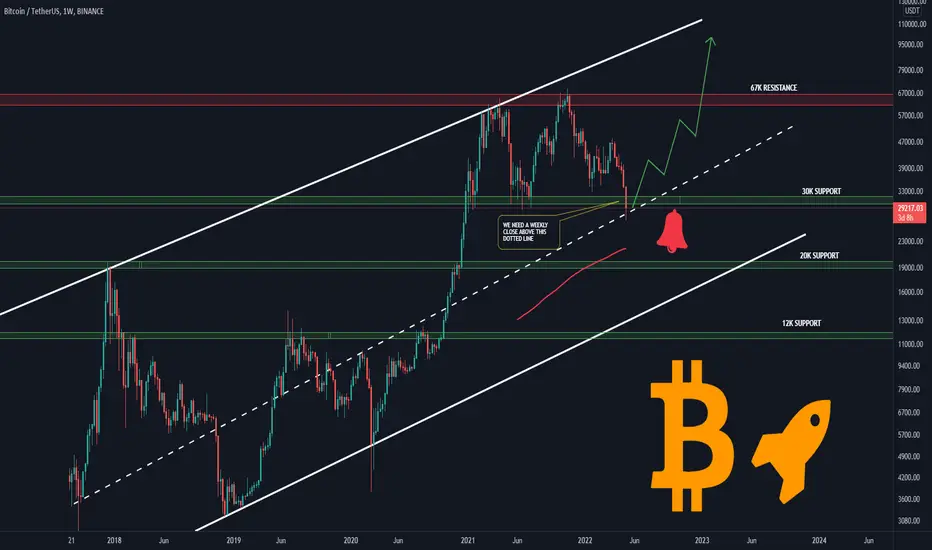
ARE WE REALLY IN A BEAR MARKET ?Hi guys, This is CryptoMojo, One of the most active trading view authors and fastest-growing communities.
Consider following me for the latest updates and Long /Short calls on almost every exchange.
I post short mid and long-term trade setups too.
Let’s get to the chart!
I have tried my best to bring the best possible outcome to this chart, Do not consider it FINANCIAL ADVICE.
#BTC WEEKLY UPDATE
BTC is forming this ascending channel pattern currently it lying on the support of this dotted line we need to close the weekly candle above this dotted line for being bullish if it breaks then we will see a drop up to the lower support.
let's see how the weekly candle closes
This chart is likely to help you in making better trade decisions if it did consider upvoting this chart.
I would also love to know your charts and views in the comment section.
Thank you
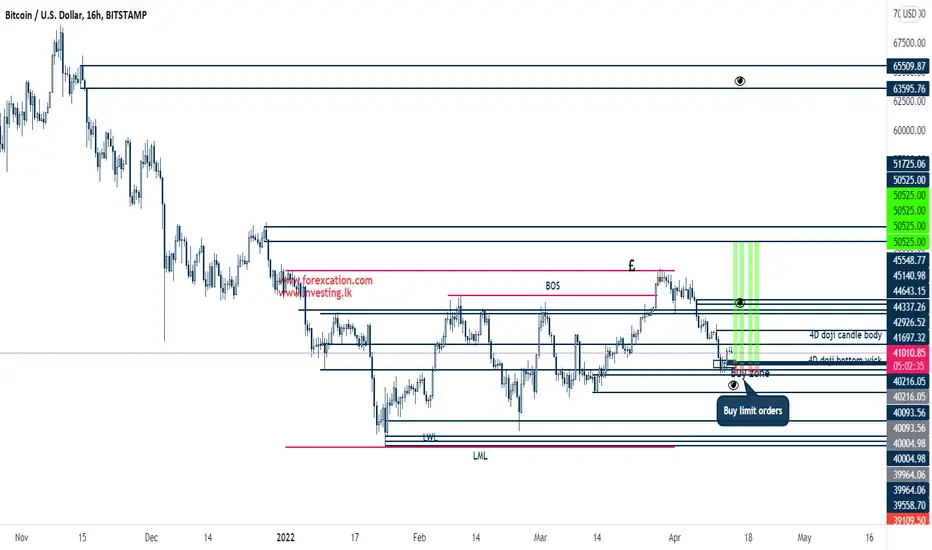
BTCUSD - LONG (BUY)Daily structure broke into an uptrend. But what I am concerned about is it's not the uptrend this buy will be for a long time sell as per the higher time frames. In the meantime, the last sell to buy was collected as per the daily chart. If you look into 4h time frame, you can get an idea of where you want to buy and why it is that because the last sell to buy is there where you can enter the trade for a buy which I marked the entry levels.
Note: Trade at your own risk
Happy trading!
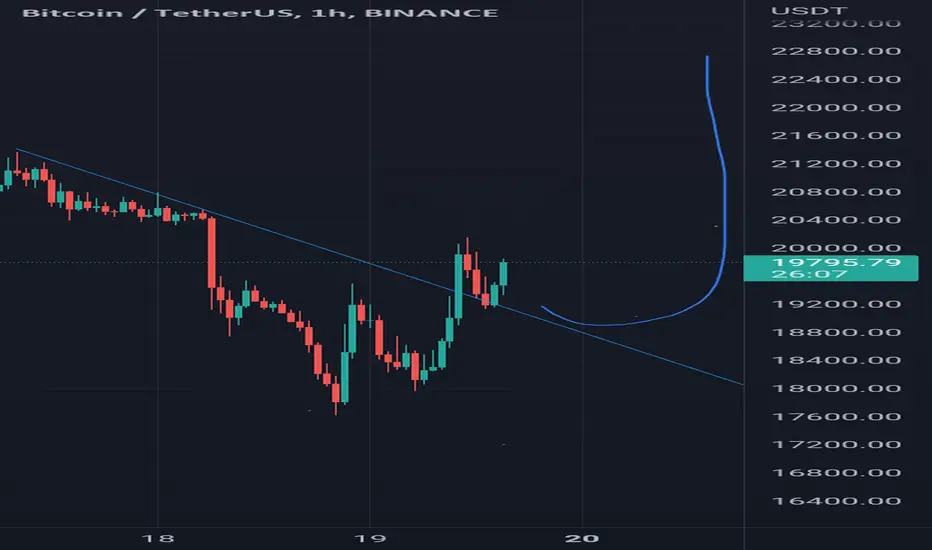
BTCUSDT rises up again?On BTCUSDT we have price action (breaking the latest slope), if we add the normal divergence of buy H1 and the hidden divergence of buy from daily and if the price exceeds 44.000 usd (to be psihological level), then we will have an increase of price, at least up to the previous maximum of 48.000 usd (psihological level).

BTC IS BREAKING OUT BUT NEED TO HOLD THIS LEVEL.Hi guys, This is CryptoMojo, One of the most active trading view authors and fastest-growing communities.
Do consider following me for the latest updates and Long /Short calls on almost every exchange.
I post short mid and long-term trade setups too.
Let’s get to the chart!
I have tried my best to bring the best possible outcome in this chart, Do not consider it as an
#BTC/USDT ANALYSIS
BTC is still trading above the triangle but the previous candle close does not give such bullish vibes. Leaving a long wick to the upside which is not good at all but as long as BTC trades above $40.5k we are fine.
MACD crossover is showing bullish momentum.
Let's see how the market reacts in a few hours.
This chart is likely to help you in making better trade decisions, if it did do consider upvoting this chart.
Would also love to know your charts and views in the comment section.
Thank you

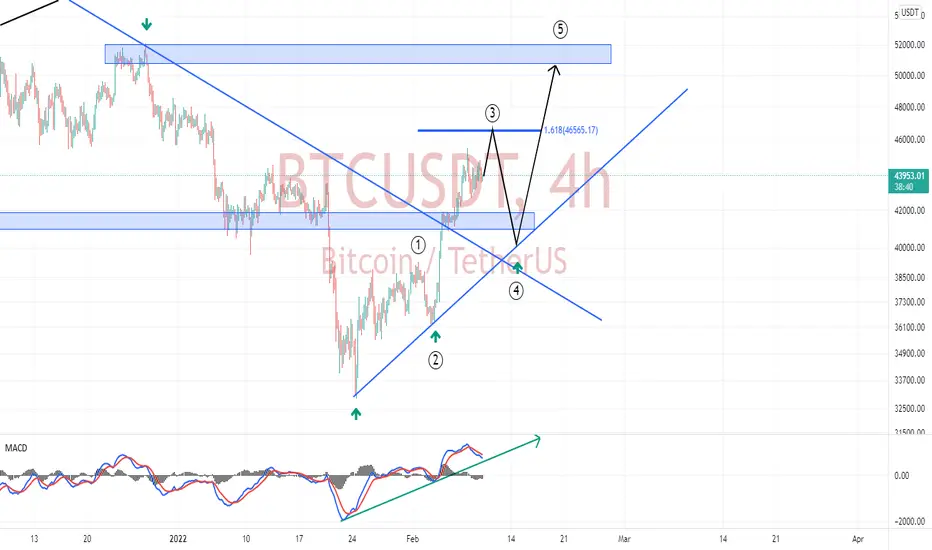
BTCHello traders. The price is on an uptrend and is now in the third stimulus wave and I predict it will rise to the range of 51,000.
Bitcoin 4HrHello traders. +RD is evident in the daily bitcoin time frame. I expect bitcoin to increase after another decline. Be profitable
