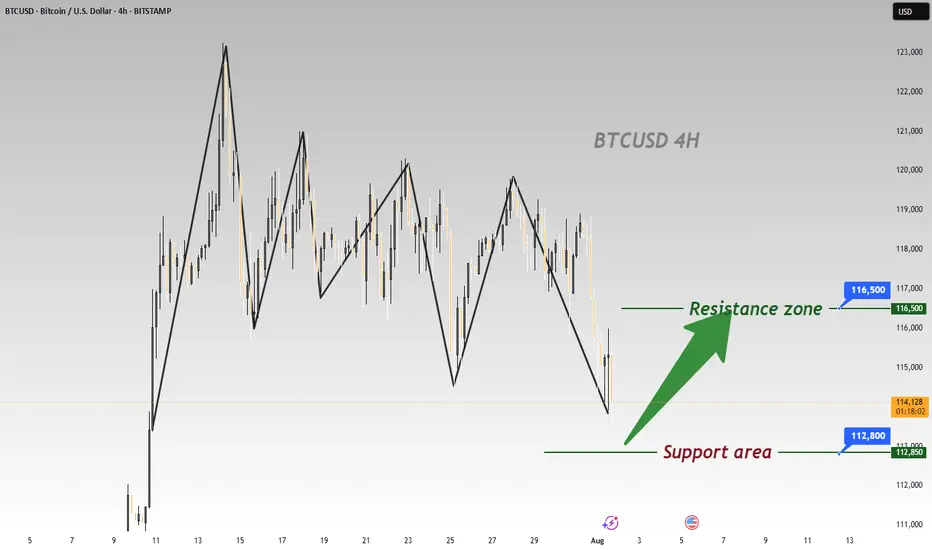
BTC Plummets Post-NFP; Go Long for Rebound to 116500BTC has plummeted significantly under the influence of the non-farm payroll data 📉, and now is an excellent opportunity to go long. Its Support level is around 112800, and according to the current trend, we can wait for a rebound to around 116500.
⚡️⚡️⚡️ BTCUSD ⚡️⚡️⚡️
🚀 Buy@ 113000 - 113800
🚀 TP 114500 - 115500 - 116500
Daily updates bring you precise trading signals 📊 When you hit a snag in trading, these signals stand as your trustworthy compass 🧭 Don’t hesitate to take a look—sincerely hoping they’ll be a huge help to you 🌟 👇
BTCUSDTPERP
Is the #BTC pullback over?📊 Is the #BTC pullback over?
🧠From a structural perspective, a bearish structure has formed on both the 1-hour and 4-hour charts, so we should be wary of the risk of a further pullback.
➡️Resistance is the area formed by the two necklines (114675-115729).
Support is primarily the overlap between the yellow and green areas (110000-111688). If we can establish a bullish structure on the 1-hour chart here, we still have a chance of continuing the bullish trend.
🤜If you like my analysis, please like 💖 and share 💬 BITGET:BTCUSDT.P

BTC Next Move Toward $150K?Bitcoin recently broke out above a long-standing resistance zone ($110K–$115K), supported by a clean move through the volume profile high node. After testing local highs, BTC is now pulling back to retest the breakout area, a critical level that could act as new support.
Key Points:
Breakout Retest: Price has pulled back into the breakout zone around $114K, aligning with strong previous resistance that may now flip to support.
Volume Profile: A strong high-volume node is visible below ($105K–$110K), which reinforces this area as a major demand zone.
EMA Confluence: The 50-day and 100-day EMAs are trending upward and aligning near the retest area, providing additional support.
If this level holds, BTC could resume its bullish leg toward the $150K level.
Cheers
Hexa

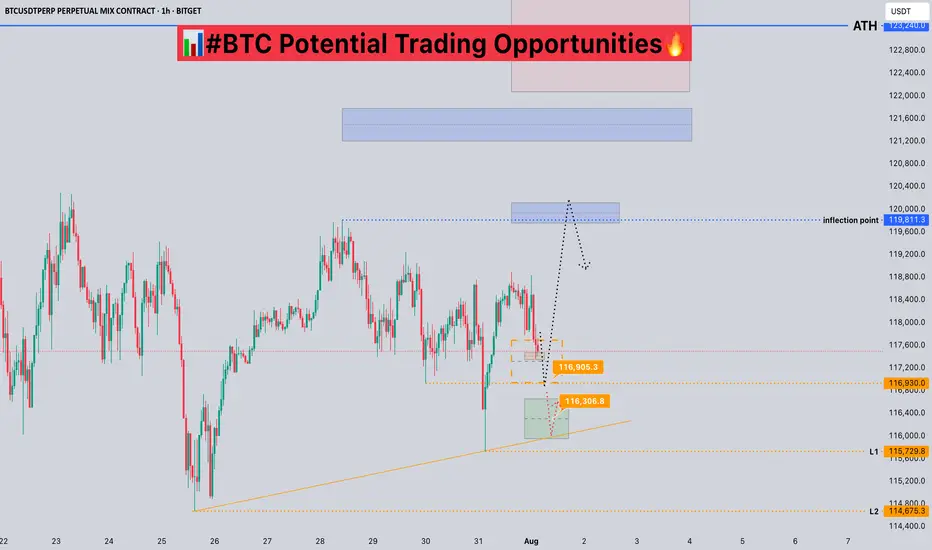
#BTC Potential Trading Opportunities📊#BTC Potential Trading Opportunities🔥
🧠We've been trading sideways for quite some time, and selling pressure has largely been exhausted, so we need to find support to enter a long trade.
➡️From a structural perspective, there's a chance for a bullish head-and-shoulders pattern to form. If this pattern holds, we could see a move above $120,000 or even higher.
Potential support is likely between $116,300 and $117,000.
Short-term resistance is around $120,000.
⚠️Note: A break below L1 would destabilize the structure and significantly reduce bullish expectations.
🤜If you like my analysis, please like 💖 and share 💬 BITGET:BTCUSDT.P
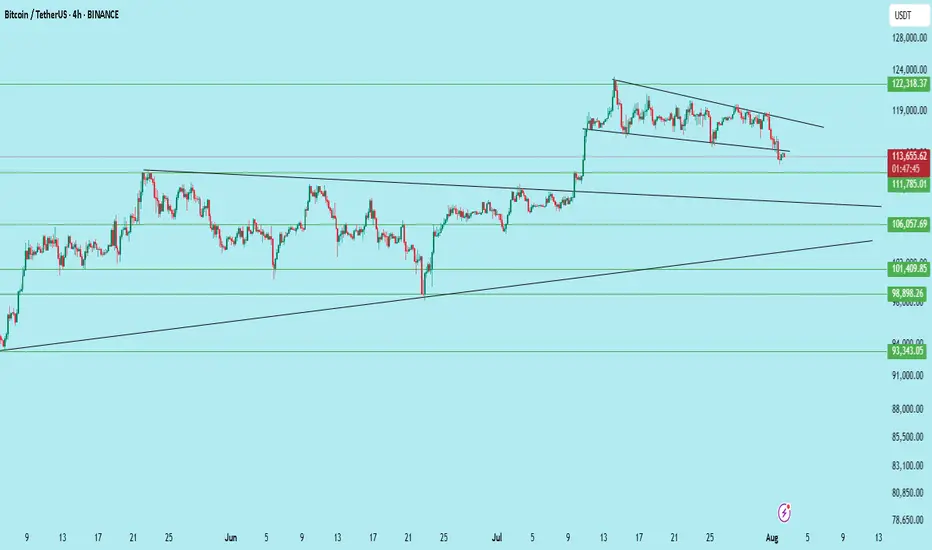
$BTC /USDT – Breakdown from Channel, Bears Gaining ControlBitcoin has broken down from its descending channel on the 4H chart after repeated rejection from the upper trendline. Price is now hovering near key support at $111,785.
Key Technicals:
Rejection from the descending trendline resistance
Breakdown of the mini-channel structure
Current price: $113,637
Support levels:
$111,785 (Immediate)
$106,057
$101,409
$98,398
Bearish continuation is likely if $111,785 breaks with volume
If the $111.7k zone fails to hold, BTC could see further downside toward $106k and even $98k in the coming sessions.
Invalidation: Bullish only on reclaim of $117K+ with strength.
DYOR | Not Financial Advice
Bullish Flag Forming on BTCUSDT – Is the Next Big Move Coming?🧠 Complete and Insightful Technical Analysis:
The 12H BTCUSDT chart is currently showcasing a textbook Bullish Flag pattern, a powerful continuation structure that often precedes major upward moves.
---
🏗️ Pattern Breakdown: Bullish Flag
1. Flagpole:
The sharp breakout from around $107,000 to $123,000 marks the impulsive rally — this is the flagpole, created by strong bullish momentum.
Represents the "lift-off" phase where buyers dominate the market.
2. Flag (Consolidation Phase):
After the strong rally, price consolidates inside a downward-sloping parallel channel, forming the flag.
This pullback is healthy, characterized by declining volume, a key feature of the Bullish Flag.
Indicates temporary profit-taking before continuation.
3. Confirmation:
A breakout above the flag's upper boundary (around $123,000 – $124,000) with strong volume would confirm the pattern.
Breakout traders often use this as a high-probability entry.
---
📈 Bullish Scenario (High Probability):
If BTC breaks above the flag structure:
🎯 Measured Move Target (Based on Flagpole Height):
$123,000 + ($123,000 - $107,000) = $139,000
🚀 Potential for further upside if macro conditions and sentiment support the move, possibly reaching $135,000+ in the medium term.
Confirmation Required: A strong candle close above $123,500 with volume spike.
---
📉 Bearish Scenario (If Breakdown Occurs):
If BTC breaks down below the flag (~$117,000):
Retracement likely toward previous breakout zones at $112,000 – $109,000
Such a breakdown could turn the current structure into a fakeout or bear trap
However, this zone may present a strong re-entry opportunity for long-term bulls.
---
📚 Educational Insight for Traders:
Bullish Flags often appear during strong uptrends, acting as a pause before the next leg up.
A healthy pattern shows shrinking volume during the flag and rising volume at breakout.
Traders should monitor key horizontal resistance and volume behavior for confirmation.
---
🧭 Conclusion:
BTCUSDT is at a critical technical juncture. The formation of a clean Bullish Flag suggests the potential for a major continuation rally. Confirmation through a breakout is key — this is the time to prepare, not react.
#BTCUSDT #Bitcoin #BullishFlag #BTCBreakout #CryptoTechnicalAnalysis #CryptoTrading #PriceAction #BTCAnalysis #BitcoinPattern #CryptoEducation #BTCFlag #ContinuationPattern
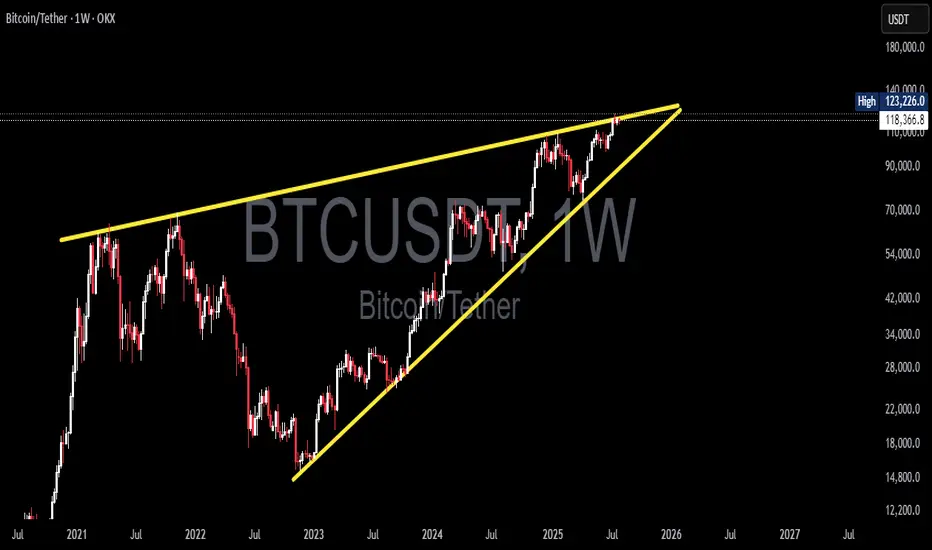
Bitcoin at a Decisive Moment! Rising Wedge Formed — Breakout?🧠 In-Depth Technical Analysis (BTCUSDT – Weekly Timeframe)
Bitcoin is currently trading within a large Rising Wedge pattern, formed over the long term from late 2022 to mid-2025. This structure is typically a bearish reversal formation, although it can also lead to a breakout in strong bull markets.
The wedge is defined by:
Consistently higher lows on the lower trendline
A gradually rising upper resistance line that currently caps price around $123K–$125K
Decreasing volume, indicating consolidation and energy buildup near the apex
This wedge reflects a period of euphoric price action post-2022 bear market accumulation, with price now testing the top of a historically significant resistance zone.
---
📊 Key Price Levels:
🔹 Current Price: ≈ $118,436
🔹 Recent Weekly High: $123,226
🔹 Critical Resistance (Wedge Top): $123,000–$125,000
🔹 Dynamic Support: Rising wedge base (~$90,000–$95,000)
---
🐂 Bullish Scenario: “Historic Breakout Incoming”
If BTC successfully breaks above the wedge’s upper resistance and closes a weekly candle above $125K with strong volume, it would signal a confirmed breakout from the long-term wedge structure.
📈 Upside Targets:
🎯 Target 1: $140,000
🎯 Target 2: $155,000+ (based on Fibonacci extension and macro targets)
🚀 A breakout of this magnitude may trigger a new parabolic rally, especially if accompanied by:
Increased institutional adoption
Spot ETF inflows
Favorable macroeconomic shifts (e.g., rate cuts)
---
🐻 Bearish Scenario: “False Breakout or Breakdown Risk”
If Bitcoin fails to break out and faces strong rejection from the resistance zone (possibly a false breakout), the rising wedge formation may break down — leading to a steep correction.
📉 A breakdown from this structure often leads to sharp drops due to:
Overextension of the current trend
Distribution phase by smart money
🎯 Downside Targets:
Support 1: $95,000–$90,000
Support 2: $76,000
Major Support: $54,000 (historical demand & EMA zones)
---
🔍 Optional Indicators for Chart Confirmation:
Weekly RSI: Watch for bearish divergence
Volume Profile: Can highlight distribution or accumulation zones
EMA 21/50: Ideal for identifying dynamic support levels in retracements
---
📌 Conclusion:
Bitcoin is at a crucial inflection point within this multi-year Rising Wedge. A confirmed breakout could lead to new all-time highs, while a breakdown may trigger a broad correction. Traders should prepare for high volatility, wait for clear confirmation signals, and manage risk wisely in this pivotal zone.
#Bitcoin #BTCUSDT #RisingWedge #BTCBreakout #TechnicalAnalysis #CryptoMarket #PriceAction #BearishReversal #CryptoSignal #ChartPattern #BitcoinAnalysis #Cryptocurrency
Will BTC ever reach 130k?Yes in your dreams, I am joking, it can but not now, blue shows what fall can trigger when massive selloff happens, and here it looks the smaller momentum to happen soon!

Important Volatility Period: August 2nd - 5th
Hello, fellow traders!
Follow us for quick updates.
Have a great day!
-------------------------------------
(BTCUSDT 1M Chart)
Let's take a moment to check the trend before the new month begins.
There have been two major declines so far, and a third major decline is expected next year.
For the reason, please refer to the "3-Year Bull Market, 1-Year Bear Market Pattern" section below.
-
My target point for 2025 is around the Fibonacci ratio of 2.618 (133889.92).
However, if the price surges further, it could touch the Fibonacci range of 3 (151018.77) to 3.14 (157296.36).
If it rises above 133K, it's expected that prices will never fall below 43823.59 again.
Since the HA-Low indicator hasn't yet been created on the 1M chart, we need to monitor whether it appears when a downtrend begins.
Based on the current trend, the HA-Low indicator is expected to form around 73499.86.
More details will likely be available once the movement begins.
-
The basic trading strategy involves buying in the DOM(-60) ~ HA-Low range and selling in the HA-High ~ DOM(60) range.
However, if the price rises above the HA-High ~ DOM(60) range, a step-up trend is likely, while if the price falls below the DOM(-60) ~ HA-Low range, a step-down trend is likely.
Therefore, the basic trading strategy should be a segmented trading approach.
The further away from the HA-High indicator, the more likely it is that the DOM(60) indicator will act as a strong resistance when it forms.
Therefore, if the current price and the HA-High indicator are trading far apart, and the DOM(60) indicator forms, it is expected to face significant resistance.
-
Looking at the current trend formation, the high trend line is drawn correctly, but the low trend line is not.
This is because the StochRSI indicator failed to enter the oversold zone.
Therefore, the low trend line is marked with a dotted line, not a solid line.
Therefore, what we should pay attention to is the high trend line.
We need to see if the uptrend can continue along the high trend line.
-
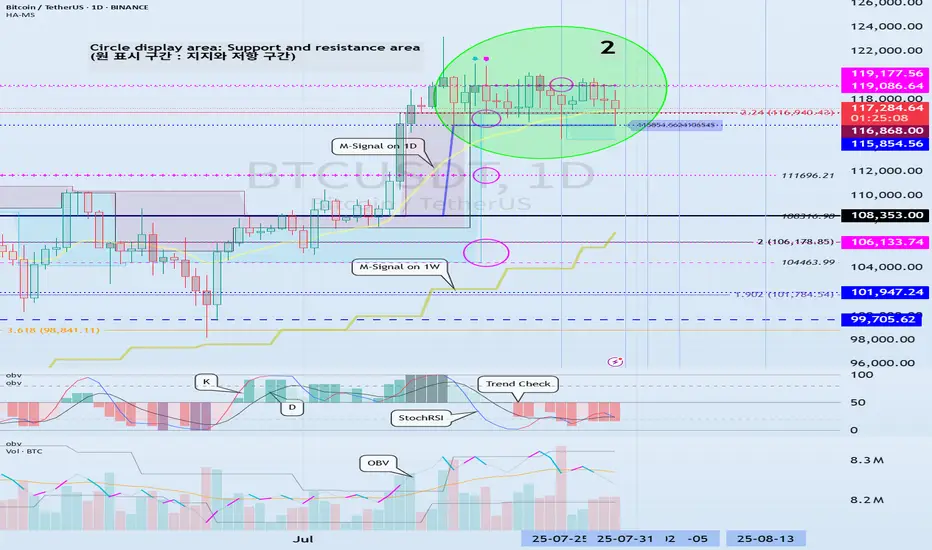
(1D chart)
If we use the trend lines drawn on the 1M, 1W, and 1D charts to predict periods of volatility, the periods around August 5th and August 13th are significant periods of volatility.
By breaking this down further, the volatility periods are around July 31st, August 2nd-5th, and August 13th.
Therefore, trading strategies should be developed based on the assumption that the volatility period extends from July 30th to August 14th.
The current price is moving sideways in the 115,854.56-119,177.56 range.
This range, the HA-High ~ DOM (60), is a crucial area to consider for support.
This will determine whether the price will continue its upward trend by rising above 119,177.56, or whether it will turn downward by falling below 115,854.56.
If the price falls below 115854.56, it is expected to meet the M-Signal indicator on the 1W chart and reestablish the trend.
The HA-High indicator on the 1W chart is forming at 99705.62, and the DOM (60) indicator on the 1W chart is forming at 119086.64.
Therefore, when the price declines, it is important to check where the HA-High indicator on the 1W chart forms and determine whether there is support near that point.
-
The On-Board Value (OBV) indicator within the Low Line ~ High Line channel is showing a downward trend.
If the OBV falls below the Low Line, the price is expected to plummet.
Therefore, it is necessary to closely monitor the movements of the OBV indicator.
The Trend Check indicator is a comprehensive evaluation of the StochRSI, PVT-MACD Oscillator, and On-Board Value (OBV) indicator.
The TC (Trend Check) indicator interprets a rise from the 0 point as a buying trend, while a decline indicates a selling trend.
In other words, a rise from the 0 point is likely to indicate an uptrend, while a decline is likely to indicate a downtrend.
Currently, the TC (Trend Check) indicator is below the 0 point, suggesting a high probability of a downtrend.
However, if the TC (Trend Check) indicator touches a high or low, the trend may reverse.
In other words, touching a high increases the likelihood of a reversal from an uptrend to a downtrend, while touching a low increases the likelihood of a reversal from a downtrend to an uptrend.
When such movements occur, it's important to consider the support and resistance levels formed around the price level to determine a response.
In other words, consider the support and resistance levels formed at the current price level.
As a significant period of volatility approaches, prepare to transition from box trading to trend trading.
-
Thank you for reading to the end.
I wish you successful trading.
--------------------------------------------------
- Here's an explanation of the big picture.
(3-year bull market, 1-year bear market pattern)
I'll explain more in detail when the bear market begins.
------------------------------------------------------
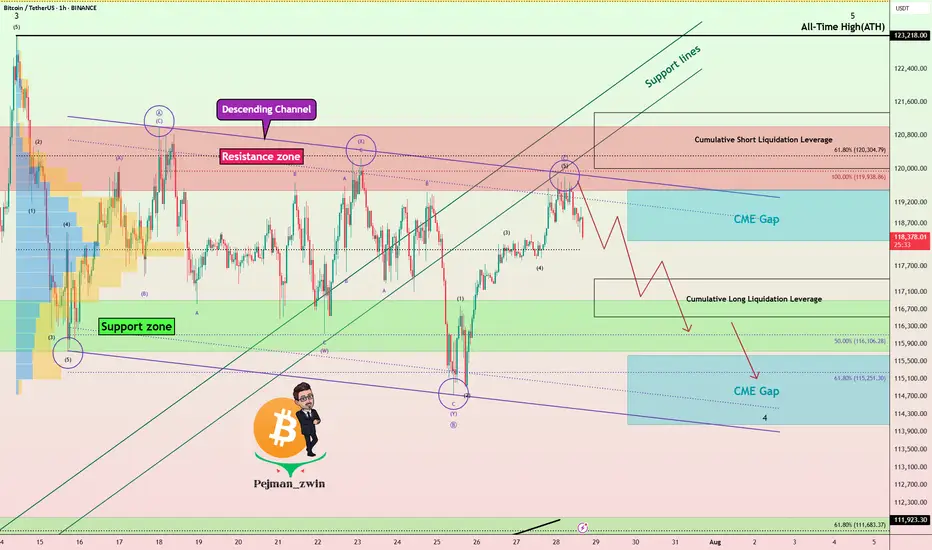
White House Crypto Report Incoming: Will BTC Pump from Support? One of the important news for Bitcoin ( BINANCE:BTCUSDT ) that was released today was that " White House confirms first Bitcoin and crypto report will be released TOMORROW ". Bitcoin is likely to rise with the release of the White House report .
What do you think? At least a temporary pump may be in store for Bitcoin.
Bitcoin fell to the Support zone($116,900-$115,730) and filled the New CME Gap( $119,500-$118,295) as I expected in the previous idea .
Bitcoin is currently moving near the Support zone($116,900-$115,730) , Cumulative Long Liquidation Leverage($116,828-$115,710) and Potential Reversal Zone(PRZ) .
I expect Bitcoin to rise from the Support zone($116,900-$115,730) to at least $118,680(First Taregt) .
Second target: Upper line of the descending channel
Note: Stop Loss: $114,680 = Worst Stop Loss(SL)
CME Gap: $115,060-$114,947
Cumulative Short Liquidation Leverage: $118,827-$118,298
Cumulative Short Liquidation Leverage: $120,144-$119,200
Please respect each other's ideas and express them politely if you agree or disagree.
Bitcoin Analyze (BTCUSDT), 1-hour time frame.
Be sure to follow the updated ideas.
Do not forget to put a Stop loss for your positions (For every position you want to open).
Please follow your strategy and updates; this is just my Idea, and I will gladly see your ideas in this post.
Please do not forget the ✅' like '✅ button 🙏😊 & Share it with your friends; thanks, and Trade safe.
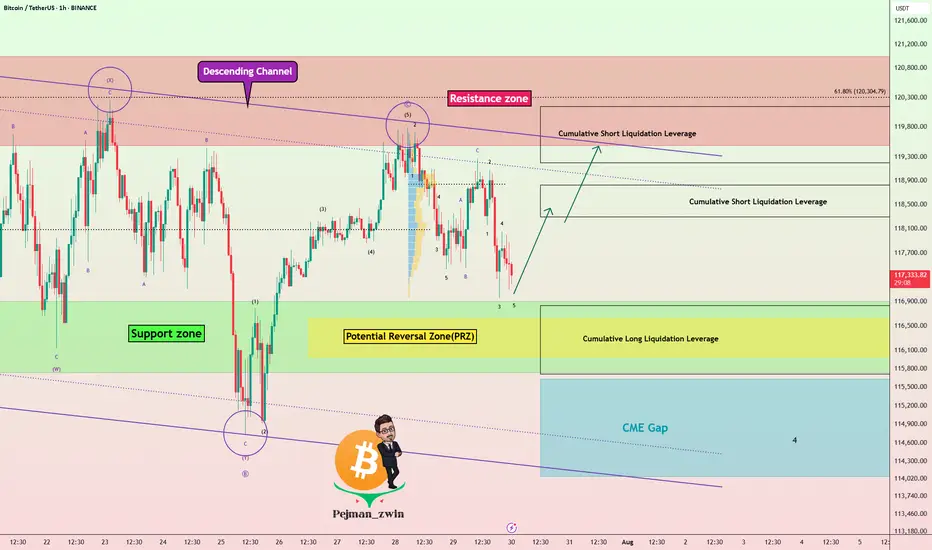
Bitcoin Rejected Near $120K – Bears Wake Up!First of all, I have to say that Bitcoin’s movements over the last 12 days have been a bit difficult to trade , generally, the hardest market to make a profit in is the range market with a swing movement .
Bitcoin( BINANCE:BTCUSDT ) is currently trading near the Resistance zone($121,000-$119,500) , Cumulative Short Liquidation Leverage($121,336-$120,000) , and the upper line of the descending channel .
Since Bitcoin has lost support lines , we can consider this increase in Bitcoin over the last two days as a pullback to the support lines(broken) . Do you agree with me!?
In terms of Elliott Wave theory , it appears that Bitcoin is still completing the main wave B. The main wave B is a Regular Flat(ABC/3-3-5) . The structure of the microwave B of the main wave B was a Double Three Correction(WXY) .
Additionally, the SPX 500 index ( SP:SPX ), which Bitcoin is correlated with , is poised for a correction in my opinion, which could also impact Bitcoin .
Also, unlike previous Mondays, MicroStrategy has NOT purchased Bitcoin , and the company currently holds 607,770 BTC .
Old Bitcoin wallets also seem to be waking up to the fact that they can create movements in the crypto market . " In recent days, 471,867.8 BTC worth $56.39 million have been transferred from old wallets from 2012 to 2017 . ".
I expect Bitcoin to decline to at least the Support zone($116,900-$115,730) and fill the CME Gaps in the coming hours .
New CME Gap: $119,500-$118,295
CME Gap: $115,060-$114,947
Cumulative Long Liquidation Leverage: $117,401-$116,615
Please respect each other's ideas and express them politely if you agree or disagree.
Bitcoin Analyze (BTCUSDT), 1-hour time frame.
Be sure to follow the updated ideas.
Do not forget to put a Stop loss for your positions (For every position you want to open).
Please follow your strategy and updates; this is just my Idea, and I will gladly see your ideas in this post.
Please do not forget the ✅' like '✅ button 🙏😊 & Share it with your friends; thanks, and Trade safe.
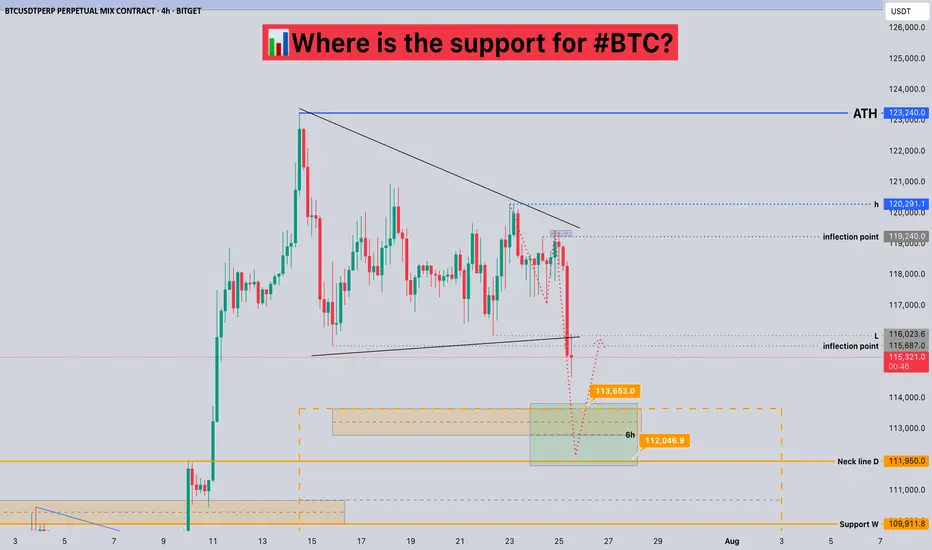
Where is the support for #BTC?📊Where is the support for #BTC?
🧠From a structural perspective, we did not stabilize after breaking through the inflection point of 119240, but broke down quickly. According to the current structure, the short-term support area is 112000-113700.
➡️From a morphological perspective, we failed to successfully break through the h point, but chose to break down, so we need to be vigilant about further pullbacks!
🤜If you like my analysis, please like 💖 and share 💬
BITGET:BTCUSDT.P
Bitcoin Correction Maturing – Long Setup Brewing!Bitcoin ( BINANCE:BTCUSDT ) has fallen by more than -4% over the past day.
Let's take a look at the reasons for the decline.
One of the key reasons behind Bitcoin’s decline in the past 24 hours ( July 25 ) could be the reduced likelihood of Jerome Powell being replaced as Chair of the Federal Reserve.
In recent days, market participants were speculating that Donald Trump might replace Powell — a scenario that was considered bullish for risk assets like Bitcoin. However, recent reports of a meeting between Trump and Powell, and signs that Powell might not be dismissed, have weakened this fundamental narrative.
This meeting may signal a truce or reduced tension between Trump’s team and Powell , which could imply a continuation of current Fed policies. That’s bad news for Bitcoin, as it removes a potential psychological tailwind from the market and dampens speculative sentiment.
As a result:
Over $500 million in liquidations(Long Positions) occurred
Weak inflows into Bitcoin ETFs
A stronger U.S. Dollar Index ( TVC:DXY )
And declining Gold( OANDA:XAUUSD ) prices over the past two days
all added additional selling pressure on BTC. Now let's take a look at Bitcoin's conditions on the 4-hour time frame .
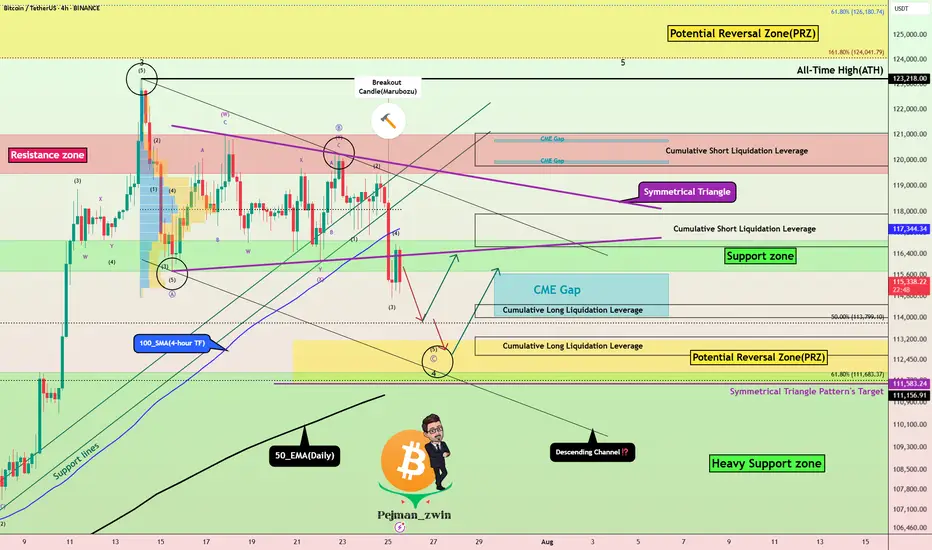
Bitcoin currently appears to have broken the Support zone($116,900-$115,730) , Support lines , 100_SMA(4-hour TF) , and the lower line of the Symmetrical Triangle Pattern with a bearish Marubozu candle .
Note : In general, trading was difficult when Bitcoin was inside a symmetrical triangle (about 10 days).
It also seems that the pullback to these zones has ended and Bitcoin is waiting for the next decline .
In terms of Elliott Wave theory , Bitcoin appears to be completing microwave 5 of microwave C of major wave 4 . There is a possibility that main wave 4 will create a descending channel and complete at the bottom of the descending channel (at Potential Reversal Zone(PRZ) ).
I expect Bitcoin to start rising again after completing the CME Gap($115,060-$114,947) from Cumulative Long Liquidation Leverage($114,480-$114,000) or Cumulative Long Liquidation Leverage($113,284-$112,603) near the PRZ and Heavy Support zone($111,980-$105,820) .
Cumulative Short Liquidation Leverage: $117,904-$116,665
Cumulative Short Liquidation Leverage: $121,046-$119,761
Do you think Bitcoin has entered a major correction, or does it still have a chance to create a new ATH?
Please respect each other's ideas and express them politely if you agree or disagree.
Bitcoin Analyze (BTCUSDT), 4-hour time frame.
Be sure to follow the updated ideas.
Do not forget to put a Stop loss for your positions (For every position you want to open).
Please follow your strategy and updates; this is just my Idea, and I will gladly see your ideas in this post.
Please do not forget the ✅' like '✅ button 🙏😊 & Share it with your friends; thanks, and Trade safe.
BTCUSDT analysis – 1H & 4H OB setups✅ The overall market trend is still bullish on the 1H and 4H timeframes. However, we’re watching the red 4H supply zone (around 122,000) closely for a possible short-term sell setup.
🟥 If price reaches this red OB, we’ll look for a light short position only with confirmation on the 5M or 3M timeframe.
🟩 On the downside, we are mainly interested in buy setups from the following key green OB zones:
🔹 OB 1H around 115,000
🔹 OB 4H around 111,000
🔹 OB 4H around 108,000
📌 Possible scenarios:
1️⃣ Price reaches the red OB → short with confirmation
2️⃣ Price pulls back to lower green OB zones → long with confirmation
3️⃣ Market bias remains bullish unless proven otherwise.
❌ No entry without confirmation.

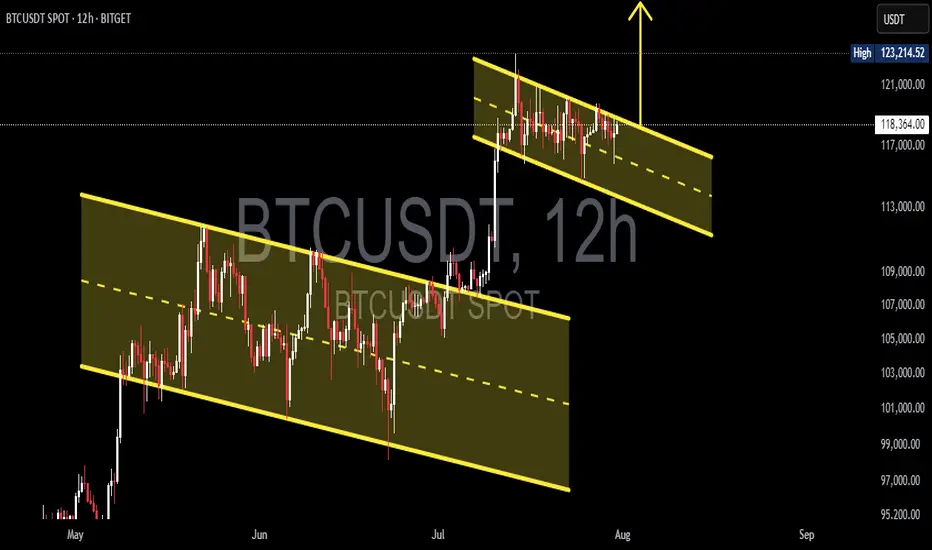
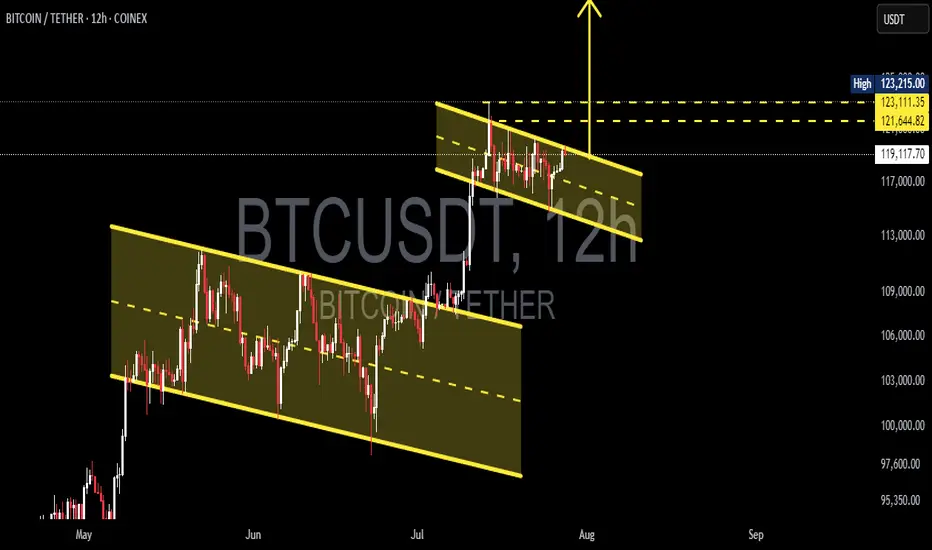
Double Bullish Flag on Bitcoin — Next Rally to $135K?📊 BTCUSDT (12H) In-Depth Analysis: Major Momentum Brewing
Bitcoin (BTC) is currently exhibiting a very promising technical structure — a Double Bullish Flag, a rare yet powerful continuation formation that often precedes strong upside momentum.
This dual-pattern structure reflects market strength and smart accumulation, with bulls maintaining control while allowing for healthy pauses before potential expansion to higher levels.
---
🔍 Technical Breakdown: Double Bullish Flag Structure
🔸 1. Primary Bullish Flag:
Formed after a sharp rally from around $95,000 to $113,000 (flagpole).
Price then consolidated within a clear descending channel, forming a classic Bullish Flag pattern.
Breakout from this pattern occurred in early July, confirming bullish continuation.
🔸 2. Secondary Bullish Flag (Mini Flag):
After the breakout from the main flag, BTC formed a second smaller flag pattern — a narrow descending channel from ~$123K to ~$119K.
This is known as bullish flag stacking — a pattern of "flag on top of flag", signaling trend strength and smart consolidation.
This mini-flag now acts as a launchpad for the next potential breakout.
---
🚀 Bullish Scenario: Preparing for a Breakout
If BTC breaks above the upper resistance of the mini flag (~$123,200), it will signal a fresh bullish continuation.
🎯 Potential Upside Targets:
Conservative target: $126,000 – $128,000
Full measured move target (from flagpole): $132,000 – $135,000
✅ Confirmation criteria:
Strong candle close above $123.2K
Accompanied by rising volume and upward RSI momentum (but not overbought)
---
🧨 Bearish Scenario: Breakdown and Retest
If BTC fails to break above the flag and instead drops below the flag support (~$119,400), we may see a short-term correction.
🔻 Key Support Levels:
$117,000 – minor horizontal support
$113,000 – $115,000 – strong demand zone and previous breakout area
⚠️ As long as price holds above $113K, the broader bullish trend remains intact. A pullback to this zone could offer a prime retest-buying opportunity.
---
📌 Key Price Levels to Watch:
Level Role
$123,200 Mini-flag resistance (breakout trigger)
$121,600 Mid-range resistance
$119,400 Flag support
$117,000 Horizontal retest zone
$113,000 Major support (trend invalidation if lost)
$132K – $135K Projected breakout target
---
💡 Conclusion: BTC in Critical Zone Before Potential Expansion
This Double Bullish Flag formation is one of the most technically constructive setups BTC has shown in weeks. It reflects a strong, patient market — with bulls preparing for another leg higher.
If the breakout from the second flag confirms, Bitcoin could rally toward $135,000, backed by momentum, volume, and clean structure. However, a breakdown would only signal a short-term cooldown unless support at $113K is lost.
🧭 Stay focused on breakout confirmation, volume spikes, and market sentiment. This could be the calm before a bullish storm.
#BTCUSDT #BitcoinBreakout #BullishFlag #TechnicalAnalysis #DoubleBullFlag #BTCMomentum #BitcoinRally #CryptoOutlook #BitcoinTo135K
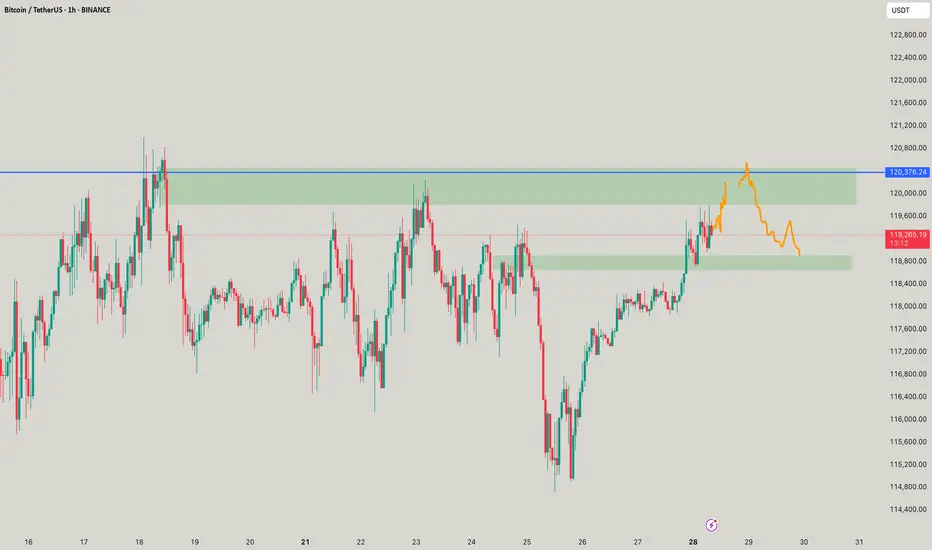
BTC - When 130k?This is BTC, As mentioned, has hit 119,540 and above, will make moves like this till 120,376 to max 120,578 and there if it breaks 120,578 in 1H and close above, then we see good move or we see a fountain which I call as waterfall.
Btc UpdateBTC is moving within a falling wedge and is making its fourth breakout attempt.
A successful breakout and retest of the wedge would confirm a bullish trend, while rejection could signal further movement within the wedge.
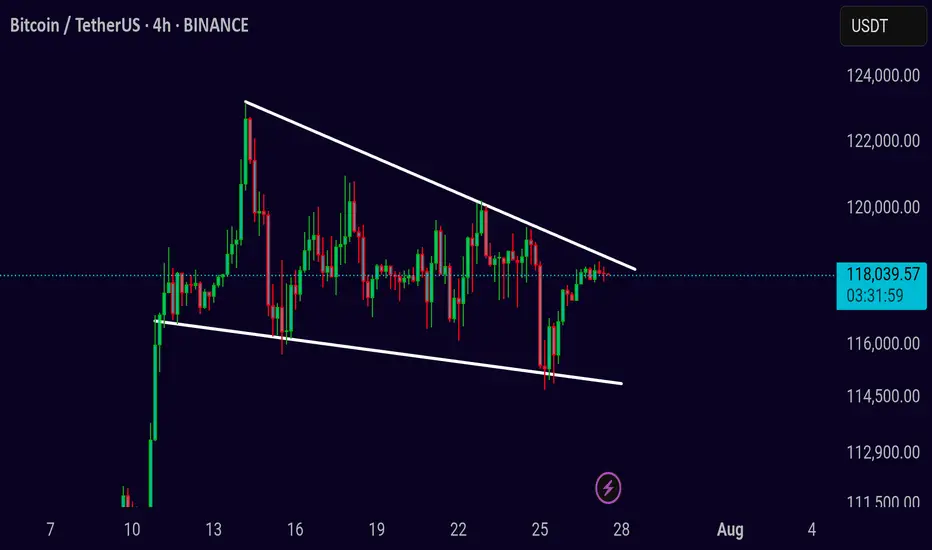
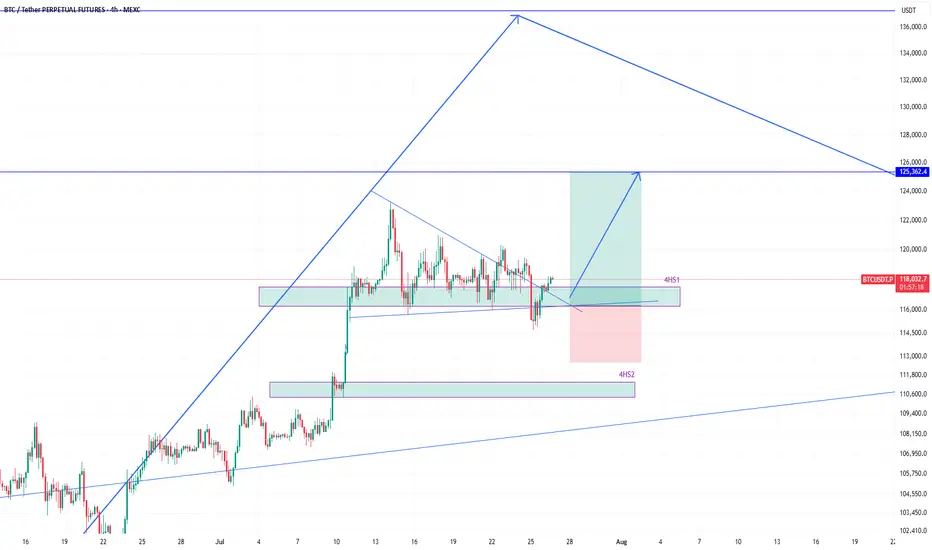
BTCUSDT eyeing 125k next after bounce from 116k zoneEarlier I shared the high time frame view of #BTCUSDT. We know that its heading higher and that helps in holding spot positions.
However, the move to the high frame target will not happen in a straight line, instead with various push to the upside and then subsequent corrections to the down side.
Therefore, as a trader, we must profit from those movements as we see some good high probability setups.
And there is one right now which is a long position.
The price broke 4h support 4HS1, but quickly reclaimed it. That is a sign of demand and strength required to move higher.
Therefore, this presents a long opportunity where the target of this long position should be 125k.
As the price enters into 4HS1 zone, I will scale into long position.
It is quite likely that the price will bounce hard once it taps into 4HS1 zone.
I am talking this long position targeting 125k. What about you? Share with me what you think.
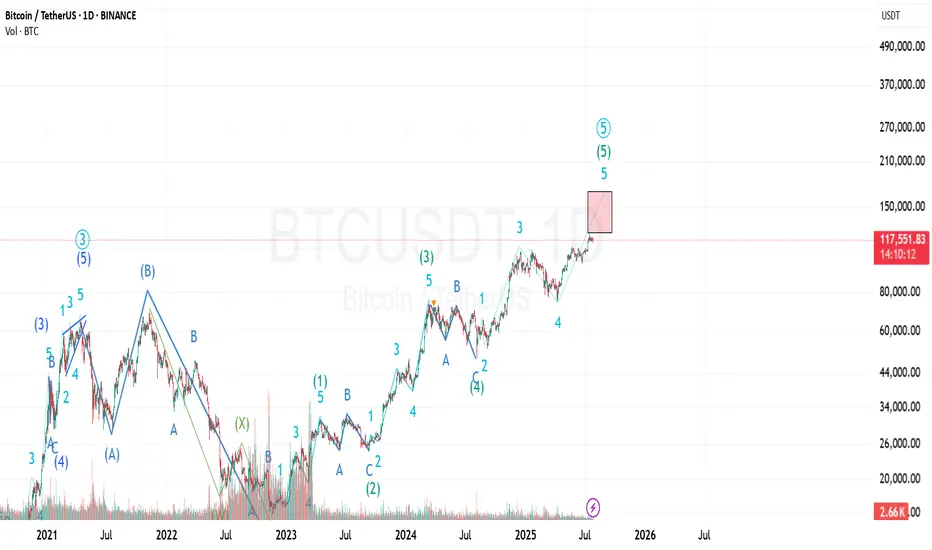
Bitcoin Prediction UpdateI've just modified the wave count and still the previous analysis is valid...
I'm not sure about the target of the last wave (the 5th of 5th wave) because it can be an extended wave...
The shown box is where I'll investigate to find any ending pattern...
BTCUSDT ready to march towards 140k zoneHere is once again a view of what I had shared when BTCUSDT was trading around 95k in may 2025.
The price action has been similar to our expectation. A push towards 106k-110k and then drop around 95k-98k before boucing towards 137k.
So the next stop for the current upward move is 137k. The push from 98k has brought us into 120k zone and currently we were holding in that range from 114k-120k for a while.
However, this is going to change now. I believe the last drop towards 114k was a false breakdown from 4h support 4HS1 since the price quickly grabbed this region again by moving towards 117k.
I believe the path to 137k-144k is clear now and we see that in coming weeks. After that we shall likely see a correction towards 120k area before move to the target around 150k.
Lets see how the price moves. We will keep monitoring it time to time and I will provide updates. But till now it has been moving according to the plan.
#BTC #BTCUSD #BTCUSDT #BITCOIN #CRYPTO CRYPTOCAP:BTC $crypto

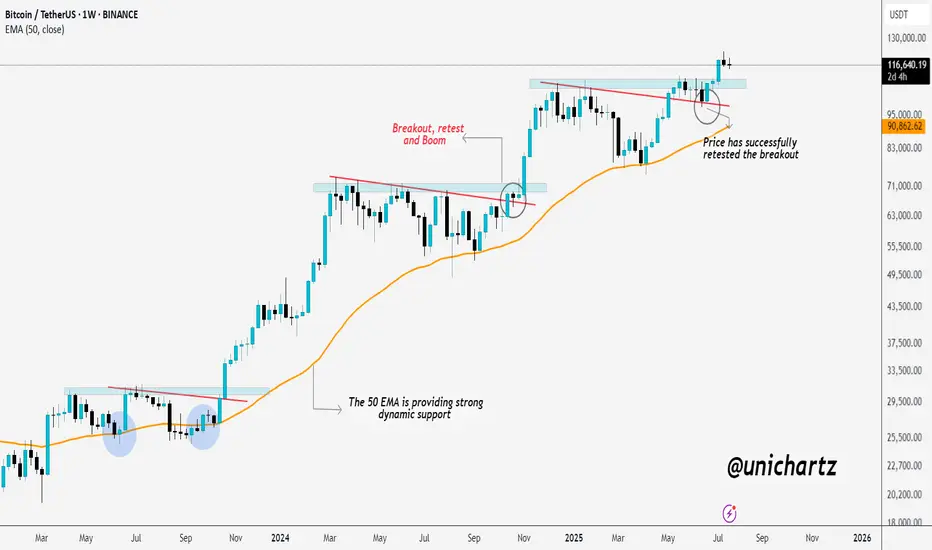
BTC Retested and Ready for the Next Leg Up?This CRYPTOCAP:BTC weekly chart shows a clean pattern of breakout → retest → rally.
The 50 EMA has been acting like a strong dynamic support throughout the uptrend, keeping the structure intact. Every time price broke out of a consolidation or resistance zone, it came back, retested it, and then continued moving higher.
Most recently, BTC broke above a key resistance, pulled back to retest it, and now it looks like the breakout has held. This is a classic bullish continuation setup, and historically, it’s led to strong follow-through moves.
As long as BTC stays above the 50 EMA and holds support, the bullish structure remains intact.
Thanks for reading! Stay sharp and trade safe.
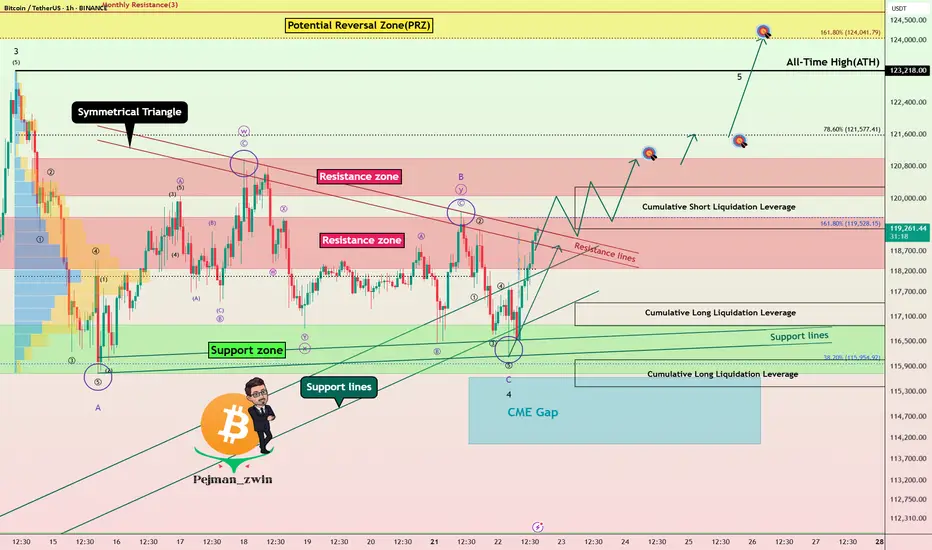
Powell’s Comments Could Decide BTC’s Fate: New ATH or Rejection!Bitcoin ( BINANCE:BTCUSDT ) has attacked the Support zone($116,900-$115,730) several times over the past week but failed to break through, meaning that buyers are still hoping for a BTC increase or even a new All-Time High(ATH) .
Bitcoin has reached a Resistance zone($119,530-$118,270) again and is trying to break the upper lines of the Symmetrical Triangle Pattern . The Cumulative Short Liquidation Leverage($117,255-$116,675) is important and includes high sell orders , so if Bitcoin can break the Resistance zone($119,530-$118,270) and the Resistance lines with high momentum , we can hope for a continuation of the upward trend.
Whether or not the Resistance zone($119,530-$118,270) and the Resistance lines break could depend on the tone of Jerome Powell’s speech today .
Jerome Powell will speak at the opening of the “ Integrated Review of the Capital Framework for Large Banks ” — the final major appearance before the Federal Reserve enters its pre-meeting blackout period.
Market Expectations:
The speech is officially about regulatory frameworks (like Basel III), but traders are watching closely for any hints regarding interest rate policy. Even indirect comments could move risk assets like BTC.
Rate Cut Signals?
With political pressure mounting (including criticism from Trump ) and markets pricing in a potential cut later this year, Powell may adopt a cautious, data-dependent tone emphasizing flexibility in decision-making.
--------------------
In terms of Elliott Wave theory , it seems that the wave structure of the main wave 4 correction is over. The main wave 4 has a Zigzag Correction(ABC/5-3-5) , so that the microwave B of the main wave 4 has a Double Three Correction(WXY) . Of course, the breakdown of the Resistance zone($119,530-$118,270) and Resistance lines can confirm the end of the main wave 4 .
Also, there is a possibility that the 5th wave will be a truncated wave because the momentum of the main wave 3 is high , and Bitcoin may NOT create a new ATH and the main wave 5 will complete below the main wave 3.
I expect Bitcoin to rise to at least the Resistance zone($121,000-$120,070) AFTER breaking the Resistance zone($119,530-$118,270) and Resistance lines .
Second Target: $121,620
Third Target: $123,820
Note: Stop Loss(SL)= $117,450
CME Gap: $115,060-$114,947
Cumulative Long Liquidation Leverage: $117,429-$116,878
Cumulative Long Liquidation Leverage: $116,053-$115,411
Please respect each other's ideas and express them politely if you agree or disagree.
Bitcoin Analyze (BTCUSDT), 1-hour time frame.
Be sure to follow the updated ideas.
Do not forget to put a Stop loss for your positions (For every position you want to open).
Please follow your strategy and updates; this is just my Idea, and I will gladly see your ideas in this post.
Please do not forget the ✅' like '✅ button 🙏😊 & Share it with your friends; thanks, and Trade safe.
BTC Symmetrical Triangle – Decision Time Soon
BTCUSDT Idea (2H Chart)
BTC is consolidating inside a symmetrical triangle, creating pressure for a breakout. Price is currently ranging between 116K–120K, with volatility compressing.
Patience is key here — don’t rush entries.
A confirmed breakout or breakdown will give the real direction.
Break above the triangle = bullish continuation
Break below = further correction ahead
Wait for 2H close outside the pattern with volume
Watch levels:
* Upside: 120K → 124K → 128K
* Downside: 116K → 112K → 108K
Setup is maturing — breakout is just a matter of time. Let the chart lead, not emotions.
