BTCUSDT TRDAING POINT UPDATE > READ THE CHAPTIAN Buddy'S dear friend
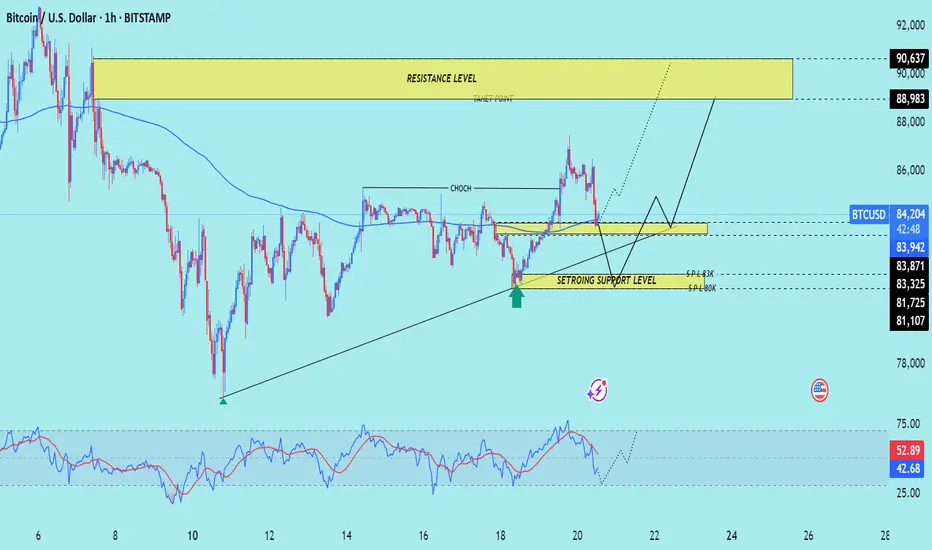
SMC Trading Signals Update 🗾🗺️ crypto Traders SMC-Trading Point update you on New technical analysis setup for crypto BTC USDT list time post signals 💯 reached target 🎯✔️ New technical analysis Setup two said fisrt make close above ground that expect bullish trend 🚀 target point 88k 90k. Next patterns if close below 👇 ⬇️ 83k 80k strong 💪 support level up trand target point 88k 90k fisrt entry risk 🙏. Good luck 💯💯
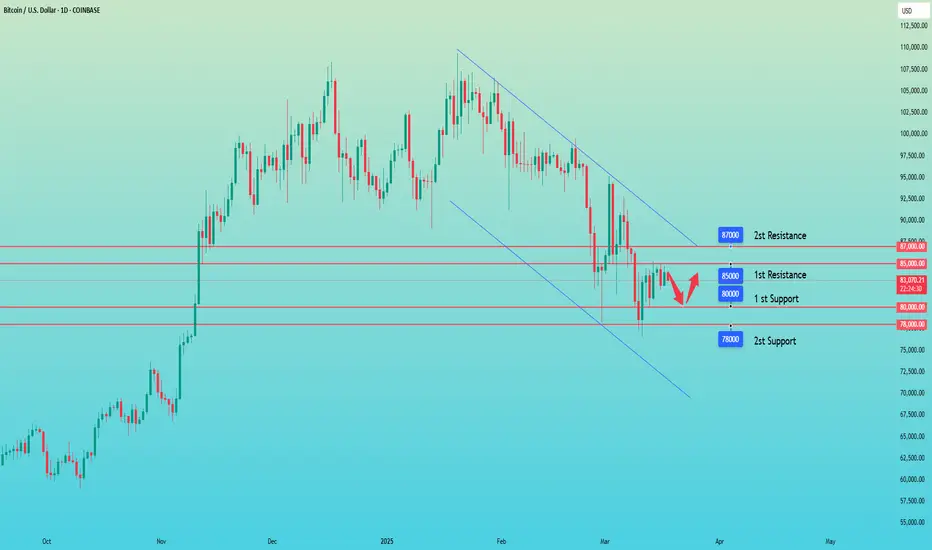
Key Resistance level 87k + 80k + 90k
Key Support level 83k - 80k
Mr SMC Trading point
Pales support boost 🚀 analysis follow)
BTCUSDTPERP
BTC Today's strategyAt present, the support range continues to move upward and the fluctuations have exceeded the previous range. This is a new direction. We only need to make appropriate adjustments and trade within the range, selling high and buying low.
Today's BTC trading strategy:
btcusdt buy@83K-84K
tp:86K-87K
There are risks in trading. If you are not sure about the timing, it is best to leave me a message. This will better confirm the timing of the transaction, It can also better expand profits and reduce losses.
BTC Update 4 Hour/ FOMC Day March 19, 2025, GAME PLAN!🚨 FOMC Day Update – March 19, 2025 🚨
BTC at ~$83,244 (+0.28%–1%) as markets stay cautious. Fear & Greed at 23, RSI at 44.05 = neutral momentum.
While BTC is trading below all significant EMs, 50 100 and 200, It has broken above the 21EMA which is bullish for the short term.
Fed likely to hold rates at 4.25%–4.50% (99% odds) – a surprise cut could ignite a BTC rally. Whale accumulation signals potential upside.
Sentiment data and whale accumulation hint towards a possible upside but only if FED surprises with a rate cut.
The current pump in the market will be short-lived if there's no change in the rates which is very likely.
So be careful with your longs and shorts.
Volatility will kill both bears and bulls.
You need to keep an eye on Powell’s 2:30 PM EST speech.
Inflation & liquidity outlook will shape BTC’s next move. Stay sharp!
I'll keep you updated.
Let me know what you think in the comments and do hit that like button if you like this post.
Thank you
#PEACE

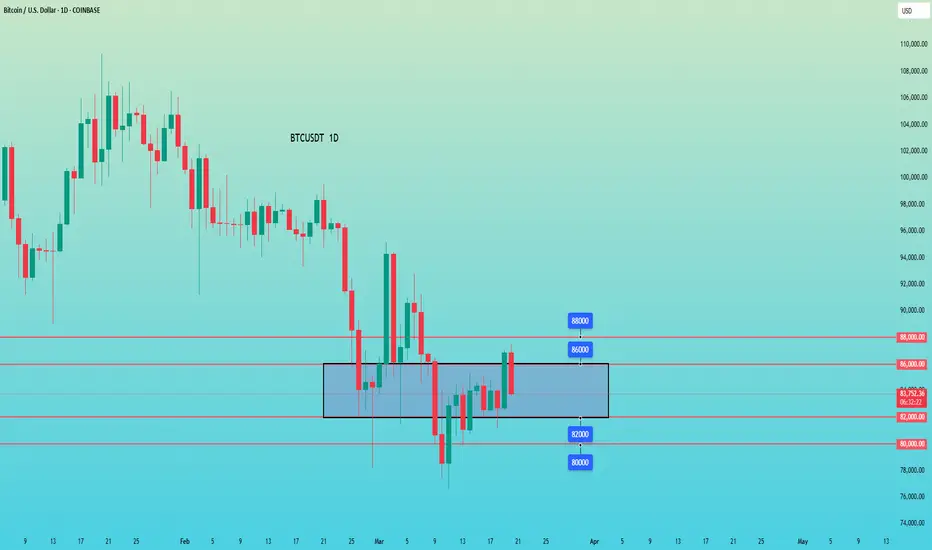
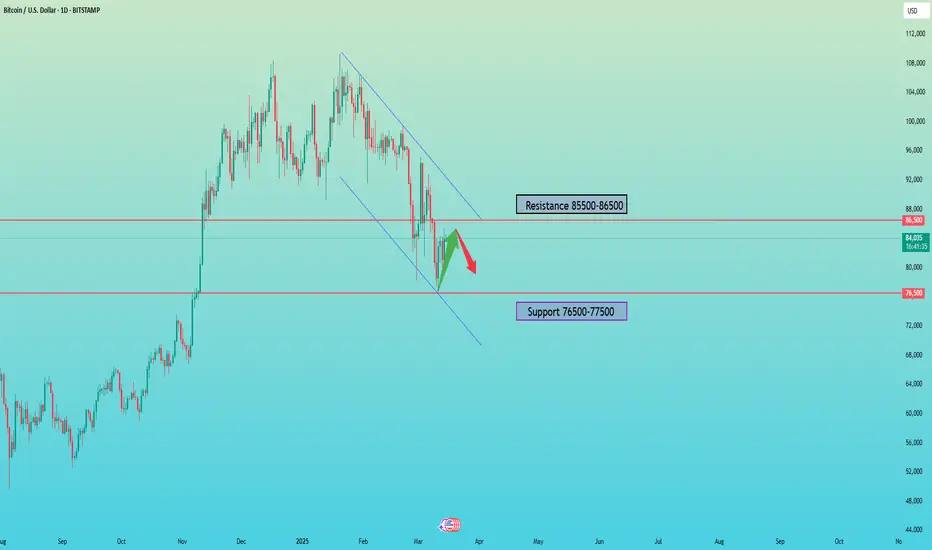
#BTC Support and Resistance Conversion📊#BTC Support and Resistance Conversion📊
🧠From a structural perspective, we have successfully broken through the blue resistance zone, so the blue resistance zone has turned into the yellow support zone. So we can pay attention to the long opportunities when the price falls back to the support zone.
➡️Because the downward trend at the daily level has not ended, the resistance zone we need to pay attention to is around 87808-90000.
Let's see👀
🤜If you like my analysis, please like💖 and share💬
BITGET:BTCUSDT.P

#BTC #BTCUSDT #BITCOIN #LONG #Scalp #Scalping #Eddy#BTC #BTCUSDT #BITCOIN #LONG #Scalp #Scalping #Eddy
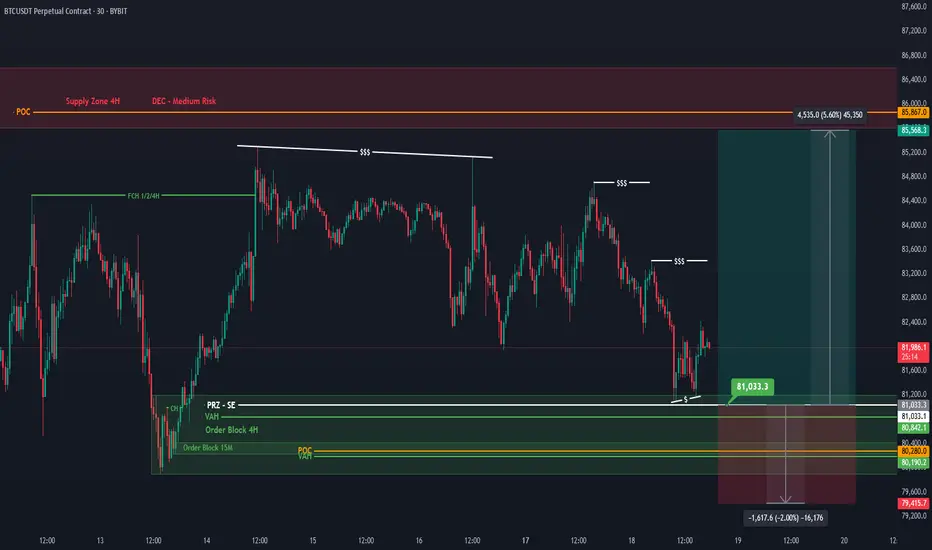
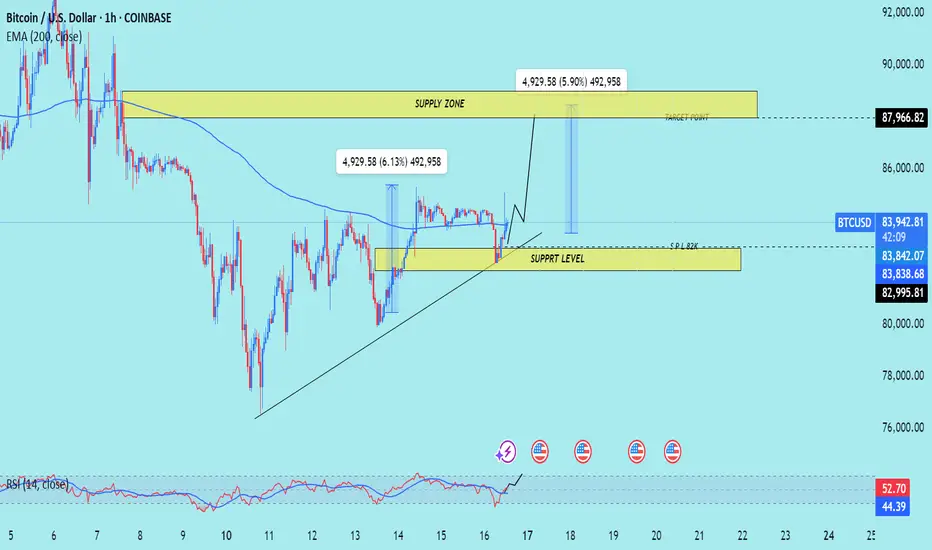
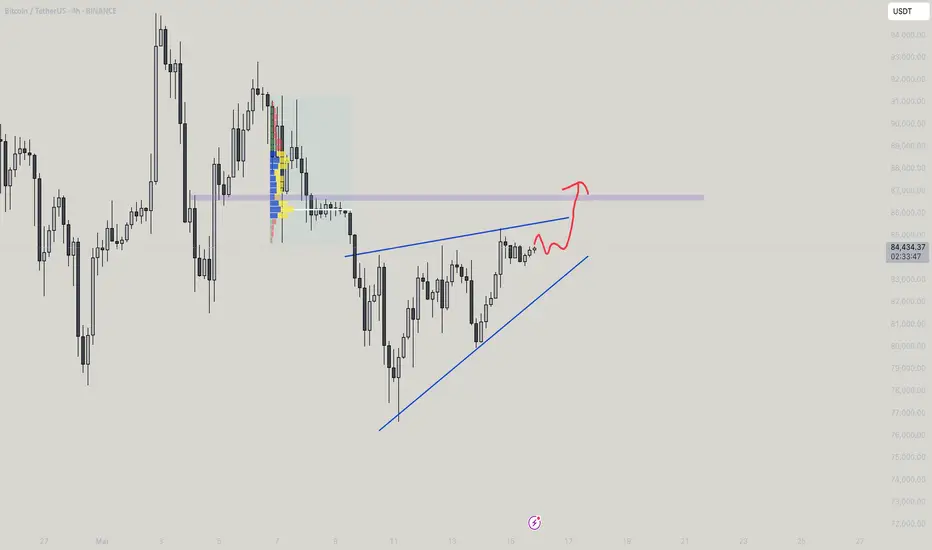
BTCUSDT.P Scalping Long Setup
Important areas of the upper time frame for scalping are identified and named.
This setup is based on a combination of different styles, including the volume style with the ict style.
Based on your strategy and style, get the necessary confirmations for this scalping setup to enter the trade.
Don't forget risk and capital management.
The entry point, take profit point, and stop loss point are indicated on the chart along with their amounts.
The responsibility for the transaction is yours and I have no responsibility for not observing your risk and capital management.
Be successful and profitable.
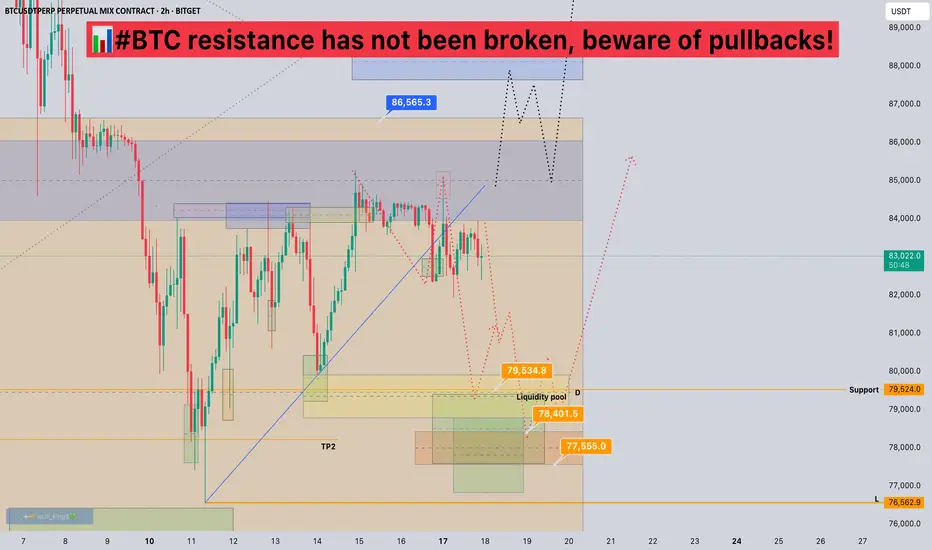
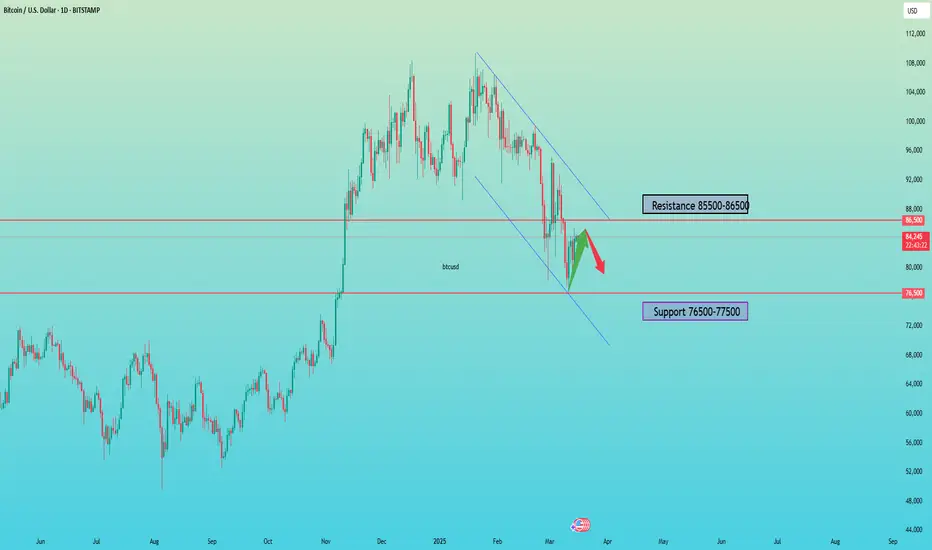
#BTC resistance has not been broken, beware of pullbacks!📊#BTC resistance has not been broken, beware of pullbacks!
🧠From a structural point of view, we have not broken through the blue resistance zone, and a short structure has been built near the resistance zone, so we need to be wary of the risk of pullbacks!
➡️If we want to participate in long transactions, it is best to find support at a low level to participate. The support area worthy of our attention is 77000-80000.
➡️If we successfully break through the blue resistance zone, the blue resistance zone will turn into a support zone, and then we can pay attention to the buying opportunities when the price falls back to this area.
⚠️Note that with the turbulence of the international situation, it will also be directly reflected in the financial market, so we must do a good job of risk management in our transactions during this period.
Let's take a look👀
🤜If you like my analysis, please like💖 and share💬 BITGET:BTCUSDT.P
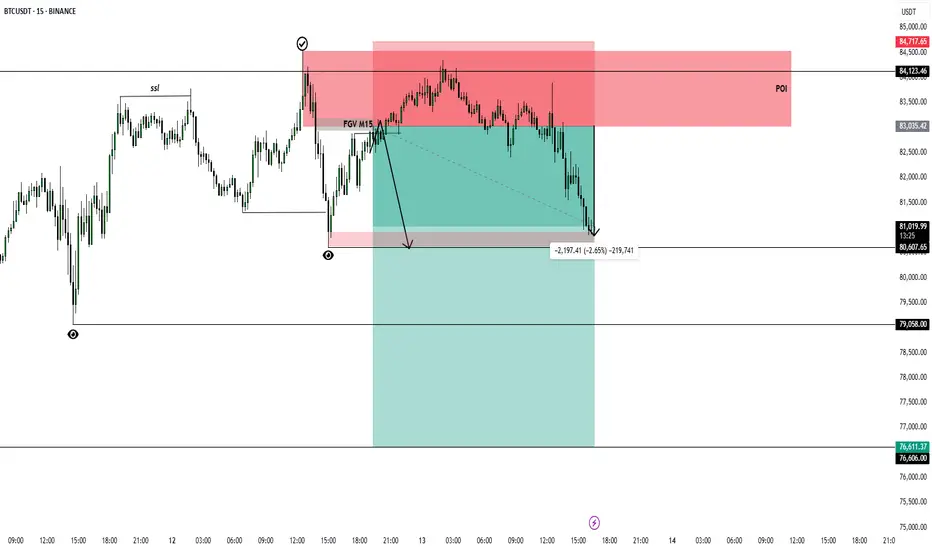
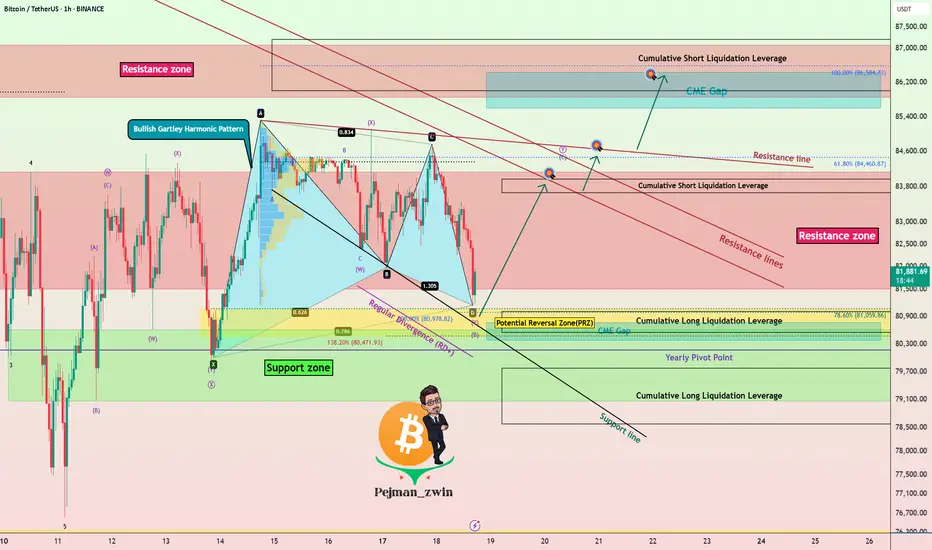
Bitcoin at the D-Point of a Bullish Gartley – What’s Next?Bitcoin ( BINANCE:BTCUSDT ) is currently trading near the Support zone($80,600_$79,000) and Potential Reversal Zone(PRZ) and Support line .
Bitcoin appears to be completing the Bullish Gartley Harmonic Pattern .
Educational Note : The Bullish Gartley is a harmonic pattern that signals a potential reversal in an uptrend after a corrective move. It consists of five points (X-A-B-C-D) and follows specific Fibonacci retracements, with the D-point acting as a key buying zone.
Regarding Elliott wave theory , Bitcoin is completing the microwave B of the main wave Y .
Also, we can see the Regular Divergence(RD+) between Consecutive Valleys .
I expect Bitcoin to rise at least to Cumulative Short Liquidation Leverage . If the Resistance zone($84,130_$81,500) is broken, we can expect further increases in Bitcoin .
Note: If Bitcoin breaks below the Support zone($80,600_$79,000), we can expect further declines.
Please respect each other's ideas and express them politely if you agree or disagree.
Bitcoin Analyze (BTCUSDT), 1-hour time frame.
Be sure to follow the updated ideas.
Do not forget to put a Stop loss for your positions (For every position you want to open).
Please follow your strategy and updates; this is just my Idea, and I will gladly see your ideas in this post.
Please do not forget the ✅' like '✅ button 🙏😊 & Share it with your friends; thanks, and Trade safe.
BTC Today's strategyToday, BTC trading is relatively stable and has been fluctuating in the 80K-85K range. We are still buying near support points and selling near resistance points. Once there is a new breakout range, we can simply adjust it
Today's BTC trading strategy:
btcusdt sell@85K-87K
tp:83K-81K
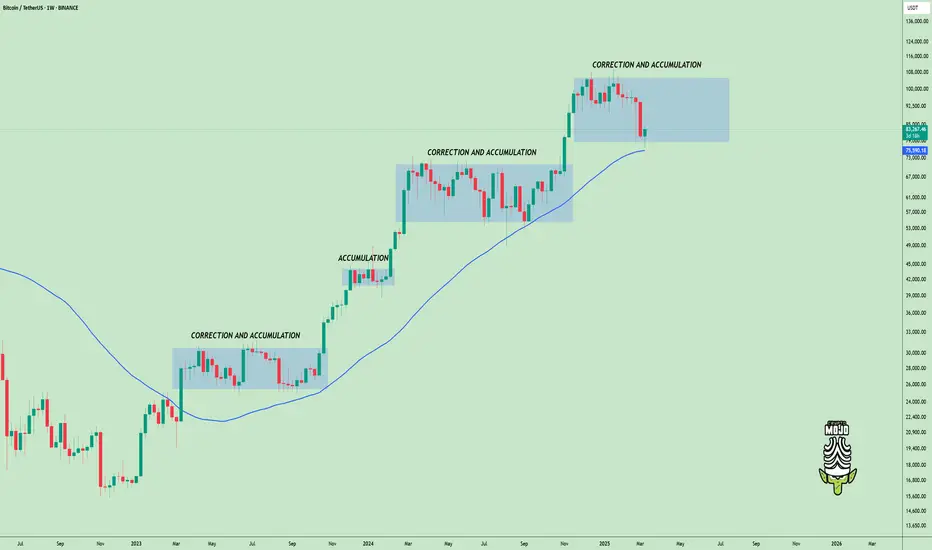
Bitcoin Correction & Accumulation Phase!#Bitcoin is in a correction and accumulation phase, something we’ve seen multiple times in this cycle.
As long as we don’t see any bearish confirmation on the higher time frame, this remains a normal correction within the bull run
We’re near the range's lower bound, which could be a good spot for short-term long setups on lower timeframes.
The next bullish breakout requires a weekly close above $110,000 🚀
History repeats itself—stay patient, accumulate smartly
What’s your strategy during these corrections? Let’s discuss it! 👇
DYOR, NFA
BTCUSD SELL signal. Don't forget about stop-loss.
Write in the comments all your questions and instruments analysis of which you want to see.
Friends, push the like button, write a comment, and share with your mates - that would be the best THANK YOU.
P.S. I personally will open entry if the price will show it according to my strategy.
Always make your analysis before a trade
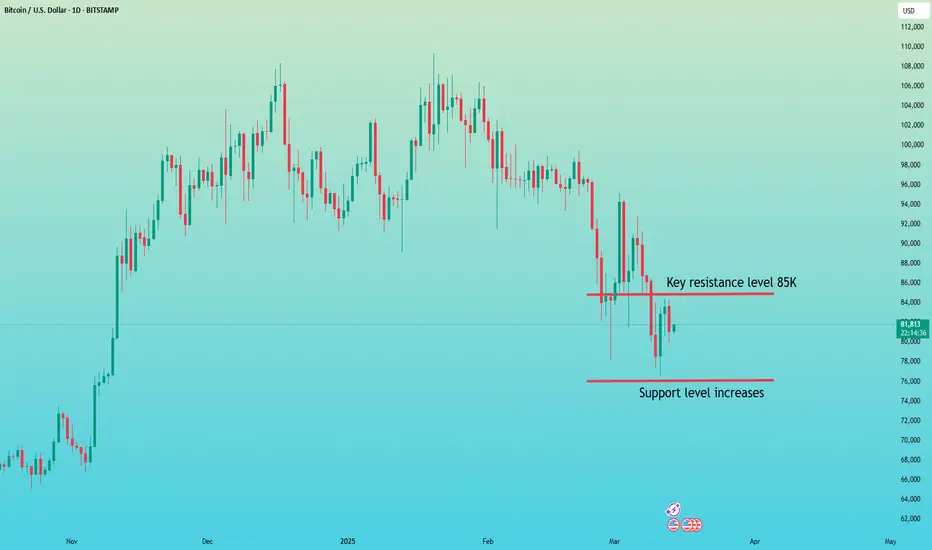
BTC Today's strategyThe support level of Bitcoin has begun to move upward. Currently, the market is still trading in the range of $80,000 to $85,000. The short-selling strategies I continuously provided have also made profits many times.
This week's BTC trading range could be broken at any time. We just need to wait for the market to show a new direction and then adjust our strategy
Today's BTC trading strategy:
btcusdt sell@85K-87K
tp:83K-81K
We will share various trading signals every day. Fans who follow us can get high returns every day. If you want stable profits, you can contact me.
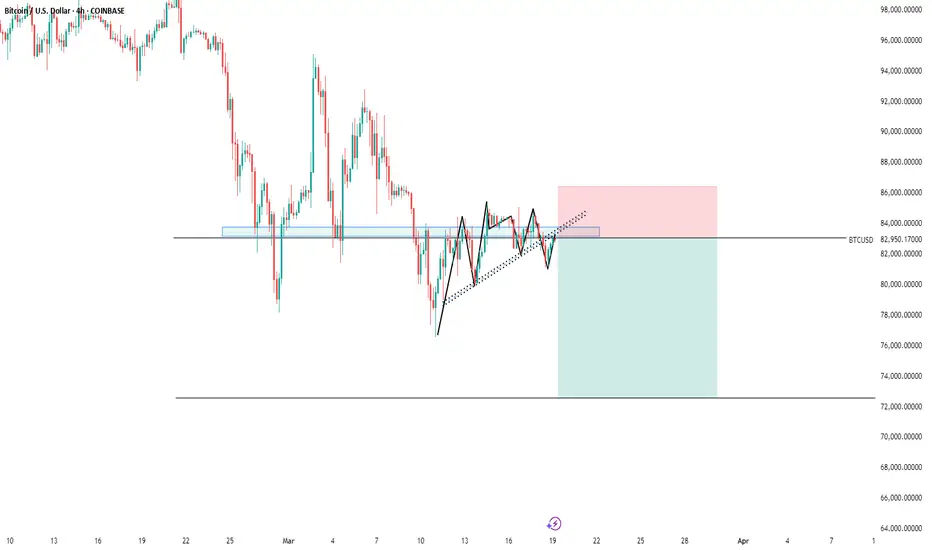
Bitcoin's local perspective 17.03.2025In Friday's analysis "How Trump's Policy Will Impact the Crypto Market", we presented a bearish model for the medium-term perspective👇
Today, our key focus is on the $78,300 level (the 4th point of our model), which serves as significant support.
It's important to note the presence of an unfilled gap on CME at the $85,905 level ($85,943 in index terms)👇
We assess the probability of closing this gap in the near term as high – either from current positions or after retesting the $78,300 level.
How will we act?
If price moves toward $85,943 from current levels, we plan to partially close our #ETH position that was accumulated during the March 11 decline.
In the scenario of a retest of $78,300, we will consider opening a long position on #BTC with a target of $85,943.

BTC Today's strategyThe support level for Bitcoin has started to move upwards. Currently, the market is still trading in the range of 80K to 85K. The consecutive short bets I have offered have also been profitable many times
If you are currently unsatisfied with the bitcoin trading results and are looking for daily accurate trading signals, you can follow my analysis for potential assistance.
Today's BTC trading strategy:
btcusdt sell@85K-87K
tp:83K-81K

BTCUSDT TRADING POINT UPDATE >READ THE CHPTAIANBuddy'S dear friend
SMC Trading Signals Update 🗾🗺️ crypto Traders SMC-Trading Point update you on New technical analysis setup for crypto BTC USDT. ) list time post signals 💯 reached target point ) 👉 New technical analysis setup BTC USDT looking for bullish trend 📈 FVG level support level. 83k 82k support level 87k 88k resistance level ). Guys 🤝 good luck 💯💯
Key Resistance level 87k + 88k
Key Support level 83k - 82kà
Mr SMC Trading point
Pales support boost 🚀 analysis follow)
#BTC breaks resistance, what's next?📊#BTC breaks resistance, what's next?
🧠From a structural perspective, we broke through the resistance near 84500 that was tested many times, so resistance will turn into support, but since we are in the blue resistance zone, we need to be conservative in chasing up here. The next strong resistance is near 86000, and the extreme pressure is near the downward trend line and the blue neckline, which is about 90000-91000.
➡️Since the long structure is established, but it is currently in the blue resistance zone, if we can't continue to attack upward here, then we need to find support at a low point to participate in long transactions, then the support area worthy of our attention is 79545-81500 (unfortunately, it was $359 away from our entry point yesterday). The extreme support area is 69000-73000 (it is difficult to reach here quickly without major negative events).
Let's see 👀
🤜If you like my analysis, please like 💖 and share 💬 BITGET:BTCUSDT.P

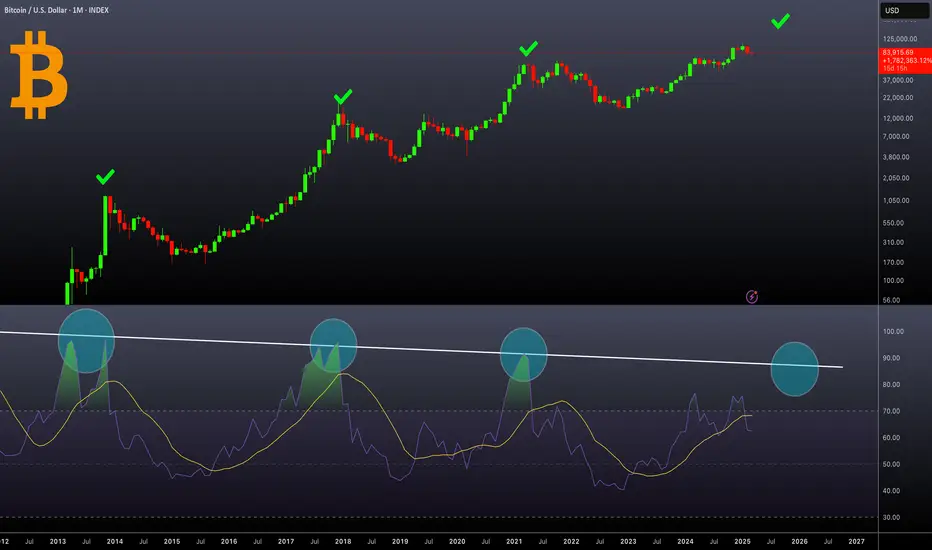
Bitcoin’s Monthly RSI Nearing Danger Zone – Time to Sell?The chart above illustrates Bitcoin’s price action alongside the Relative Strength Index (RSI) on a monthly timeframe, which helps identify overbought and oversold conditions. Historically, Bitcoin’s major bull cycle peaks in 2013, 2017, and 2021 coincided with the monthly RSI reaching between 85-95, as highlighted by the blue circles. A downward trendline connects these peaks, suggesting that each cycle has seen slightly lower RSI highs, indicating a potential long-term momentum decline.
Currently, the RSI is approaching this historical resistance zone, signaling that Bitcoin may be nearing its market peak. If this trend continues, it could mark the final phase of the bull run, making it a strategic period for profit-taking. Traders should closely monitor RSI behavior, as a rejection from this level could indicate the start of a correction.
Historically, a monthly RSI of 85-95 has been a strong sell signal, marking the end of Bitcoin’s bull markets. If Bitcoin follows this pattern again, a distribution phase followed by a downturn could be expected.
Bitcoin's 1065-Day Bull Run Nearing Its End – A Cycle ComparisonThis chart illustrates Bitcoin’s historical price action over three major market cycles, each lasting approximately 1065 days (35 months). The pattern suggests that Bitcoin follows a well-defined four-year cycle, influenced by its halving events. Each cycle begins with a bearish phase (marked in red), followed by a strong uptrend (green), leading to a peak before another correction phase starts.
A key observation is that the duration of each bull run remains consistent, lasting around 35 months (~1065 days) before reaching its peak. Historically, Bitcoin has followed a similar trajectory, with price action mirroring previous cycles. If this pattern holds, the current bull run may reach its peak within the next 6-8 months, placing the market top around late 2025.
Additionally, past cycles show that altcoins tend to experience their strongest moves after Bitcoin peaks, meaning an altseason could emerge by Q3–Q4 2025.

BTC Today's strategyAt present, BTC is still fluctuating in the range of 80K-85K. This week, after reaching around 85K many times, it started to fall, and the consecutive short bets I provided also made profits many times.
If you are currently unsatisfied with the bitcoin trading results and are looking for daily accurate trading signals, you can follow my analysis for potential assistance.
Today's BTC trading strategy:
btcusdt sell@85K-87K
tp:83K-81K
BTC BOOM to 87.1k!SOOO I am back and i was so busy with so many things, DAANG! OKAy so BTC nPoC 86.5k and it always will unleash the heath and break it off to the stiuplated position as mentioned below, Look for the arrows and plan accordingly!
Bitcoin - Comprehensive AnalysisThis is a Bitcoin TA article. In it, I will review the bullish and bearish scenarios. I will also provide price and time cutoff points, which could help us find trade opportunities.
Short-Term Bias is Bullish:
Before reviewing potential scenarios, I want to clarify one point: regardless of whether Bitcoin is long-term bearish or bullish, I expect a short-term upside in the coming days and weeks. The only question is how high it will go and how long it will last. I am optimistic about the short-term because Bitcoin is in the initial stages of the 60-day cycle that began on March 14, and the broader 200-day cycle is also in its early phase. Thus, when both the short and medium-term cycles trend upwards, Bitcoin is bullish, at least for the short-term.
Figure 1: Bitcoin Cycles
The Bearish Scenario:
Let’s begin with the bearish scenario. In this case, Bitcoin has completed primary wave five, and the correction in primary wave A is currently in progress. Primary wave A consists of an ABC structure, with the A wave likely completed. Currently, it appears to be in the initial stages of wave B. If this assumption holds, the likely target for wave B is the 0.618 retracement of A, both in terms of price and time, which sets our price target at 97K and our time target for April 7th or later.
Figure 2: The Bearish Scenario
The Bullish Scenario:
The bullish scenario posits that within primary wave five, Bitcoin completed intermediate wave four on March 14, and that intermediate wave five is about to commence. In this case, the likely target for wave five lies between 111K and 117K, although it could extend even higher. The time ratio for the fifth wave is 0.618 of the duration of wave three, which brings us to April 21.
Figure 3: The Bullish Scenario
Short-Term Minimum Target:
Even if we assume Bitcoin is bearish and that we are about to enter a prolonged correction period, I still expect Bitcoin to retrace 50% of wave A, which also marks the intersection of the upward and downward sloping channels. This retest could occur as early as Monday, March 17th, the soonest decision point.
A cross above the 50% retracement and entry into the upward sloping channel will signal a bullish bias. A rejection from the 50% line and a continuation lower will strengthen the bearish bias.
Figure 4: Minimum Short – Term
Max Target:
The maximum target suggests an extended fifth wave, and in that scenario, Bitcoin could reach as high as $123K, representing the 1.272 extension as early as April 13th. These points of price and time intersect along the 45-degree angle that marked the top of primary waves one and three. Wave five can extend even more, but at this point it is hopeium.
Figure 5: Max Target
Additional Considerations:
Yearly Cycles. In the last four years, Bitcoin reached an intermediate top between mid-March and mid-April. However, on March 14, 2020, it indicated the bottom before a bull run. I am leaning toward the bear case because March 2020 was an exceptional year due to the COVID crisis.
Fed Pivot. The next FOMC meeting is on March 19th. According to CME’s Fed Watch tool, the Fed will unlikely pivot on March 19th. Whether it does or doesn’t pivot on March 19th, the latest inflation data increases the chances of a pivot soon, which could ignite the final fifth wave and the blow-off top.
Figure 6: Yearly Cycles
Bitcoin Dream:
This is a “feel good” scenario. If everything aligns, it could become a reality.
Figure 7: Bitcoin Dream

BTC Today's strategyThe balance of long and short power in the market suggests that there may be explosive movements in the short term. At present, the price of Bitcoin is fluctuating in the range of 82,000-85,000 US dollars, and the short-term resistance is at 86,000 US dollars. A break through 86,000 US dollars could trigger a new round of gains
Bitcoin ETF funds have seen net outflows for five consecutive weeks, with demand falling to the lowest level in 2025, indicating that institutional funds are withdrawing and market sentiment is turning cautious. However, institutions such as MicroStrategy continue to buy, providing some support for bitcoin prices
The market is worried about the risk of possible liquidity tightening before the FOMC meeting in March, the uncertainty of the global economic situation and the signs of monetary policy adjustment in some major economies, making traditional financial marekts more attractive, and there is a trend of capital flowing back from the cryptocurrency market to the traditional financial field, which has some pressure on the bitcoin price
btcusdt sell@85500-86500
tp:83K-81K
We will share various trading signals every day. Fans who follow us can get high returns every day. If you want stable profits, you can contact me.
BTC Today's strategyIndustry News: Japanese listed company Metaplanet increased its holdings of 162 BTC, which to some extent reflects institutional optimism towards Bitcoin, and may have a positive impact on market sentiment, attracting more investors to pay attention and buy. However, Bitcoin's real-world application is still relatively limited, and its fundamentals are still relatively weak, which may limit the price of Bitcoin in the long run.
From the supply side, after bitcoin hit its highest price in history, short-term holders (STH) increased their holdings, while long-term holders (LTH) decreased their holdings. This change in supply pattern reflects the growing speculative atmosphere in the market, and short-term traders are more sensitive to price fluctuations, which may lead to increased volatility in bitcoin prices. From the demand side, despite the continued increase in bitcoin holdings by institutional buyers and ETFs, actual spot demand continues to decline. If demand does not recover, bitcoin's continued rally may be difficult to maintain.
Overall, the price of Bitcoin on March 14, 2025 is currently showing a certain upward trend, but the overall trend is still facing many uncertainties. A variety of factors such as the macroeconomic environment, the Federal Reserve's monetary policy, industry dynamics, and market supply and demand are all having an impact on the trend of Bitcoin.
buy:77K-79K
tp:83K-85k
We will share various trading signals every day. Fans who follow us can get high returns every day. If you want stable profits, you can contact me.
BTCUSDT SHORT (FIXED 1-ST target NOW) I fix the 1st take at $80,913 and move the stop order to breakeven .
1- the position itself is correct, but such manipulations with the news background and constant volume shift do not allow to correctly assess the moment of price reversal
2- Key markings before opening the position also took the format of price manipulation and should not have reached the value of $84,000 again in a normal market
In this regard, I decide to secure the position and take part of the profit in order to calmly continue trading while respecting the risks .
Main overview:
Further targets remain unchanged