🚀Bitcoin will Go Up after Pullback🚀💡 Bitcoin managed to break the 🔴 Resistance zone($65,700-$64,180) 🔴, Resistance line and 50_SMA(Daily) yesterday.
💡 Bitcoin seems to be completing a pullback right now.
🌊Regarding Elliott wave theory , Bitcoin seems to have completed the main wave 3 above the resistance zone and is currently completing wave 4 .
📈In terms of Classic Technical Analysis , Bitcoin managed to break the resistance zone , resistance line, and 50_SMA(Daily) with the help of the Inverse Head and Shoulders Pattern . Bitcoin seems to have increased at least to the 🎯Target🎯 of this pattern.
💡Let's take a look at the Market Cap USDT Dominance% (USDT.D%) chart .
💡 USDT.D% seems to start falling after reaching the 🔴 Resistance zone(4.92%-4.87%) 🔴, which is in line with Bitcoin's analysis. ⚠️The scenario will change if USDT.D% can break the resistance zone⚠️.👇
🔔I expect Bitcoin to rise to the next 🔴 Resistance zone($65,700-$67,520) 🔴 after the completion of wave 4 (pullback) .
❗️⚠️Note⚠️❗️: If Bitcoin falls below the 🔴 Resistance zone($65,700-$64,180) 🔴, the scenario will change.
❗️⚠️Note⚠️❗️: An important point you should always remember is capital management and lack of greed.
Bitcoin Analyze ( BTCUSDT ), 2-hour time frame ⏰.
Do not forget to put Stop loss for your positions (For every position you want to open).
Please follow your strategy; this is just my Idea, and I will gladly see your ideas in this post.
Please do not forget the ✅' like '✅ button 🙏😊 & Share it with your friends; thanks, and Trade safe.
BTCUSDTPERP

Btcusdt Long setupBtcusdt made a cup & handle pattern on price action
handle of the cup or flag is in the making we can trade between
the range.
Buying is recommended at the area of
54650 to 44700 with the stoploss of 36900
For the target area of Tp1 84000 Tp2 115000 & trail.
If you're a leverage trader buy at above the
breakout area of 74000. SL below 66000
Target remains the same

I'll share a short-sighted RBI of Bitcoin#BTC
Hi, Friends!
Good to see you all.
I hope you have a joyful weekend.
Let me explain the short-term perspective of Bitcoin
■ The BLUE resistance line has not been able to break through upward.
■Bearish Divergence as RED appears.
■Red short-term uptrend line is broken down.
■ Expected to fall after retesting.
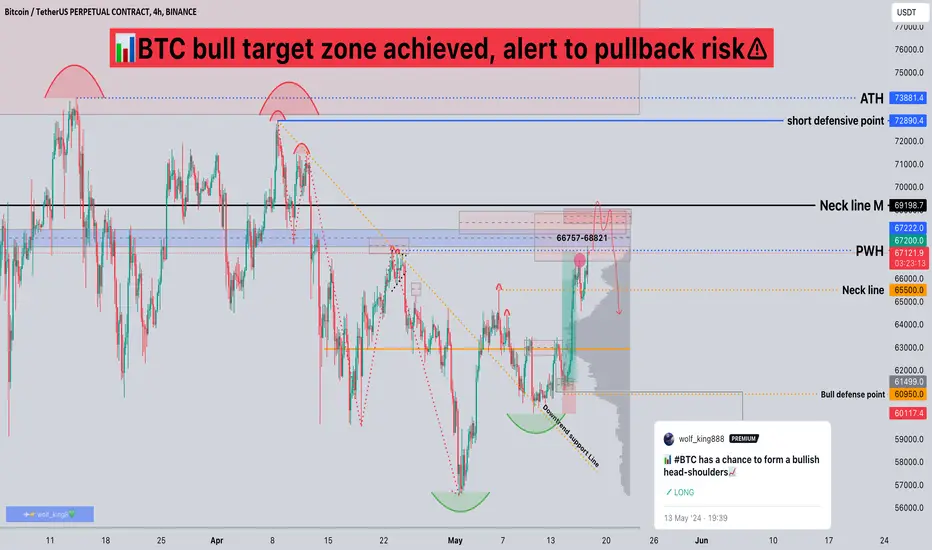
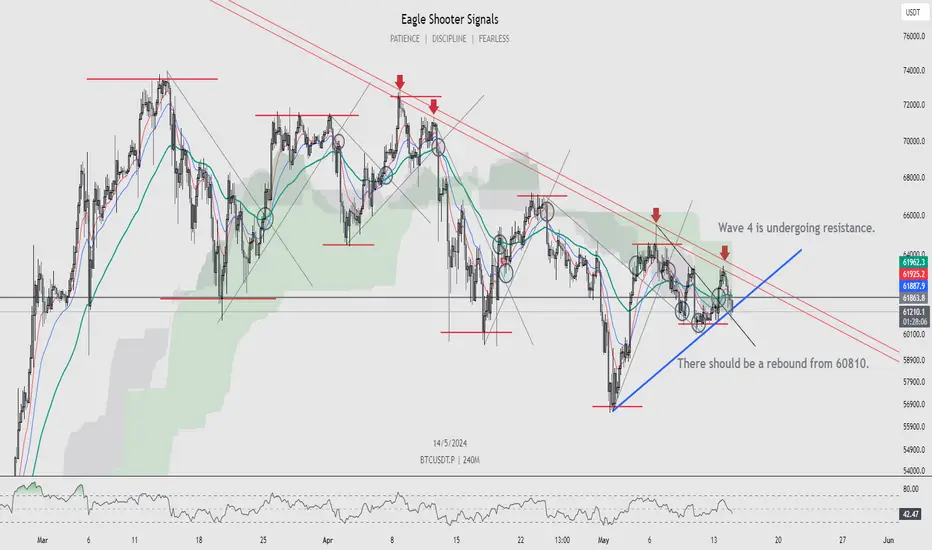
📊BTC bull target zone achieved, alert to pullback risk⚠️🧠Adjustments at the weekly level are underway, so we still need to be alert to the risk of a pullback.
➡️From a structural point of view, the level of the double top bearish structure is significantly larger than the level of the double bottom bullish structure, so we may have difficulty reversing expectations of further corrections in the correction. Moreover, the resistance here is multiple at present, so if an hourly level short structure is constructed in the selling area, we can try to go short.📉
⚠️Note that if the short defensive point is breached, then the short structure will be destroyed and the expectation of further correction will be invalidated.❌
Don’t forget risk management💯
✔️Trade safe✔️
🤜If you like my analysis, please like 💖and share it💬
💕 Follow me so you don't miss out on any signals and analyze 💯
BTCUSDT at daily resistance, likely to pullback to 64khe price has finally hit the daily resistance DR1 and that triggers my short trade idea from there.
I think the price will pullback here towards low timeframe support LTFS1.
Therefore LTFS1 is the target of this short trade. Lets see where it goes from here. Let me know what you think in the comments.

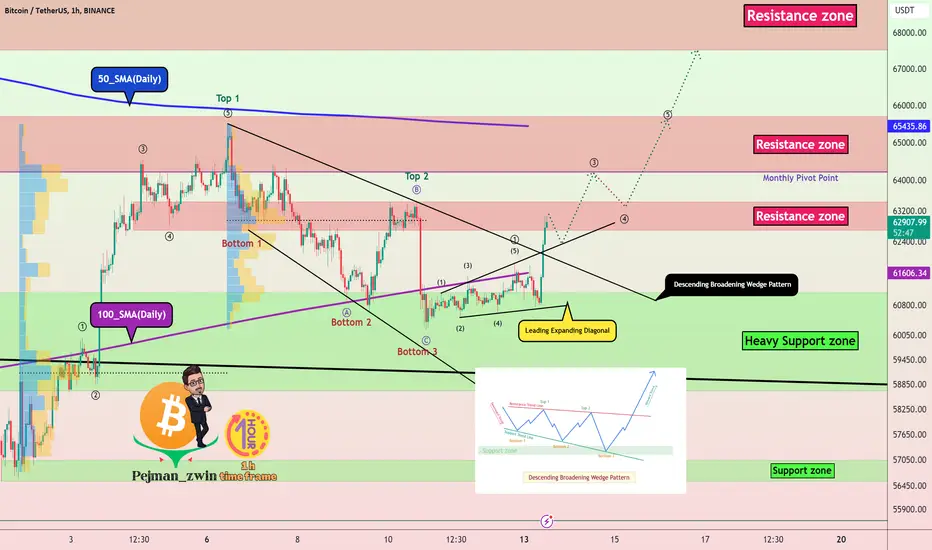
✈️Bitcoin is Ready to Pump✈️🏃♂️ Bitcoin is moving in the 🔴 Resistance zone($63,440-$62,690) 🔴
🌊According to the theory of Elliott waves , Bitcoin seems to be forming a main wave 3 (the next 5 impulsive waves).
📈In terms of Classic Technical Analysis , Bitcoin has succeeded in breaking the upper line of the Descending Broadening Wedge Pattern .
💡Looking at the chart of Market Cap USDT Dominance% (USDT.D%) , we can see that USDT.D% managed to break the Support line and expect a drop to the 🟢 Support zone(4.72%-4.53%) 🟢 as I expected in the " USDT.D% will ⚔️Attack⚔️ to Support zone again " post.👇
🔔I expect Bitcoin to rise to at least the 🔴 Resistance zone($65,700-$64,200) 🔴 and the 50_SMA(Daily) .
❗️⚠️Note⚠️❗️: An important point you should always remember is capital management and lack of greed.
Bitcoin Analyze ( BTCUSDT ), 1-hour time frame ⏰.
Do not forget to put Stop loss for your positions (For every position you want to open).
Please follow your strategy; this is just my Idea, and I will gladly see your ideas in this post.
Please do not forget the ✅' like '✅ button 🙏😊 & Share it with your friends; thanks, and Trade safe.
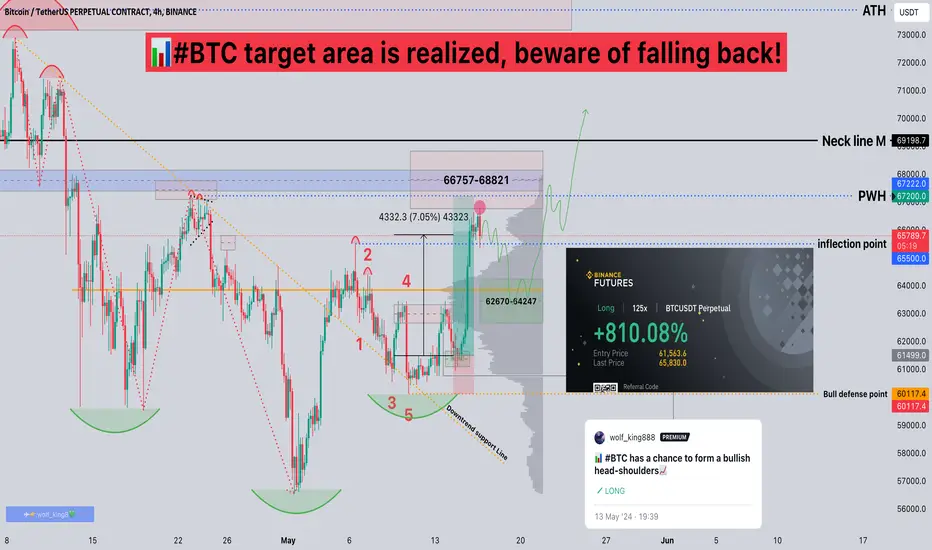
📊#BTC target area is realized, beware of falling back!🔥When the ideal target zone is realized, there is an expectation of a callback, so we choose to close the position after reaching the target zone. Congratulations to the friends who followed Wolf King to print money and obtained a rate of return of 800%+.🎉💰🍻
🧠From a structural point of view, we have broken through the turning point, so the bull structure of a larger cycle has been established, so we still have a bullish view. Therefore, if the price can return to the buy zone marked on the chart and build a 1h level long structure, we can focus on it.
Don’t forget risk management💯
✔️Trade safe✔️
💕 Follow me so you don't miss out on any signals and analyze 💯

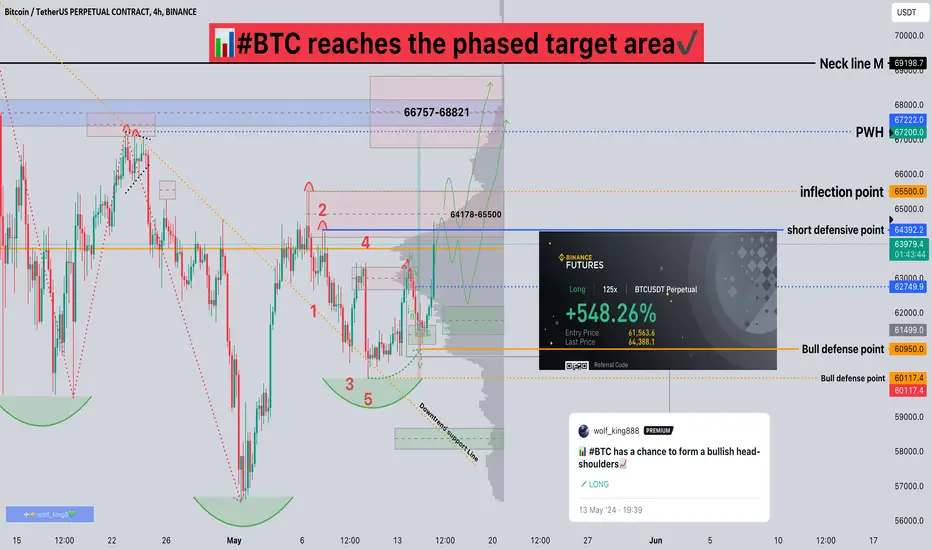
📊#BTC reaches the phased target area✔️🧠From a structural point of view, we have broken the short defensive point, which means that the short structure is destroyed and we will continue the long trend with a high probability.📈
➡️However, there is heavy resistance where it is currently, so please be cautious in chasing the rise. If there is a good callback, it will be regarded as a good new entry opportunity.
⚠️Note that it can also continue to rise here. If we move relatively strongly and break through the resistance area, then the resistance area will transform into a support area, so we chose to lock in the main profit and only retain a small position to look forward to this possibility.
🎉At the same time, congratulations to the friends who followed Wolf King to print money.💰🍻
Don’t forget risk management💯
✔️Trade safe✔️
🤜If you like my analysis, please like 💖and share it💬
💕 Follow me so you don't miss out on any signals and analyze 💯
Bitcoin Fail in the ⚔️Third Attack⚔️ on the Resistance zone⚠️First, I must say that the Consumer Price Index(CPI) rates will be published today ( so be careful about your positions when they are published ).
🏃♂️ Bitcoin is currently moving in the 🔴 Resistance zone($63,440-$62,690) 🔴 (this is the third time it has attacked this zone).
🌊According to Elliott wave theory , Bitcoin seems to be in corrective waves . ( If the 🔴Resistance zone🔴 breaks, the scenario will change again) .
🔔I expect Bitcoin to start going down after the completion of main wave B to complete main wave C and at least fall to the Support line .
❗️⚠️Note⚠️❗️: if Bitcoin can break the 🔴 Resistance zone($63,440-$62,690) 🔴, the scenario will be changed.
❗️⚠️Note⚠️❗️: An important point you should always remember is capital management and lack of greed.
Bitcoin Analyze ( BTCUSDT ), 15-minute time frame ⏰.
Do not forget to put Stop loss for your positions (For every position you want to open).
Please follow your strategy; this is just my Idea, and I will gladly see your ideas in this post.
Please do not forget the ✅' like '✅ button 🙏😊 & Share it with your friends; thanks, and Trade safe.

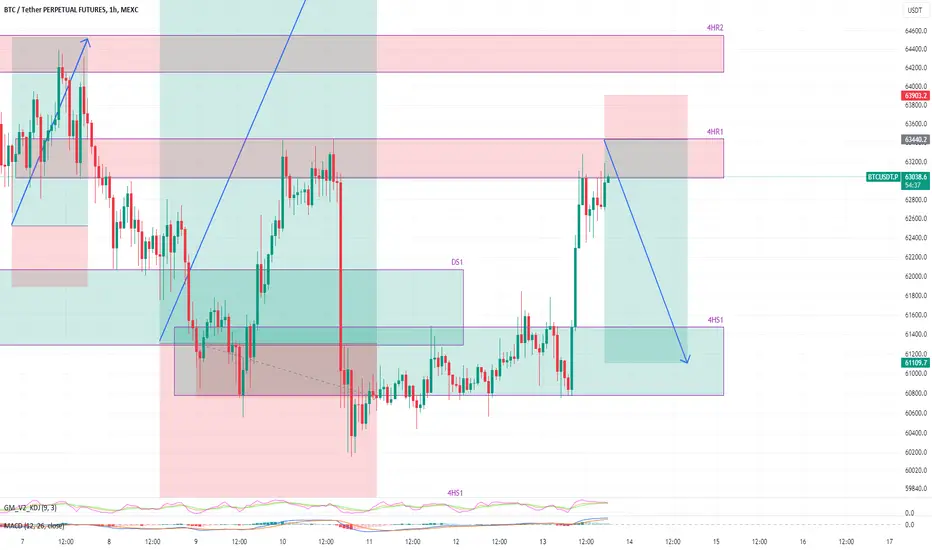
BTCUSDT long from 4h support 62.6k-63.0kThe price finally went deep into the 4h support 4HS1 and presented an ideal opportunity to go long. That is a good support zone and therefore I have taken this long. The price may head way beyond the target. But for now we keep that as a target of this trade and we will revavluate later to continue this trade further towards 4HR1 and 4HR2. Let me know what you think in the comments.

I'm going to break the "Bitcoin"Hello friends, nice to meet you. Here's an amazing Bitcoin chart perspective today
I always support your successful investment.
I hope you do well with safe risk management.
Go for it!
Lowering the highs, the wave is moving in a downward trend.
If you succeed in retesting after breaking the red downward trend line upward, you can think of it as open to 80.4K as a medium wave.
Here we go!!
Now we need to find a moment of rebound. We need to position ourselves in a position where we have good cost-effectiveness and profit-loss ratio so that we have a shorter loss range and a larger loss day.
At the current position, on an hour-long basis, I think the upward divergence is emerging, which is the first condition for a rebound.
The thing to watch out for in the upward divergence shown in the chart above is the push of the candle or the tail end of the candle
In terms of small waves, it showed a form of raising the low point, but if the retest is successful after breaking the blue short-term upward trend line and closing the bell due to the power of the current sell-off, it should be seen that it can reach 57K once again.
Summary:
■60810 The rebound must be achieved after overcoming the price to raise the low point in the sofa statue.
■1 hour-long RSI and upward divergence appeared.
■ If you succeed in retesting after breaking the red downward trend line of the 4-hour rod, it will be open to 80.4K on a medium wave basis.
Bonus Chart
The chart below is my most reliable long-term trend line.
If the adjustment deepens, it could go down to the blue thick upward trend line (56.2K to 56.4K)
Thank you :)
BTCUSDT at 4h resistance and likely to pullback towards 61kHere is a short trade idea setup. I have taken this short trade with very tight stop loss. along with small position size. The price has moved up since we closed our long. It has now reached a key resistance level which was the level from where the price dropped last time. Therefore, this level will present significant resistance here and it will cause the price to pullback here. It has now reached a key resistance level which was the level from where the price dropped last time. Therefore, this level will present significant resistance here and it will cause the price to pullback here.
📊#BTC has a chance to form a bullish head-shoulders📈🔥We currently have a nice rally again near the buy zone and support line, which is very reasonable.
🧠From a structural point of view, if we continue to rise strongly from here and successfully break through the turning point, it means that the bullish head and shoulders structure has been established, and any callbacks in the future are opportunities for us to re-engage in long transactions.
➡️From the perspective of wave theory, if we successfully break through wave 4, it means that this correction may have ended, and we will most likely continue the bullish trend.
Don’t forget risk management💯
✔️Trade safe✔️
🤜If you like my analysis, please like 💖and share it💬
💕 Follow me so you don't miss out on any signals and analyze 💯

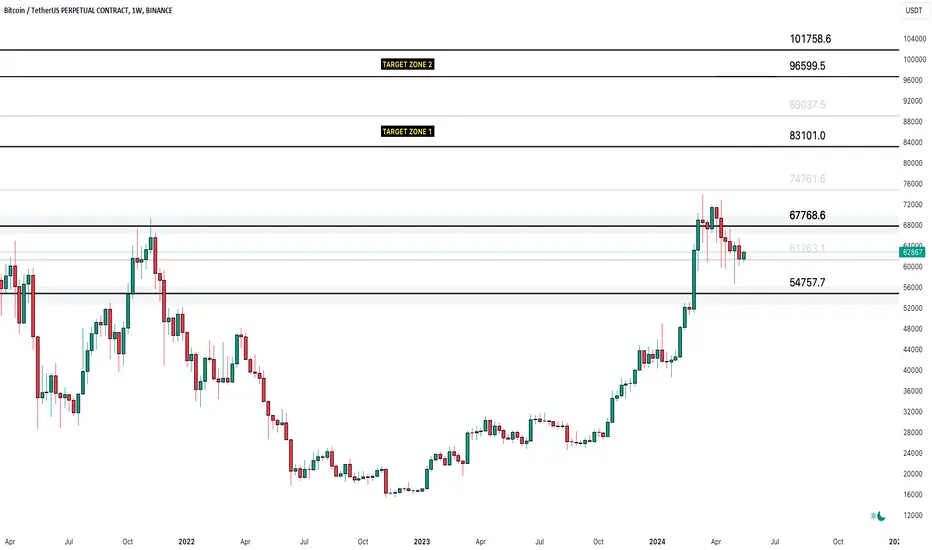
Bitcoin Price Analysis: Explosive Move Ahead!?Weekly Chart:
Yesterday, the weekly candle closed red, but indecisive, right on top of the support at $61,263, which is also the mid of the weekly range zone.
The wide weekly range zone between $54,758 and $67,769, highlighted to CRYPTOLEAN community a few months ago, is characterised by a slow and choppy price action and I have consistency said that a dip to below $67,769 will lead to a boring range-bound move.
This week should lead the bias from its current price location and Bitcoin can move in either direction from here.
Based on the technical closure of the last week candle that made a higher high and has to confirm higher low, Bitcoin is able push back toward the key resistance at $67,769, where the price action will be very important.
Daily Chart:
Bitcoin is trying to reclaim the key daily zone around $61,671.
A bullish candle closure above $61,671 or, even better, above the top of the zone around $61,671 (grey box) will confirm the lower low and push price towards $66,741, the key daily zone.
A price recovery to above $66,741 will push price of BTC towards $69,466 and higher to $72,715.
Below $61,671 zone, Bitcoin is bearish and sustained price action below this level results in a downward move towards $55,697.
Intraday Chart:
The intraday chart is moving agressively bullish and has already tested the key resistance zone around $63,349.
A bullish break-out of $63,349 or a re-test of $62,358 followed by a bullish rejection will lead to price moving towards $65,684.
A bearish break-out below $61,368 results in a dip towards $60,302 and lower to $59,031 zone, where the price action will be very important.
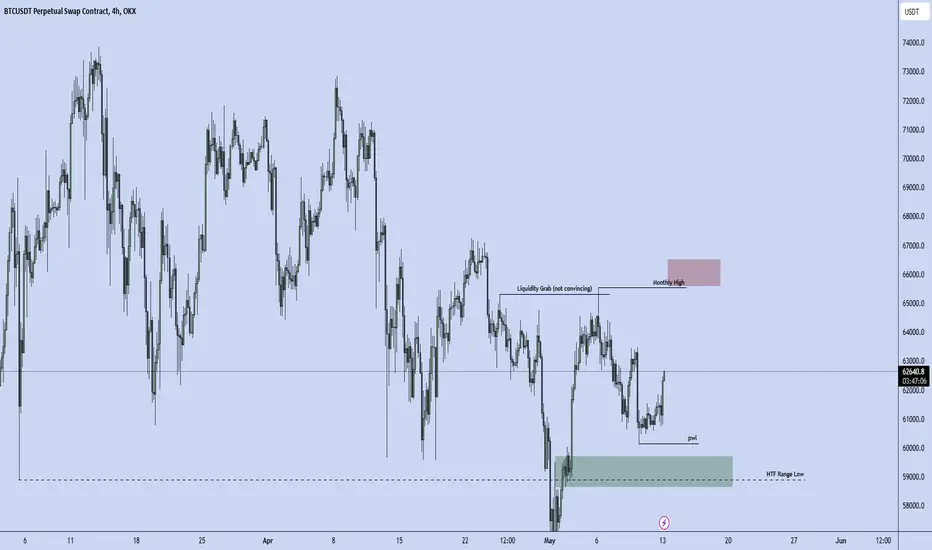
BTCUSDT.P Game Plan For The Week! I did not find the liquidity grab convincing, I will try to look short with a 15m down break from the month's high. In case of PWL manipulation, Long can be searched with 15-minute breaks.