#BITCOIN: Another drop and then Swing Bounce $125,000The current market sentiment is bearish, indicating a potential further decline towards the 65k price point. However, we anticipate a rebound towards the 125k region. As we approach the 65k threshold, we expect a substantial price increase.
To make informed investment decisions, it is crucial to observe a strong bullish trend before considering any bullish entries.
For more insights and market analysis, please like and comment.🚀❤️
Team Setupsfx_
BTCUSDTPERP
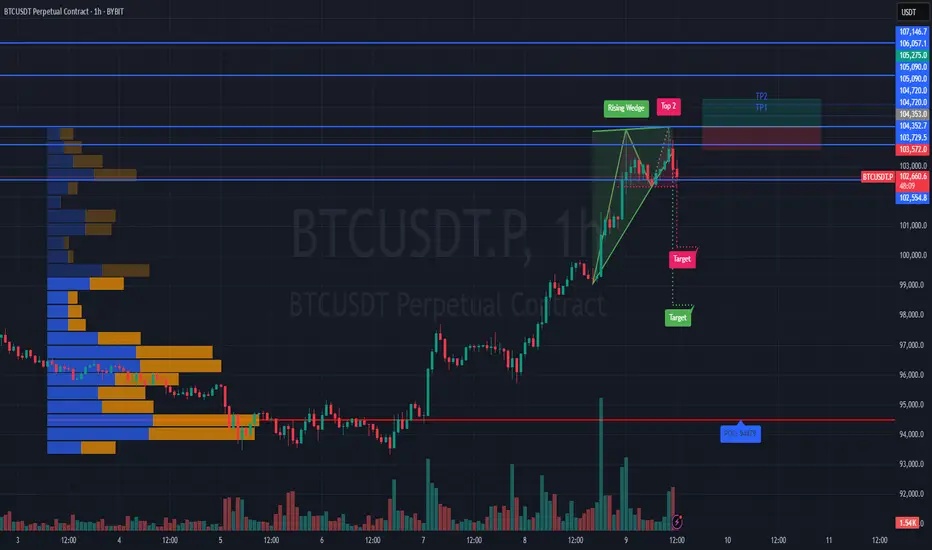
Scenario #BTCUSDT long📉 LONG BYBIT:BTCUSDT.P from $104,353.0
🛡 Stop loss: $103,572.0
🕒 Timeframe: 1H
✅ Market overview:
➡️ The price confidently broke above $103,729 and held, confirming the uptrend.
➡️ The next target zone is $104,720–$105,090 — nearest movement objectives.
➡️ Volume increased during the impulse, indicating strong buyer presence.
➡️ A local support level formed around $103,729 — on a pullback, this zone may hold the price.
➡️ POC at $94,479 remains far below — the market has left the balance zone and is trading in an impulsive phase.
🎯 TP Targets BYBIT:BTCUSDT.P :
💎 TP1: $104,720.0
💎 TP2: $105,090.0
💎 TP3: $105,275.0
⚠️ Important: current structure BYBIT:BTCUSDT.P suggests possible correction (wedge breakdown), requiring caution or exit on key level loss.
⚠️ Despite the initial long from $104,353, a breakdown below $103,572 (stop loss) invalidates the long setup.
📢 If H1 closes below $103,572 — better to exit, scenario invalid.
🚀 Scenario BYBIT:BTCUSDT.P valid while holding above $103,729 — below that, correction likely toward lower targets!
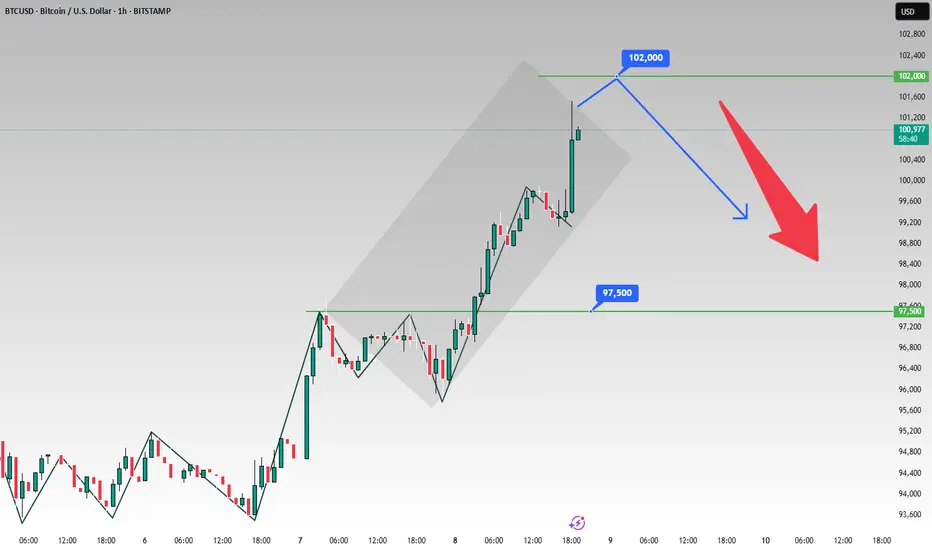
Gold's Slide Powers BTC Past 100K: Time to Short at Highs🚀 BTC Explodes Past the 100,000 Milestone!
Today, BTC shattered the highly anticipated 100,000 mark, sending shockwaves through the crypto market. But this remarkable rally came at a steep cost—💥 many traders faced liquidations, wiping out their accounts as the price volatility reached a fever pitch.
💎 The Gold - Crypto Connection
Interestingly, as gold continues its noticeable downward slide 📉, virtual currencies are stepping in as an alternative haven. The influx of capital seeking new opportunities has fueled the upward trajectory of cryptos, firmly establishing their bullish momentum.
📈 What’s Next?
With the 100,000 resistance now decisively breached, BTC is poised to climb even higher, riding the wave of its recent triumph 🌊. But savvy traders are eyeing a strategic play: once the price hits a peak, it could be prime time to short at the highs ⏳—a move that balances the allure of profit with the inherent risks of a volatile market.
⚡⚡⚡ BTCUSD ⚡⚡⚡
🚀 Sell@101000
🚀 TP 98000 - 97000
Accurate signals are updated every day 📈 If you encounter any problems during trading, these signals can serve as your reliable guide 🧭 Feel free to refer to them! I sincerely hope they'll be of great help to you 🌟
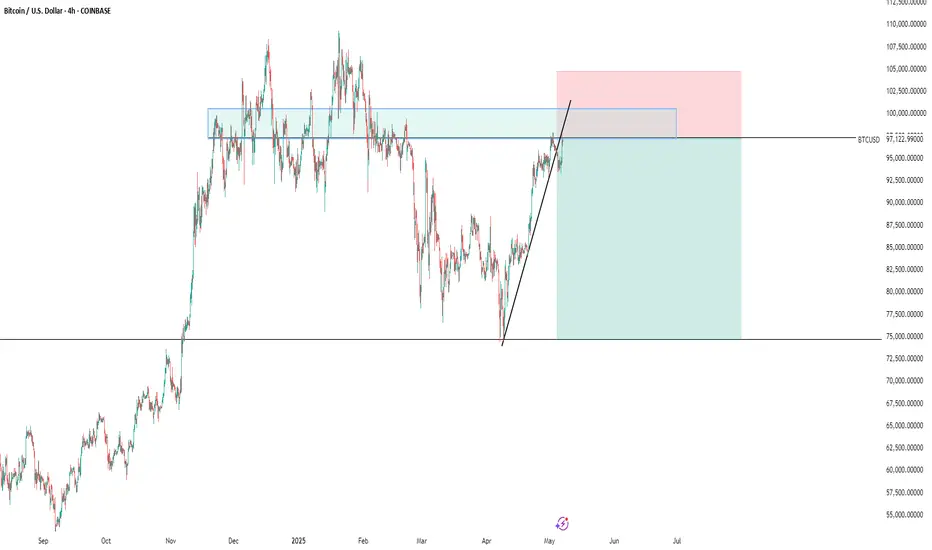
#BTC how will it develop next?📊#BTC how will it develop next❓
🧠From a structural point of view, we are currently moving near the weekly resistance zone. We can only judge that we have successfully broken through the resistance zone when the closing price of the weekly candlestick chart is higher than the blue resistance zone, so we still need to remain vigilant before this condition is met.
➡️If we continue to break through the previous high, it means that the bullish power is still continuing, but the breakthrough is near the gray resistance zone, so wait patiently for the opportunity of a pullback before considering participating in long trades.
➡️I am not considering participating in short trades at present, because short trades are still counter-trend trades. I will only look for short trade opportunities after breaking the inflection point 93340 to establish a short structure or the price rises to the red target zone.
⚠️The Federal Reserve interest rate decision will be announced today, and we will wait patiently for the signal of market structure to appear.
Let's see👀
🤜If you like my analysis, please like💖 and share💬
BITGET:BTCUSDT.P

btcusd sell signal. Don't forget about stop-loss.
Write in the comments all your questions and instruments analysis of which you want to see.
Friends, push the like button, write a comment, and share with your mates - that would be the best THANK YOU.
P.S. I personally will open entry if the price will show it according to my strategy.
Always make your analysis before a trade
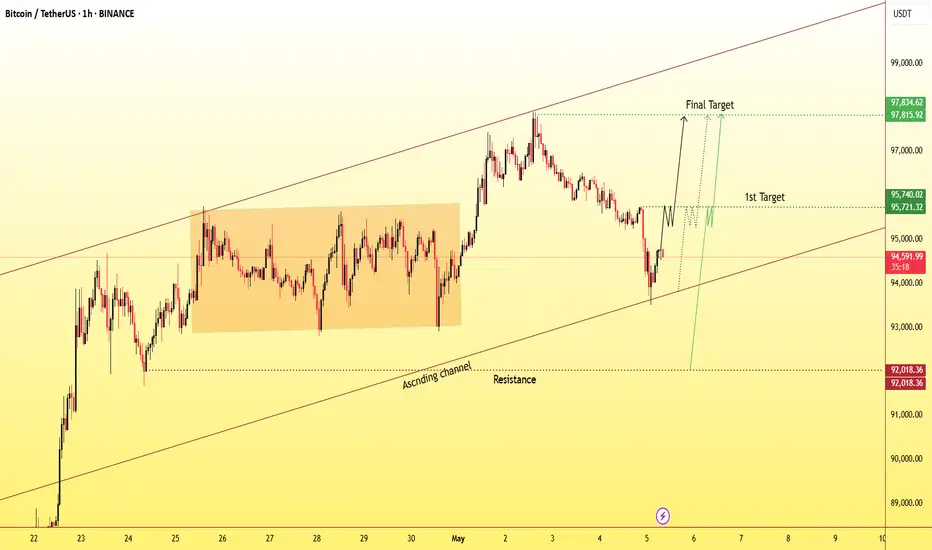
BTCUSD BULLISH SUSTAINANCE.BTCUSD Trading Signal
Market Sentiment: The market is currently experiencing a price surge following a strong rally throughout April. Bitcoin has shown positive momentum and remains in a clear ascending market structure.
Key Levels:
Resistance: $92,000 (broken)
First Target: $95,750
Final Target: $97,800
Technical Overview:
Bitcoin continues its upward movement, supported by strong volume and higher highs. Moving averages point to a strengthening market, with momentum indicators confirming an ongoing bull run. Traders may consider entering on pullbacks or confirmed breakouts above $95,750.
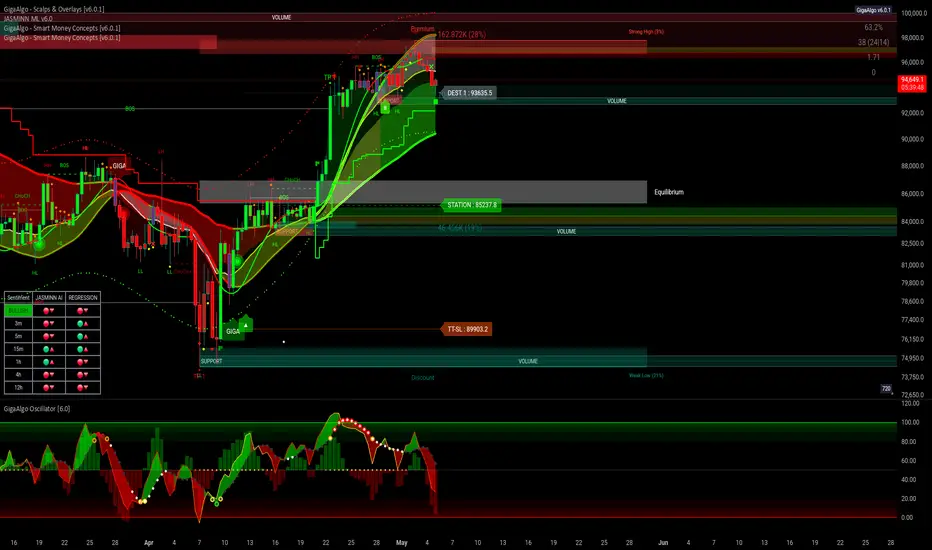
BTC/USDT Update – GigaAlgo SMC | May 6, 2025
Price action continues to respect the previous analysis — BTC remains in the premium zone, now showing clear rejection with back-to-back bearish candles. Although overall sentiment remains labeled as BULLISH, the multi-timeframe JASMINN AI and Regression tools reflect short-term downside momentum, especially below the 94K zone.
Key updates:
94K has turned into immediate resistance — failure to reclaim could signal a deeper pullback.
Support at 93K remains critical. If that fails, BTC may retrace to the equilibrium zone around 85K, consistent with earlier charts.
Watch for volume shifts — bearish volume is now increasing (25%), reflecting stronger sell-side interest.
Structure Breakdown:
BOS (Break of Structure) has been followed by a lower high, hinting at a potential shift if a lower low forms next.
Still within the overall bullish market structure, but correction looks imminent unless bulls step in above 94.5K.

BTCUSD short-term view.It is a good opportunity to sell BTCUSD in real time. Short-term is based on the right side of the swing trading, with a target of 93000-92500. In addition, the uncertainty of the news on BTCUSD. It is a good time to sell now.

BITCOIN BULLISH BTC/USDT Analysis – GigaAlgo SMC | May 5, 2025
Price has recently tapped into a premium OB zone with strong volume rejection. Although JASMINN ML flags bearish sentiment, the structure still supports bullish momentum up to 96K unless the 93K support fails. If that breakdown occurs, the next significant support lies around 83K, aligning with previous volume zones and the STATION marker.
The GigaAlgo Oscillator shows a deep red bar print, hinting at increasing bearish pressure short-term, while multi-timeframe sentiment shows a mix of red and green — signaling indecision and potential range-bound action.
Trading suggestions for BTCTwo days ago, I accurately predicted that the price of BTC would break through 97,500! 🚀
Currently, BTC is finding it difficult to break through the resistance level of 98,000 ⚠️. Given the current situation, it is recommended to decisively adopt a short-selling strategy at a high price level 📉.
⚡⚡⚡ BTCUSD ⚡⚡⚡
🚀 Sell@97500
🚀 TP 96000 - 95000 - 94000
Accurate signals are updated every day 📈 If you encounter any problems during trading, these signals can serve as your reliable guide 🧭 Feel free to refer to them! I sincerely hope they'll be of great help to you 🌟

Sell@97500, TP 96000 - 95000 - 94000🎉 Yesterday, I accurately predicted that the price of BTC would break through 97,000! 🚀 Now, a pullback is on the horizon ⬇️. Keep an eye on the support level at 93,000! 👀
⚡⚡⚡ BTCUSD ⚡⚡⚡
🚀 Sell@97500
🚀 TP 96000 - 95000 - 94000
Accurate signals are updated every day 📈 If you encounter any problems during trading, these signals can serve as your reliable guide 🧭 Feel free to refer to them! I sincerely hope they'll be of great help to you 🌟
BTC/USD) Trend channel analysis setup Read The ChaptianSMC Trading point update
technical analysis of Bitcoin (BTC/USD) on the 1-hour timeframe. It showcases a potential breakout continuation vs. pullback scenario, depending on how price reacts around a key short-term resistance area.
---
Key Observations:
1. Current Price:
$93,754 — Price is consolidating just below a local high.
2. Support and Resistance Zones:
Support BOS (Break of Structure): Around the $87,351 level, highlighted in yellow.
Upper Target Zone: $98,954–$98,983
200 EMA: Near $86,926, offering dynamic support.
3. Two Possible Scenarios:
A. Bullish Continuation:
If the price holds above the immediate structure and breaks out of the short-term consolidation near the top:
It may surge toward the upper target zone ($98,983).
This aligns with the ascending channel and continuation pattern.
B. Bearish Pullback:
If the price fails to sustain above the resistance area:
A correction down to the support BOS zone (~$87,351) is likely.
This pullback may be temporary, potentially offering a re-entry zone for bulls.
4. RSI Analysis (Bottom of Chart):
RSI is showing signs of bearish divergence (price making higher highs while RSI makes lower highs).
This suggests momentum is weakening, and a short-term pullback could occur.
---
Trade Ideas:
Long Setup (Breakout):
Entry: Above recent high (~$94,500).
Target: ~$98,950
Stop Loss: Below ~$92,000
Short Setup (Rejection):
Entry: Rejection near ~$94,000–$94,500
Target: ~$87,350
Stop Loss: Above ~$94,800
Mr SMC Trading point
---
Summary:
This analysis reflects a critical decision point for BTC/USD. Price is nearing a local high with RSI divergence suggesting a pullback may come first — but if buyers remain strong and break resistance, a continuation toward GETTEX:98K is likely. Wait for confirmation of direction before entering.
Pales support boost 🚀 analysis follow)

BTC can move slingshot? - When 87k?BTC as mentioned, have a slingshot move as mentioned above and shall come to the SVP 95,010, where can move up again

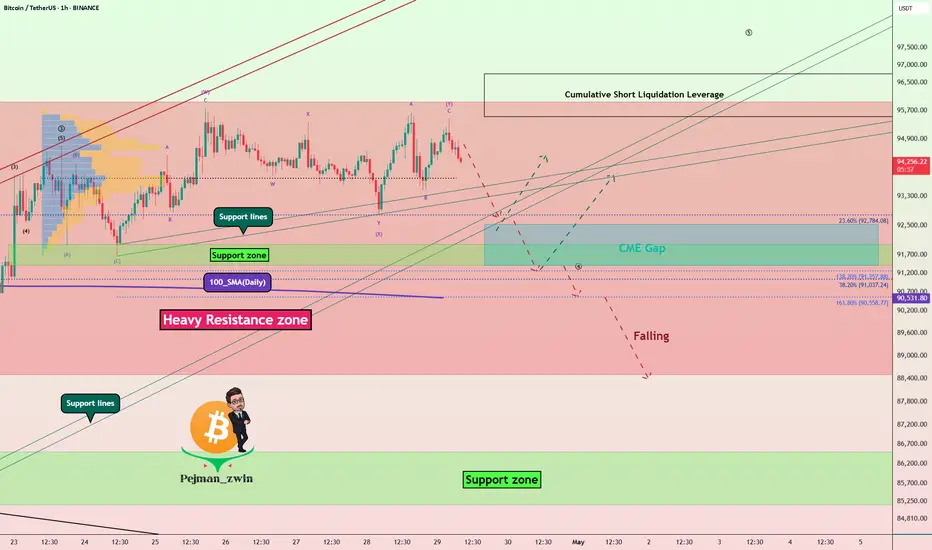
Bitcoin Range-Bound in Heavy Resistance – CME Gap Still Open!Bitcoin ( BINANCE:BTCUSDT ), like Gold , has been moving in a Range for the past 5-6 days and is currently in a Heavy Resistance zone($95,950-$88,500) , as it has been in the past few days .
In terms of Elliott Wave theory , Bitcoin appears to be completing a main wave 4 . The main wave 4 structure can take two forms: Double Three Correction(WXY)_Expanding Flat(3-3-5) .
I label this analysis " Short " for the following reasons:
Due to Bitcoin's higher correlation with the S&P 500 Index ( SP:SPX ) these days, I am short on the S&P 500 Index.
China’s president Xi Jinping says Trump lied about them having a phone call ; it is NOT good news for the S&P 500 Index and Bitcoin .
CME Gap($92,525-$91,415) has NOT filled yet, and I think Bitcoin will NOT start the next bullish rally before filling the CME Gap.
I expect Bitcoin to drop to at least $92,830 and then decline to the Support zone($92,000-$91,400) if the Support lines are broken.
Cumulative Short Liquidation Leverage: $96,741-$95,520
Note: If Bitcoin can touch $97,000, we should expect more pumping.
Note: If Bitcoin goes below the 100_SMA(Daily), we should expect a fall.
Please respect each other's ideas and express them politely if you agree or disagree.
Bitcoin Analyze (BTCUSDT), 1-hour time frame.
Be sure to follow the updated ideas.
Do not forget to put a Stop loss for your positions (For every position you want to open).
Please follow your strategy and updates; this is just my Idea, and I will gladly see your ideas in this post.
Please do not forget the ✅' like '✅ button 🙏😊 & Share it with your friends; thanks, and Trade safe.
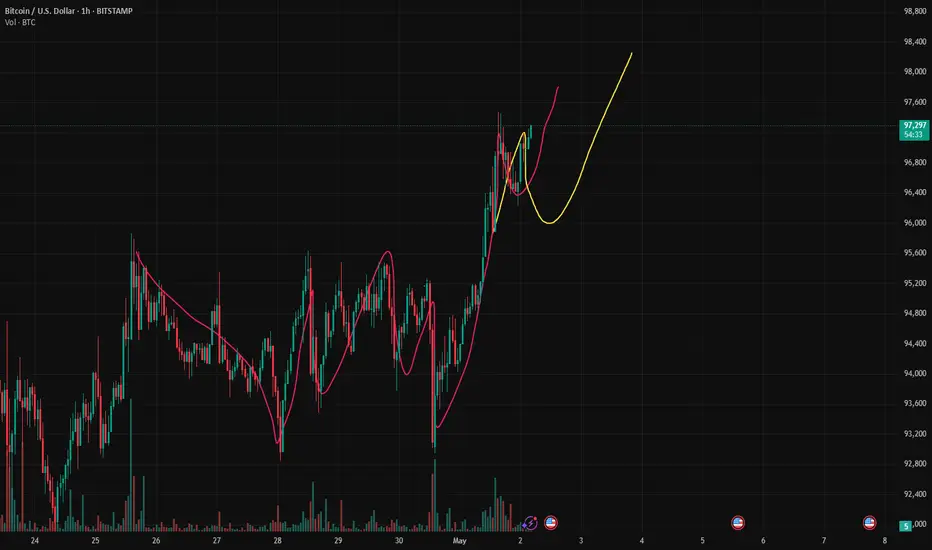
The decisive day of major data (BTCUSD)Yesterday, it was mentioned that the expectation of continuing to buy after a retracement of 96k was completely correct. Followers also made good profits.
BTCUSD bulls are still strong. The retracement is mainly long trading, which needs to be paid attention to at present. 96k/95k are both good buying opportunities.
TP98K-100K
#BTC/USDT Update. Bitcoin is currently trading around a key resistance zone.
The immediate support lies near $95,554, while a confirmed breakout above $97,300 could trigger an uptrend toward $104,000.
Until then, trade with caution.
DYOR. NFA.

Can BTCUSD continue to be purchased? The answer is definitely.Can BTCUSD continue to be purchased? The answer is definitely.
The current trend is a rebound trend after a volatile decline. The space for a short-term increase of 1,500 points is very simple. The target position is 94,700-95,200. Friends who like to do short-term swing trading can follow.

#BTC Ascending Triangle📊#BTC Ascending Triangle📈
🧠From a structural perspective, we are currently in an overlapping resistance zone. We failed to fall further yesterday to build a short structure, but continued to digest the selling pressure here in a sideways consolidation manner. Today, we attacked the heavy resistance area near 95,000 again. Only by breaking through this area can we start the surge mode.
➡️From the perspective of wave theory, there is another opportunity to form a bullish wolf wave here, which also represents a signal that the trend is about to end.
➡️From a morphological perspective, an ascending triangle has formed here, and it has now broken upward. We can expect more gains to appear.
Let's see👀
🤜If you like my analysis, please like💖 and share💬
BITGET:BTCUSDT.P

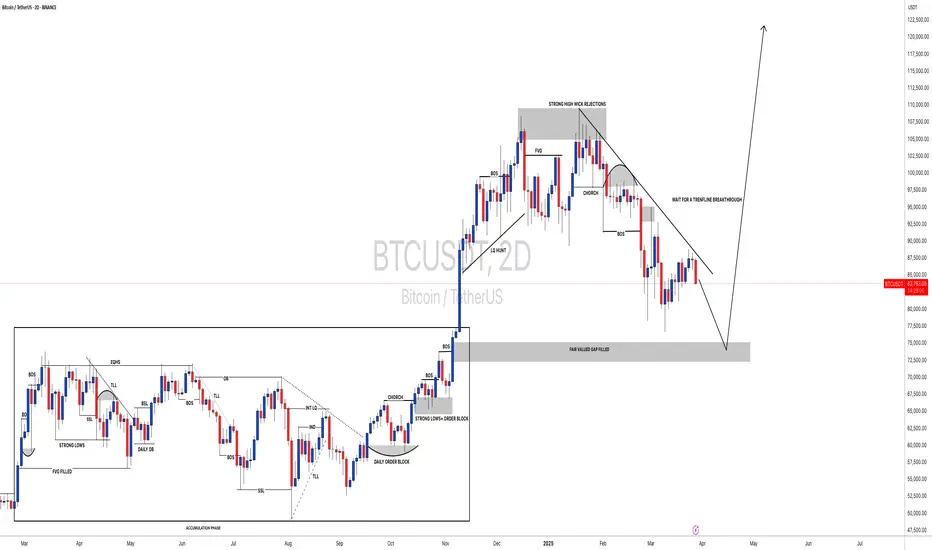
Bitcoin Repeating 2022 Structure? Same Setup, Same Outcome?Bitcoin’s current market structure is starting to mirror its 2022 setup—right before the big drop.
This chart shows a familiar pattern: a rally, a peak, first drop from the ATH, a bull trap… then the major second leg down.
If history repeats, CRYPTOCAP:BTC could be on the verge of another significant move.
Will it break the cycle this time—or follow the same path again?
📉 What do you think?
Share your take in the comments below.
Please support this idea with a LIKE👍 if you find it useful🥳
Happy Trading💰🥳🤗
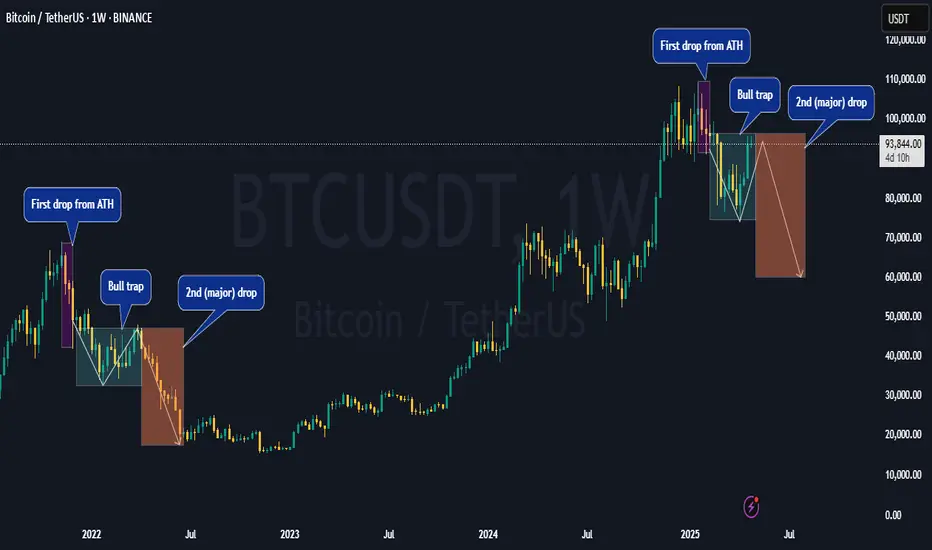
BTCUSDT 1W UpdateYes, history is likely to repeat itself, making it possible for Bitcoin to reach a new all-time high in the range of $130K to $150K this year.
Are you ready?

Bitcoin's 215-Day Pattern: Another Breakout Loading?The Bitcoin chart shows a repeating pattern of consolidation lasting 215 days before each major upward breakout. This cycle has occurred multiple times over the past two years, with each accumulation zone followed by a strong bullish rally.
Currently, Bitcoin is once again emerging from a similar 215-day consolidation phase, suggesting the potential for another significant move to the upside if the pattern holds. If history repeats, we could see a target around $150K.
BINANCE:BTCUSDT CRYPTOCAP:BTC

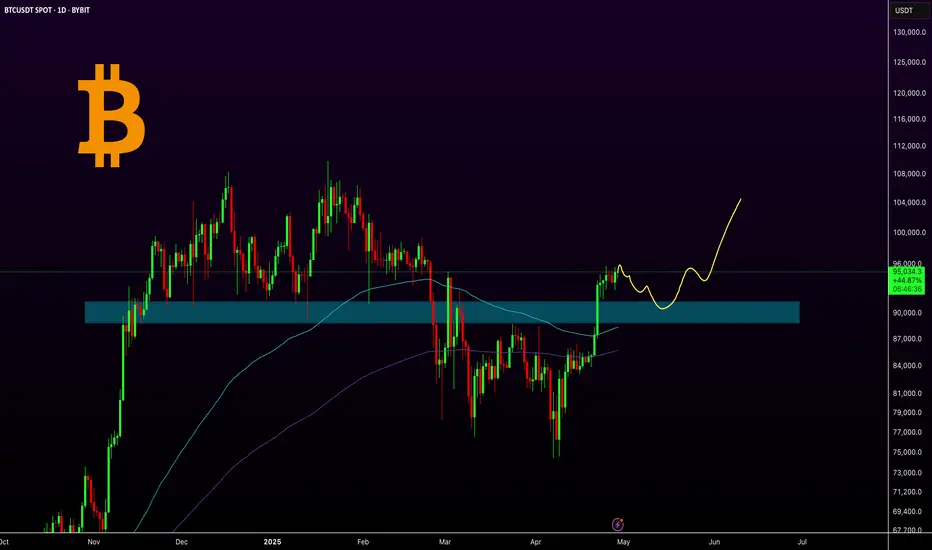
BTC Correction Likely Before ATHBTCUSDT technical analysis update
BTC price could drop to the GETTEX:89K –$91K range before moving higher. There's a CME futures gap at $90.7K, which may act like a magnet. BTC has strong support around $90K and may see a small pullback before reaching a new all-time high.
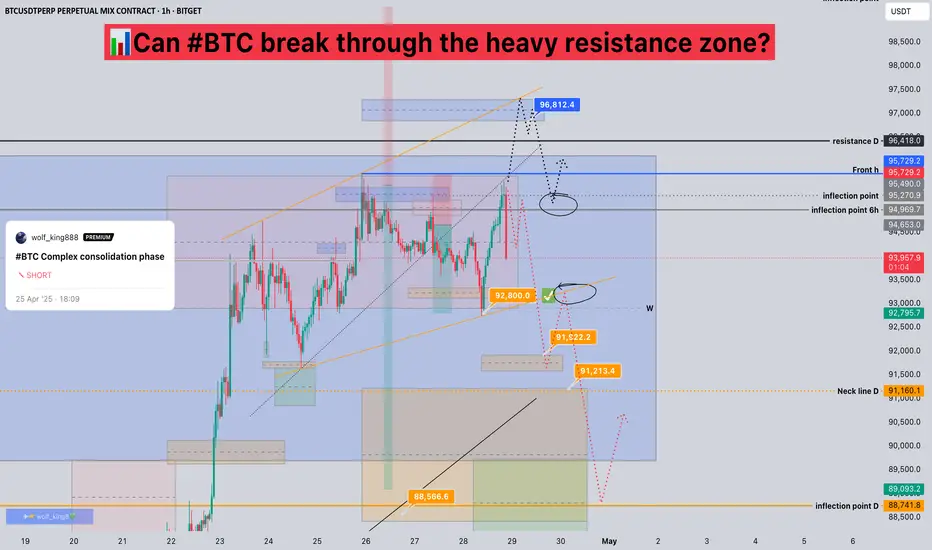
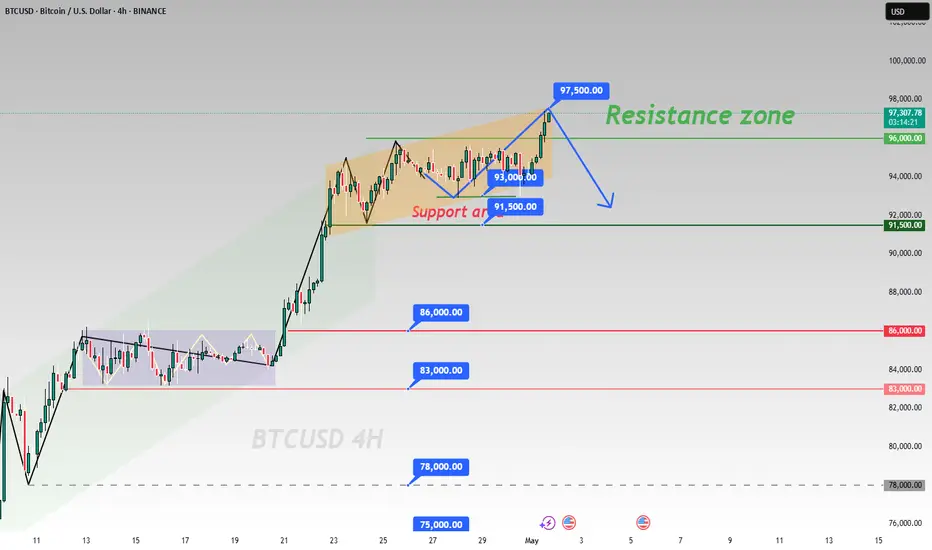
Can #BTC break through the heavy resistance zone?📊Can #BTC break through the heavy resistance zone?
🧠From a structural perspective, we are currently in an overlapping resistance zone. We are currently testing the upper edge of the heavy resistance zone again. If we cannot successfully break through, we should be wary of further pullbacks. If we fall below the low near 92,800 and establish a short structure, then we will look for short opportunities after the rebound.
➡️If we continue to break through the previous high, it means that the bullish power is still continuing. Be patient and wait for the pullback opportunity after breaking through the high to appear before looking for entry opportunities.
➡️My short position was reduced by 80% after reaching TP2, and the stop loss was moved down, so the long position hit the breakeven point and was closed. If you don’t move the SL down, you can try to use a small position to expect a scenario where you can’t break through.
Let’s see 👀
🤜If you like my analysis, please like 💖 and share 💬 BITGET:BTCUSDT.P