#BTC #BTCUSD #BTCUSDT #BITCOIN #Wyckoff #Analysis #Eddy#BTC #BTCUSD #BTCUSDT #BITCOIN #Wyckoff #Analysis #Eddy
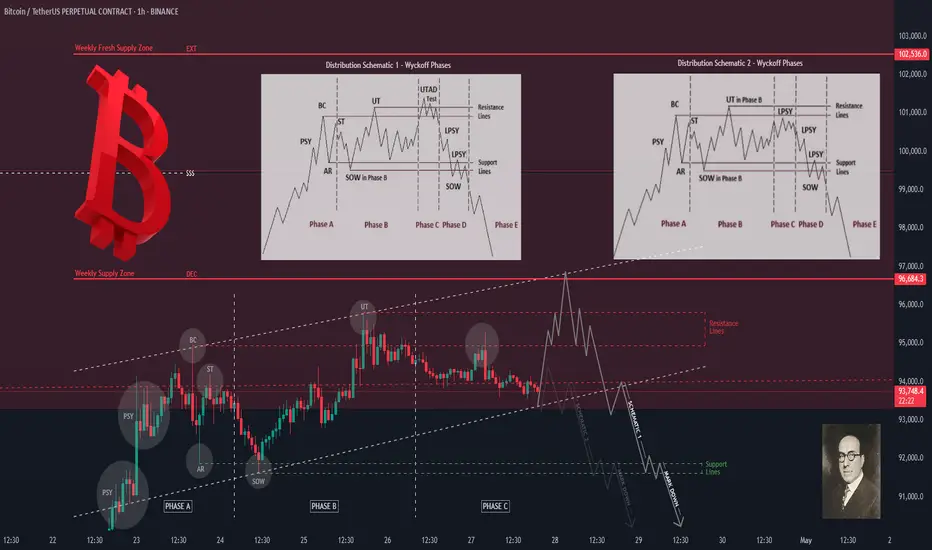
This analysis is based on the analytical style of the Wyckoff Distribution Structure of Schematics 1 and 2.
I have outlined for you the important parts of the Wyckoff style on the one-hour timeframe.
Currently, we are in Phase C of the Wyckoff Distribution Structure.
We have to wait for the completion of this phase and the start of Phase D of the Wyckoff Distribution Structure.
When will this structure be fully confirmed? When the Bitcoin price falls to the 91800 support and gathers the final spring when this support is broken for the fall, we will enter a short position by getting the necessary confirmations based on our style and strategy.
💬 Note: It is not exactly clear whether the market maker will act based on Schematic 1 or 2, so the best entry point for short positions will be the 91800 support break. If, based on the schematic 1, the Bitcoin price UTAD and test formed, high-risk traders who are willing to trade in the opposite direction can enter a short position by getting confirmation in the time frames below 15 minutes.
Where will the targets be? The first target is 62000 and the second target can be 46000 dollars.
When can you safely close the position and enter a reverse trade, that is, long or buy? When a Wyckoff accumulation structure is formed at one of the targets.
The responsibility for the trade is yours and I have no responsibility for your failure to comply with the risk and capital management.
Good luck and be profitable.
I also invite you to review and view my latest analysis on Bitcoin via the link below:
For altcoins, follow my analysis on the Total 3 chart.
My analysis of the Total 3 chart:
BTCUSDTPERP
#BTC #BTCUSD #BTCUSDT #BITCOIN #Update #Analysis #Eddy#BTC #BTCUSD #BTCUSDT #BITCOIN #Update #Analysis #Eddy
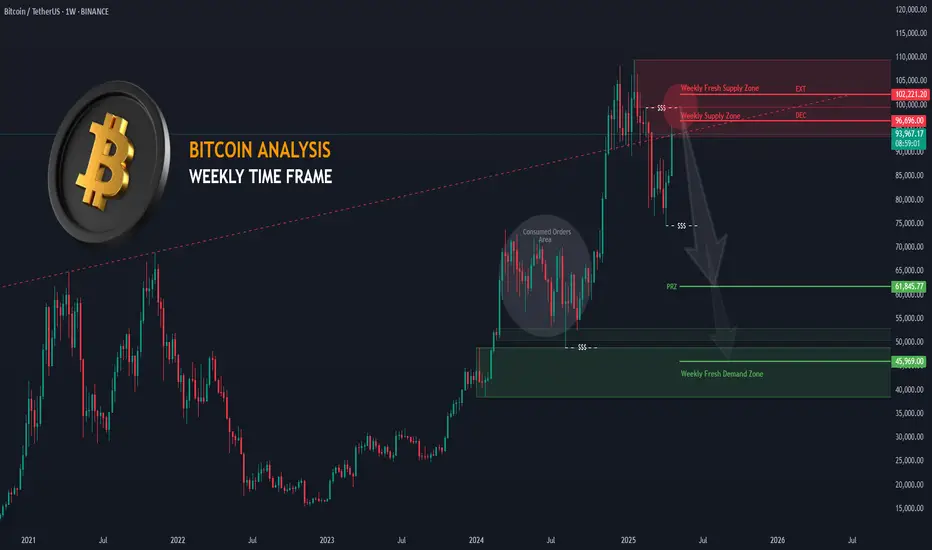
I have identified the important support and resistance areas of the weekly timeframe for you.
I have identified the important resistance prices for the start of the decline with the red line and the important support prices for the start of the growth with the green line.
This analysis is based on a combination of different styles, including the volume style with the ict style.
Based on your strategy and style, get the necessary confirmations for this analysis to enter the trade.
Don't forget about risk and capital management.
The responsibility for the transaction is yours and I have no responsibility for your failure to comply with your risk and capital management.
💬 Note: An important analysis will be presented on the lower timeframe on Bitcoin soon, which, based on the chart and explanations sent in that analysis, you can hunt for Bitcoin's decline by getting confirmation, pay attention to the current chart and consider important liquidity, including the Decision and Extreme areas.
Be successful and profitable.
For altcoins, proceed according to my analysis on the Total 3 chart.
My analysis of the Total 3 chart:
You can also view and review my previous analyses on my TradingView page.
Please don't forget to like and follow, your support encourages me to continue on my path and provide more analysis and updates.
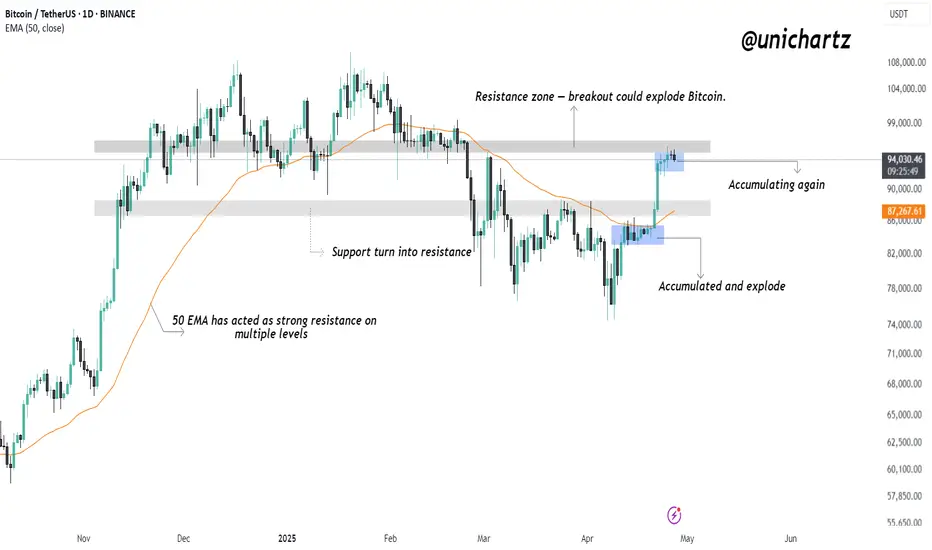
Accumulation Underway: Bitcoin’s Next Move Could Be ViolentBitcoin has shown a strong recovery after reclaiming the 50 EMA, which had been a major dynamic resistance across multiple levels. After accumulating between $83,000–$87,000, BTC broke out sharply and is now consolidating again just below a major resistance zone at $95,000–$97,000.
The current price action shows another accumulation phase just under resistance — similar to the previous pattern before the breakout.
A clean breakout above this resistance zone could explode Bitcoin toward $100,000+.
On the downside, if rejection occurs, the 50 EMA around $87,000 could act as strong support once again.
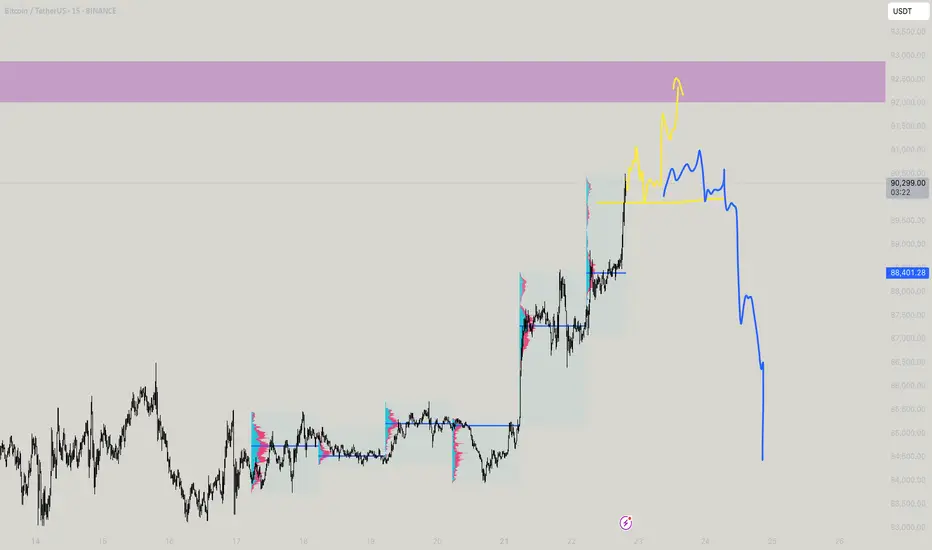
#Bitcoin update , 100K or 88k?#Bitcoin has moved exactly as we anticipated over the past 36 hours.
The real test comes: BTC must break above $95,700 to target the $100K milestone.
This level also marks a major distribution zone on the lower timeframes, making it a tough but not impossible barrier to overcome.
⚡ If BTC gets rejected here, expect a potential revisit to sub-$90K levels.
I’ll keep updating this chart as the price action unfolds.
If you found this helpful, bookmark this post and smash the like button to stay in the loop!
Thank you
#PEACE

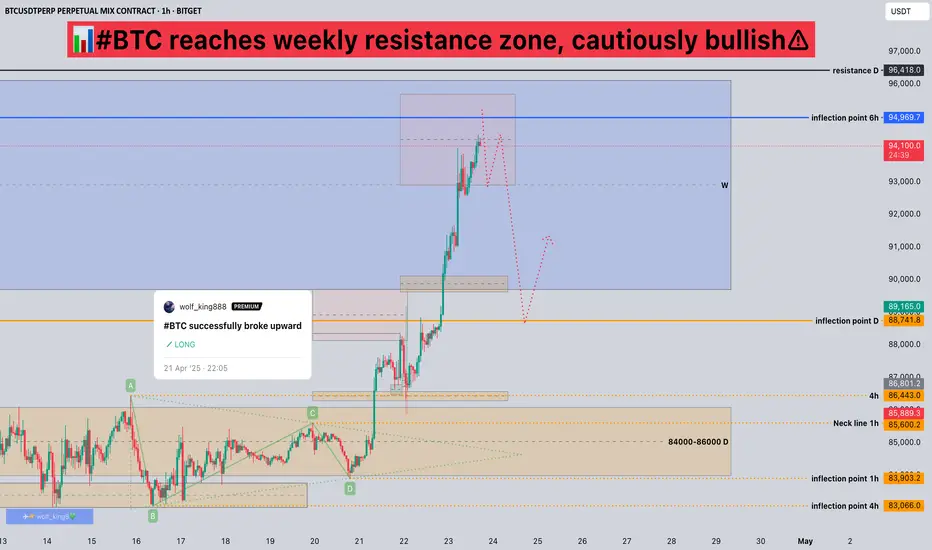
#BTC reaches weekly resistance zone, cautiously bullish📊#BTC reaches weekly resistance zone, cautiously bullish⚠️
🧠From a structural point of view, after we broke through the resistance zone at the daily level, the resistance zone turned into a support zone, so after the price fell back to this support zone, I participated in some long trades. The interim target is around 90,000, so I chose to close all positions after reaching here.
➡️In general, my mind is still in the shock trading, so I don’t look forward to the goal too far. Because we haven’t built a long structure at the daily level, we still need to be vigilant.
➡️Currently we have reached the resistance zone at the weekly level, don’t chase the rise here. We can look for some short signals in this area to participate.
⚠️Note that the large level belongs to the long trend, the correction at the daily level is over, and it is possible to start the upward trend at the daily level. Try to focus on long trades.
Let’s take a look👀
🤜If you like my analysis, please like💖 and share💬
BITGET:BTCUSDT.P
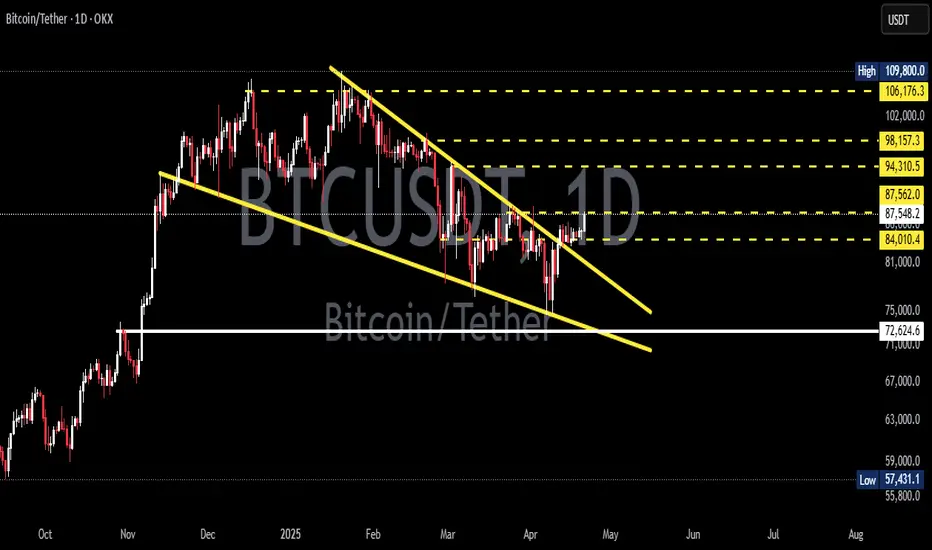
BTCUSDT 1W AnalysisBTC ~ 1W Analysis
#BTC It is necessary to wait until this pattern is successfully broken to confirm a sustained bullish trend.

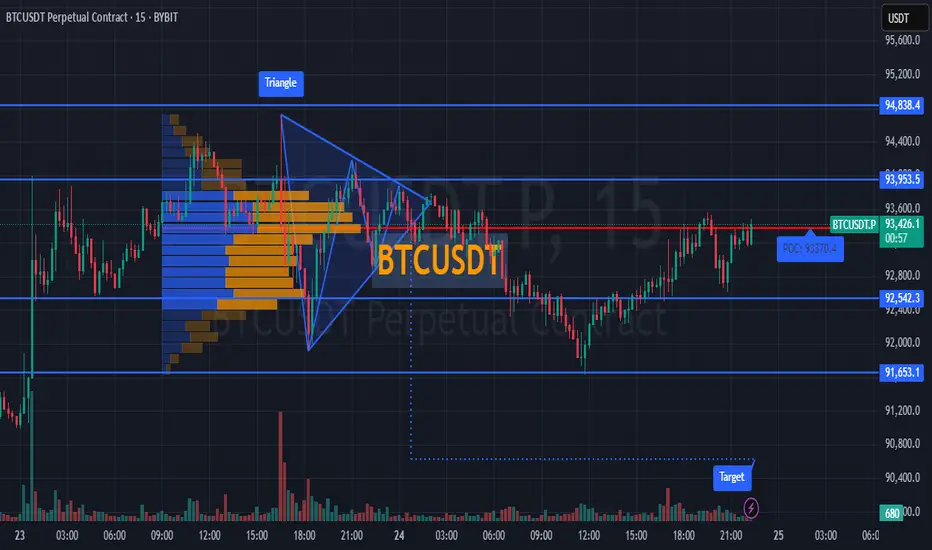
Market Analysis: #BTCUSDT💰 On the BYBIT:BTCUSDT.P chart, a clear symmetrical triangle pattern has formed and already broken down, leading to a confirmed bearish impulse. Price has now returned below the POC level at $93,370.4 (Point of Control by volume), indicating weakness from buyers.
📊 Key Levels
🔴 POC BYBIT:BTCUSDT.P $93,370.4
— This is the highest volume area, now acting as strong resistance. As long as price remains below, short bias is favored.
🔵 Support BYBIT:BTCUSDT.P $91,905.5
— A short-term target if the bearish momentum continues.
🎯 Lower Target Zone
— Indicates the full depth of the breakdown move, aiming at the $90,800–$91,000 range.
📈 Volume
➡️ Volume increased during the breakdown, then dropped as price revisited the $93,000 zone — this signals a weak retest and seller control.
📍 Important Notes
➡️ Currently, BYBIT:BTCUSDT.P is trading between two key zones — the POC above and the $91,900 support below.
➡️ Failure to break and hold above $93,370 keeps the bearish scenario in play.
➡️ A move below $92,600 will confirm continuation of the downtrend.
📢 Strategy Recommendations:
🚨 SHORT Scenario BYBIT:BTCUSDT.P
Entry: on a retest of $93,000–$93,200 and rejection
Stop Loss: above POC ($93,450)
Targets: $92,100 → $91,900 → $90,800
🚨 Alternative LONG Scenario BYBIT:BTCUSDT.P (only if POC is broken):
Entry: after a solid breakout and hold above $93,400 with volume
Target: $94,200–$94,800
Stop Loss: below $93,000
🚨 Conclusion :
BYBIT:BTCUSDT.P has completed the triangle pattern and is now in a retest phase. So far, signs still point to bearish continuation, with final confirmation coming from a break below $92,600.
#BTC is stuck but Here's the simplified Plan!Bitcoin is currently trading between key levels:
Upper resistance: 93700
Lower support: 91670
We are stuck in this range, and a breakout above or below these levels will confirm the next move in the trend.
Right now, Bitcoin is holding the 50 EMA on the 30-minute chart. As long as this support holds, we could see a move towards 95k, after which we will reassess the chart.
Here are two possible scenarios if we hit 95,700 again:
We break above and target 100k
We face rejection and correct back to 88k. While this wouldn’t be a large correction, it could offer a very opportunistic entry point.
I’ll be sharing more insights and updates as the chart unfolds.
Follow me on all my socials (link in bio).
Drop your thoughts in the comment section and hit the like button if this is useful.
Thank you
#PEACE

MY POV ON BTCMy point of view on BTC is simple, as we are in important supply zone, if we cross it then its a manipulation and dump will also be big, if we stay in then its mean stability in the market and alts will pump, if rejects from that supply zone then its mean when it comes time for alts to pump and BTC starts going down so alts will suffer.

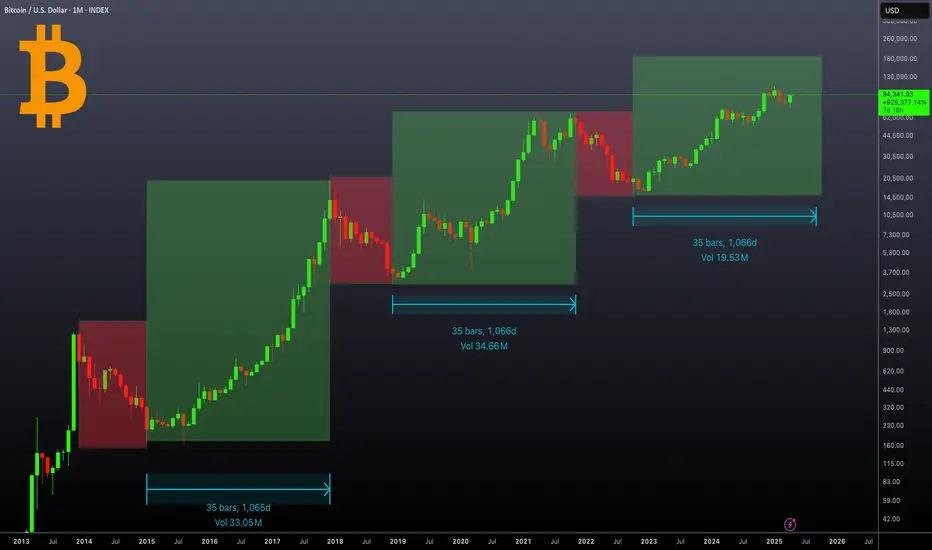
Bitcoin bull run ends in 6 months?The above chart presents a macro view of Bitcoin’s monthly price action, showcasing the historical pattern of bull and bear market cycles. Each green box highlights a bull run lasting approximately 35 months (or 1,066 days), a consistent duration seen in the previous two cycles from 2015–2018 and 2019–2022. The current cycle, which began in late 2022 or early 2023, is now entering its final phase, suggesting that if the pattern holds, the BTC bull run may have around 5–6 months remaining before a potential peak.
The price action continues to mirror previous cycles, indicating that history may once again be repeating itself. If this cyclical behavior continues, traders and investors should consider the possibility of a cycle top approaching and plan accordingly,.
Bitcoin Will Soon Follow GOLD!!!Bitcoin has just hit the $87,000 mark, breaking out of a classical bullish continuation pattern. This breakout is significant and indicates strong bullish momentum that could lead to further upside. If this momentum continues, Bitcoin has the potential to not only reclaim its previous all-time high but also push beyond into price discovery mode.
Interestingly, this move comes right after Gold printed a new all-time high. Historically, Gold has often led major macro cycles, with Bitcoin following closely behind. This pattern seems to be playing out once again. As investors rotate capital and seek safe havens or inflation hedges, Bitcoin stands to benefit as the digital equivalent of Gold. If history repeats, Bitcoin could be on the verge of its next major rally.
From a technical standpoint, the breakout is supported by increasing volume and bullish momentum indicators such as RSI and MACD. The key support now lies around the $85K– GETTEX:87K zone, which previously acted as resistance. If price holds above this level, the next targets to watch are $90K and the psychological $100K mark.
That said, proper risk management is crucial. The market is moving fast, and while the setup is bullish, it’s important to have a well-defined stop-loss strategy in place. Avoid chasing price—wait for clean retests or consolidations if you missed the initial breakout. Momentum may be in the bulls’ favor, but discipline keeps you in the game.
Bitcoin has made its move. Gold has shown the way. If the historical correlation holds true, Bitcoin may be just getting started. Stay focused and manage your risk wisely.

BTC where to? 92.6k?Yeah looks legit to go till 92.6k but nowhere the pull is extraordinary pull, why not 83.2k? Just saying
BTC Breaks Key Resistance –Pullback Your Last Chance to Enter!?To start today's analysis, it's best to look at the Bitcoin ( BINANCE:BTCUSDT ) analysis I shared with you on April 10 , which can give us good insight and has performed well so far .👇
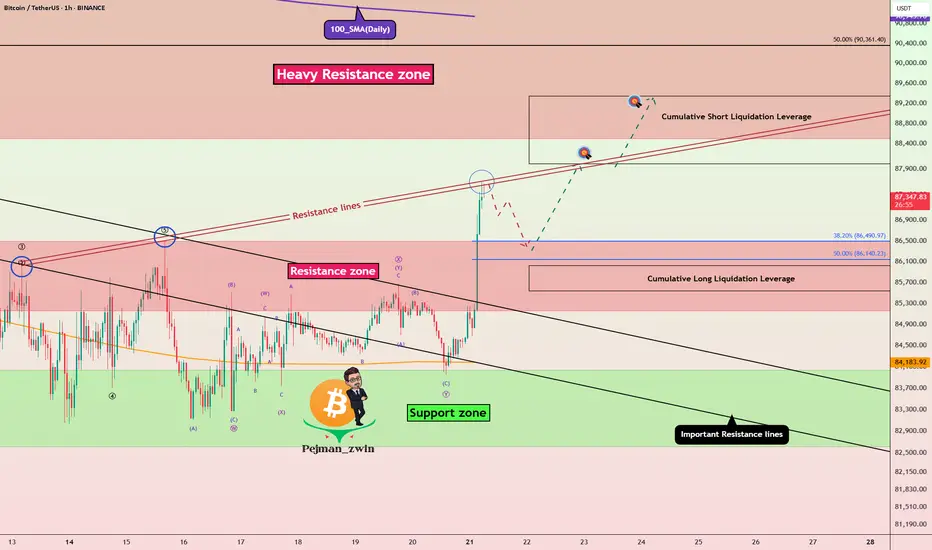
Bitcoin seems to have finally managed to break through Important Resistance lines as well as the Resistance zone ($86,500-$85,150) . The break volume is also high and could be a good sign for the continuation of the upward trend .
According to Elliott Wave theory , with the breaking of important resistance lines , we should wait for the next 5 impulsive waves , which I will try to analyze step by step in this idea and future ideas.
I expect Bitcoin to attack the Heavy Resistance zone ($95,000-$88,500) for the first time after the pullback to the broken Resistance zone ($86,500-$85,150) (it is better to enter a long position on the pullback ). Basically, assets can NOT break such heavy zones for the first time . ( With very good news, it may break for the first time ).
Cumulative Long Liquidation Leverage: $86,022-$85,539
Cumulative Short Liquidation Leverage: $89,340-$88,000 = Important
Do you think the main uptrend has resumed or will Bitcoin correct again?
Note: The pullback is likely to start from the third point of contact with the Resistance lines.
Note: If Bitcoin falls below $85,100, it seems we should expect further declines.
Please respect each other's ideas and express them politely if you agree or disagree.
Bitcoin Analyze (BTCUSDT), 1-hour time frame.
Be sure to follow the updated ideas.
Do not forget to put a Stop loss for your positions (For every position you want to open).
Please follow your strategy and updates; this is just my Idea, and I will gladly see your ideas in this post.
Please do not forget the ✅' like '✅ button 🙏😊 & Share it with your friends; thanks, and Trade safe.
BTCUSDT at daily resistance, likely to head to 84kThe price has hit the daily resistance as expected in the quoted post. I see a pullback here which is already started. A short trade setup is favorable gere, We take a short in this zone and target towards daily support DS1. The correction can go upto weekly suppor WS1 but lets focus on this short trade first. risking 1.5% for 4.5% win.

#BTC successfully broke upward📊#BTC successfully broke upward✔️
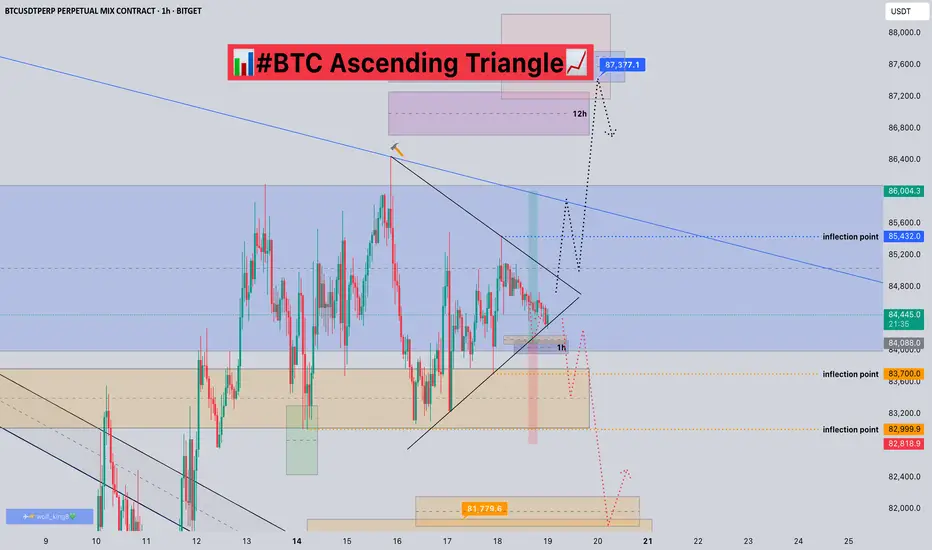
🧠From a structural perspective, we successfully broke through the daily resistance zone, and the resistance zone turned into a support zone. The next resistance zone worth our attention is 88000-89700. At present, we have reached the staged resistance zone near 87377. If we can consolidate a short structure from here, then the target area of this structure overlaps with the yellow support area, then it is a long area that is very worthy of our attention.
➡️From a graphical perspective, the price is gradually compressed to form an ascending triangle. At present, it has chosen to break upward, but the appearance of this model means that the bullish trend is about to end, so we still need to be vigilant about the risk of falling back. We need to observe the order of arrival of the yellow support zone and the red resistance zone to participate in different transactions.
⚠️Note that if we directly fall below the inflection point 83903, the bullish expectation will fail, and the daily support zone will turn into a resistance zone. If the price rebounds to this area, then we can look for shorting opportunities.
Let's see👀
🤜If you like my analysis, please like💖 and share💬
BITGET:BTCUSDT.P

btc is sell POIThese POIs were marked last week, Now price is in sell POI, we will enter short after sell confirmation,

BTCUSDT 1D Analysis UpdateBTC ~ 1D Analysis Update
#BTC Alright let's continue this bullish, a minimum of $ 130,000 - $ 150,000 in 2025.
BTC - Ready for a FLUSH?BTC has acquired liquidity both sides, lets see closing 88.9k on day can make way lots of things! Eventually 83.1k is my main targets!

BTC in Tight Range: Calm Before the Storm?$BTC/USDT is consolidating within a tight range (highlighted in the blue box) for the past 8 days. This looks like a strong accumulation phase, suggesting that the next breakout could be explosive.
Watch for a decisive move above the range for confirmation.
DYOR, NFA

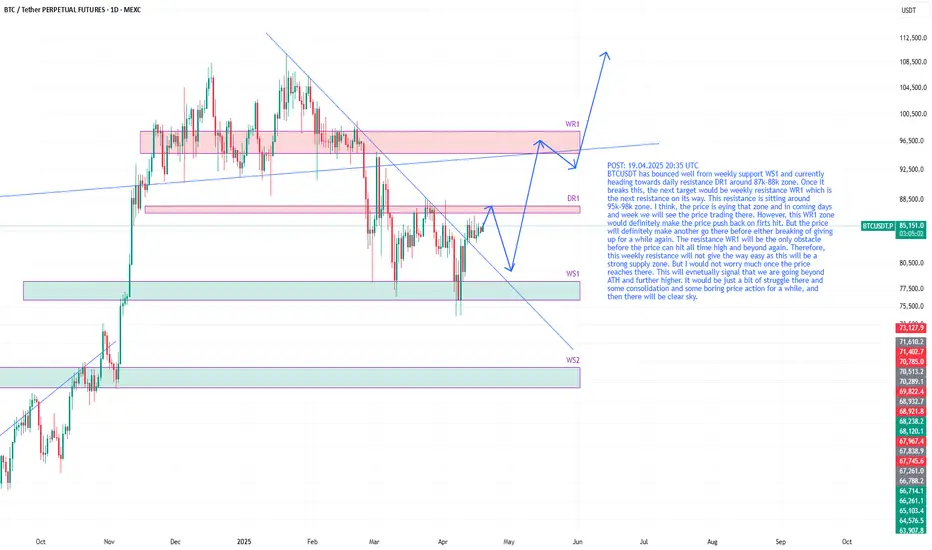
BTCUSDT hitting daily resistance but eying weekly resisatnce 98kBTCUSDT has bounced well from weekly support WS1 and currently heading towards daily resistance DR1 around 87k-88k zone. Once it breaks this, the next target would be weekly resistance WR1 which is the next resistance on its way. This resistance is sitting around 95k-98k zone. I think, the price is eying that zone and in coming days and week we will see the price trading there. However, this WR1 zone would definitely make the price push back on firts hit. But the price will definitely make another go there before either breaking of giving up for a while again. The resistance WR1 will be the only obstacle before the price can hit all time high and beyond again. Therefore, this weekly resistance will not give the way easy as this will be a strong supply zone. But I would not worry much once the price reaches there. This will evnetually signal that we are going beyond ATH and further higher. It would be just a bit of struggle there and some consolidation and some boring price action for a while, and then there will be clear sky.
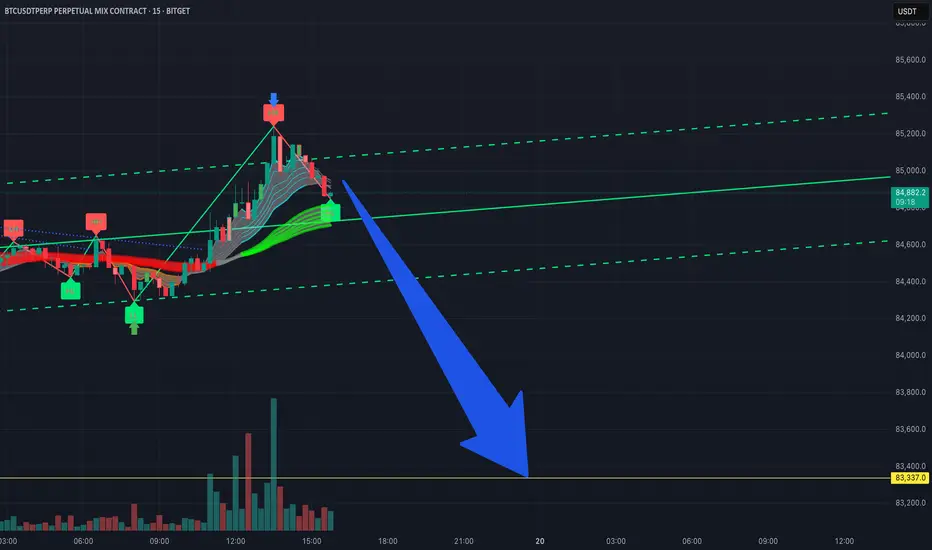
I’m estimating a short target for Bitcoin futures on the 15-minuLooking at the 15-minute chart on Bitget, I'm expecting a potential drop down to around 83,337. Just something to keep an eye on if you're in a short-term trade.
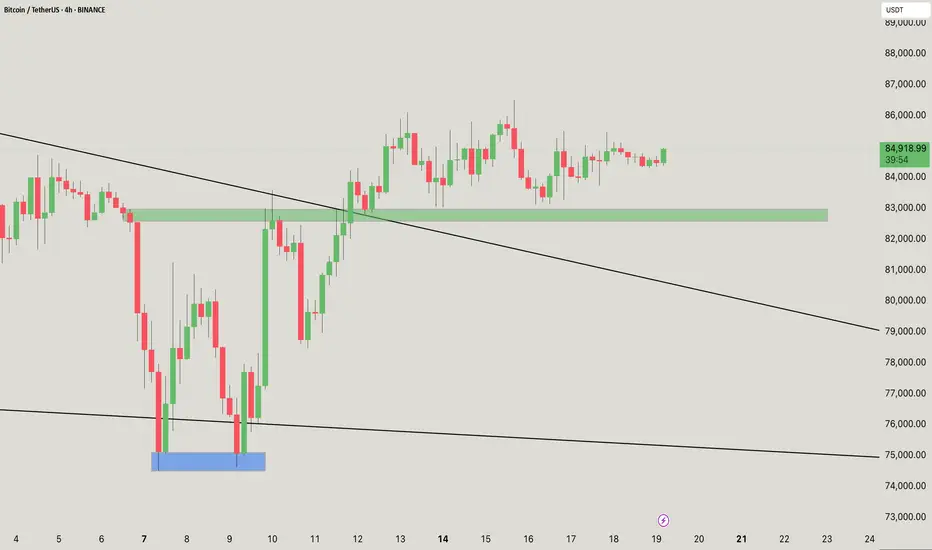
Bitcoin is currently trading around 85,269.35 USDT. Bitcoin is currently trading around 85,269.35 USDT.
Support Zone: A crucial support zone marked in green suggests strong buying interest between 80,000 and 81,000 USDT.
Resistance: The upper trend line indicates resistance; if Bitcoin can break it, it could target levels close to 88,000 USDT.
Bullish Case: A breakout above the upper trend line could lead to an upward rally towards 88,000 USDT or above.
Bearish Case: If the price breaks below the support zone, a downward move towards 75,000 USDT can be expected.
Monitor the trade closely to see how it reacts around these crucial levels. Adjust your strategy accordingly based on the price action. If you have further questions or need analysis on specific indicators, feel free to ask!
If you found this analysis helpful, hit the Like button and share your thoughts or questions in the comments below. Your feedback matters!
Thanks for your support!
DYOR. NFA
#BTC Ascending Triangle📊#BTC Ascending Triangle📈
🧠As time goes by, the price is gradually compressed and forms an ascending triangle. We need to observe the breakout opportunities on either side to decide what to do.
➡️The trading volume is relatively low over the weekend. In the absence of market volatility, we still wait and see, patiently waiting for the right opportunity to appear.
➡️I wanted to participate in some long trades today, but the price did not reach the overlapping support area quickly, and this support area is also time-limited. Once it exceeds the expected time range, the effectiveness of the support area will decrease, so I decided to cancel the long limit order.
⚠️Be patient!
🤜If you like my analysis, please like 💖 and share 💬
BITGET:BTCUSDT.P