BTCUSD: US dollar strengthens as US bond yields rise pending relInvestors are bracing for a busy week ahead of key economic data, including European inflation data and U.S. employment and non-farm payrolls. These numbers will go a long way in shaping the Federal Reserve and European Central Bank's expectations for monetary policy decisions.
Details of the Fed's discussions are expected to be revealed on Wednesday when the minutes of the December Federal Open Market Committee meeting are released.
According to the CME FedWatch tool, market sentiment reflects an 82% chance that the Fed will start cutting interest rates in March, with more than 150 basis points of easing expected by the end of the year.
Traders are also keeping an eye on volatile oil prices due to concerns about potential supply disruptions in the Middle East following recent attacks on container ships in the Red Sea. In the crypto market, Bitcoin has risen 3.25% since the beginning of the year, reaching its highest level since April 2022, on expectations that the U.S. Securities and Exchange Commission will soon approve Bitcoin spot fund trading. did.
Btcusdtrade
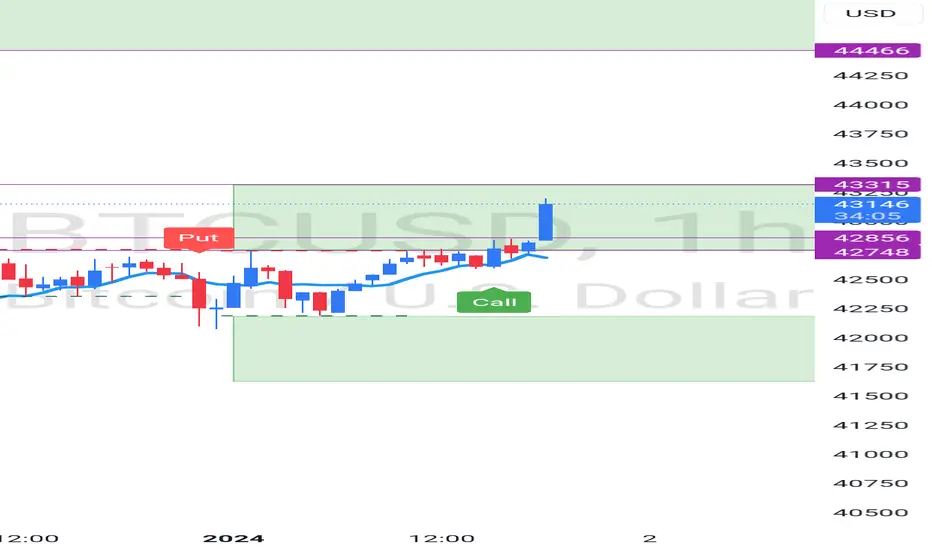
Welcome 2024 - $BTC headed to 44,466 or HigherBitcoin expected to touch 44,466 in next 6 to 12hrs and Higher till 58,000 by this week end. Stay tuned to welcome New Year.
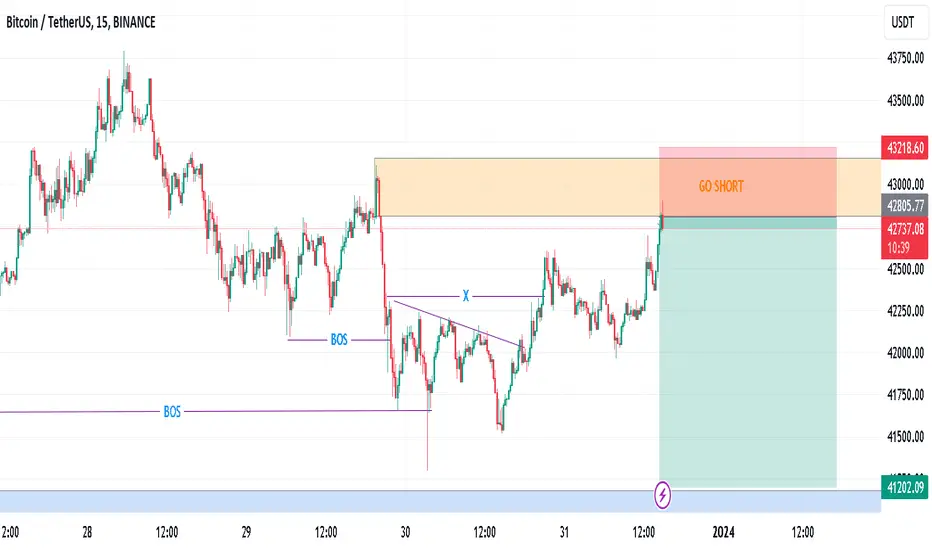
BTCUSDT SHORTA possible short trade idea for bitcoin dollar. Price has grabbed the liquidity from inducement zone and now reacting at its supply zone. Price may drop from this supply zone. Take good care of your stop losses. Happy Trading
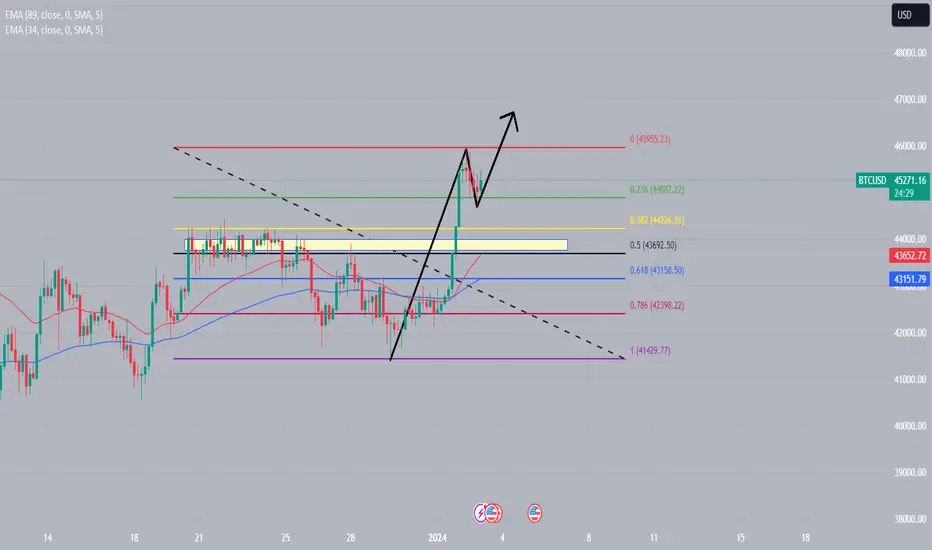
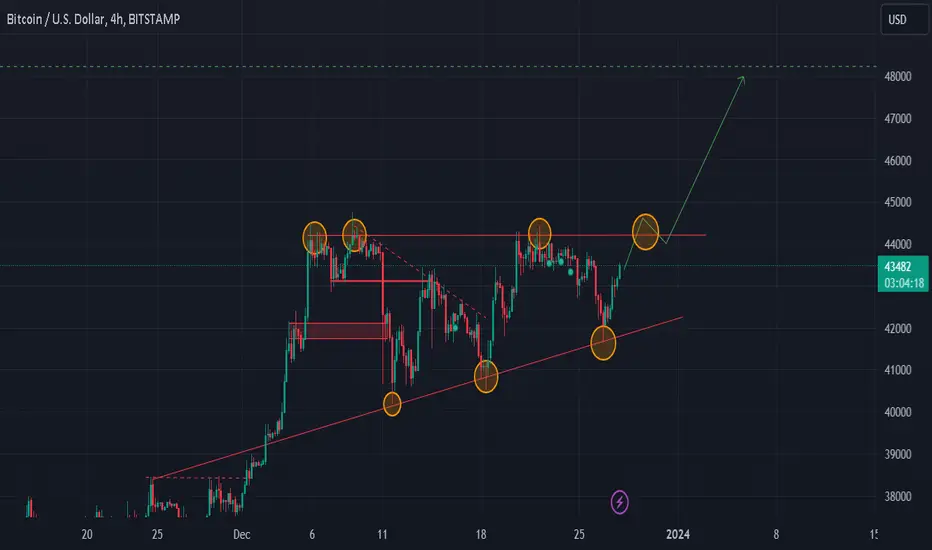
BTCUSD H4 / POTENTIAL RISE UNTIL 48K 📈✅Hello Traders!
This is my idea for BTCUSD H4. At the moment, BTC remains in consolidation, and soon I expect a rise until the price of 44.000 which is a strong resistance level. As a target, I see the price of 48k.
Traders, if you liked my idea or if you have a different vision related to this trade, write in the comments. I will be glad to see your perspective.
____________________________________
Follow, like, and comment to see my content:
tradingview.sweetlogin.com
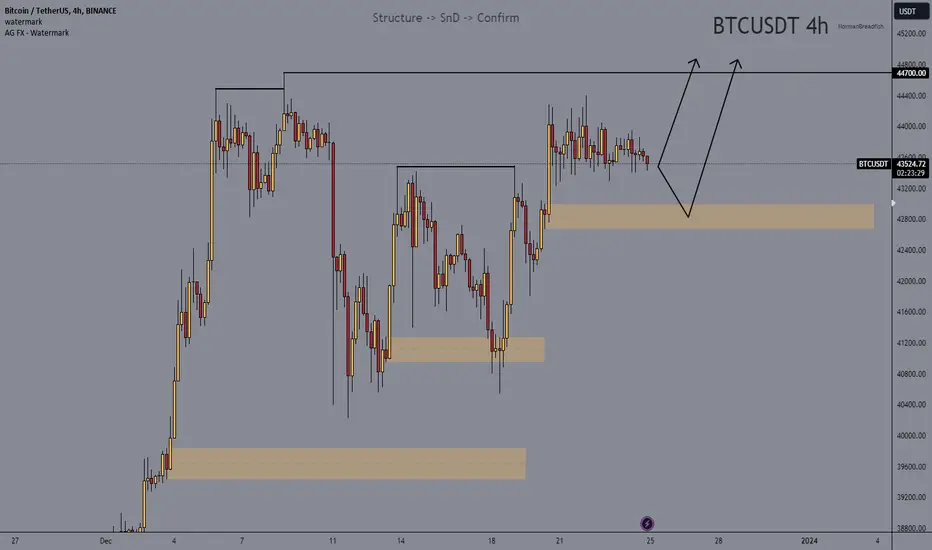
BTC bitcoin outlook 25-31i will be looking for longs to continue the bullish trend on the higher timeframe if we get confirmation of it at the highlighted SnD.
as always, follow your trading rules and position yourself wisely
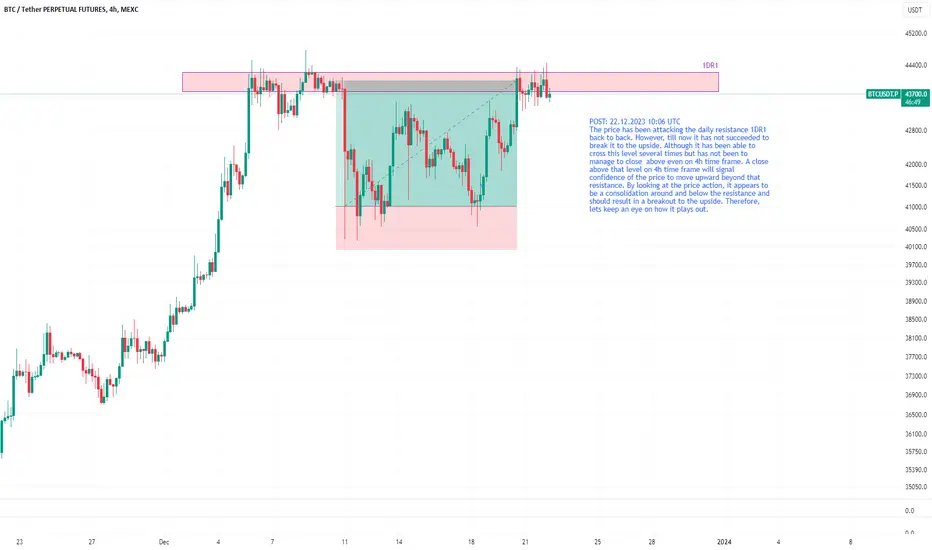
BTCUSDT consolidating below daily resistance, likely to move upThe price has been attacking the daily resistance 1DR1 back to back. However, till now it has not succeeded to break it to the upside. Although it has been able to cross this level several times but has not been to manage to close above even on 4h time frame. A close above that level on 4h time frame will signal confidence of the price to move upward beyond that resistance. By looking at the price action, it appears to be a consolidation around and below the resistance and should result in a breakout to the upside. Therefore, lets keep an eye on how it plays out.
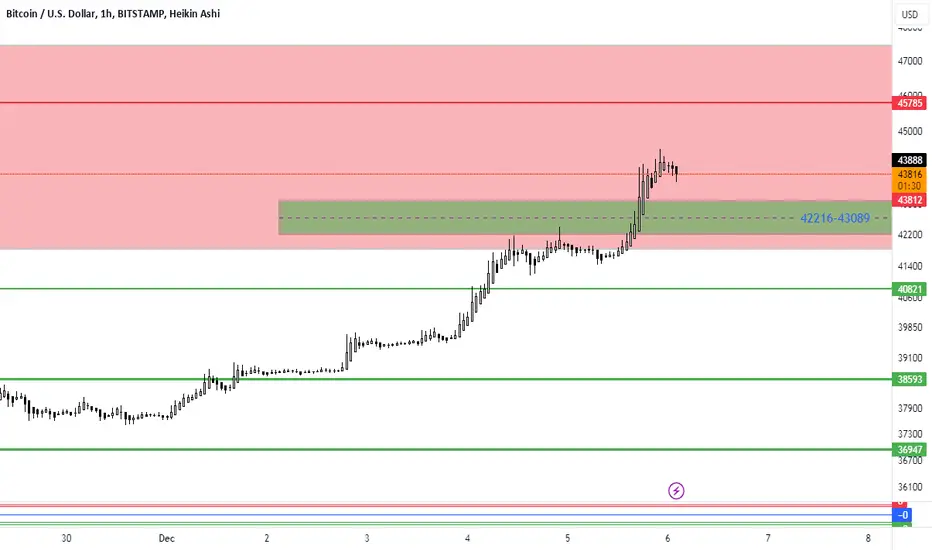
BITCOIN: BTCUSDT in 1 hour Timeframe Hello friends. According to the Bitcoin chart, we see an abc corrective wave. So it can be expected that its correction will start from the point that has been specified and will go down to the range of $35,500.

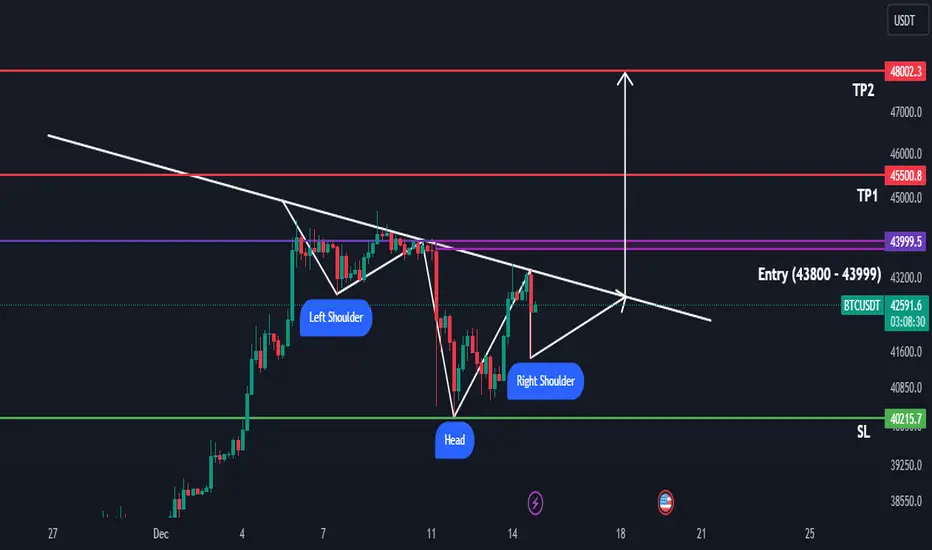
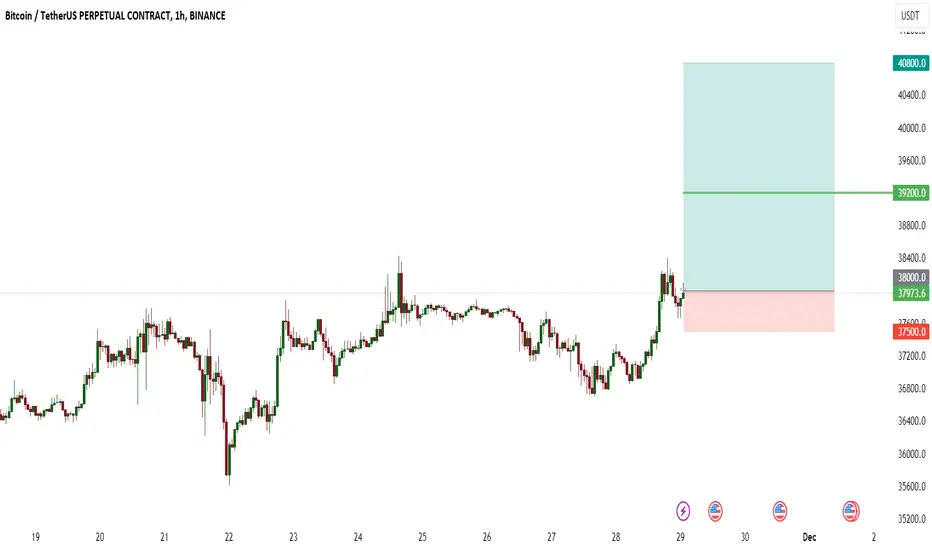
BTC/USDT Looking BullishTRADE ALERT! BTC
Ticker: BTC/USDT
Entry:43800-43999
Take Profit: 45500-48000
Stop Loss: 40215
Risk to reward: 1:2
Technical Thesis:
Bitcoin is making an inverse head and shoulder pattern ( bullish)
For this bitcoin need to hold 42000$ level.
We have neckline around 44000$
Once price breaks neckline with good volume then target can be 45500$ to 48000$
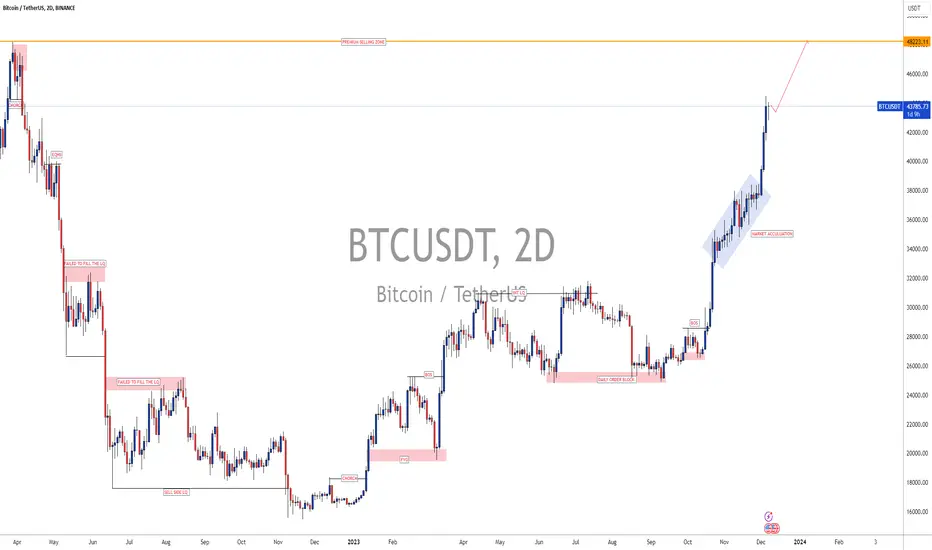
#BTCUSDT: 48K Upcoming! Dear Traders,
BTCUSDT has been bullish ever since November, and it is likely to reach 48k area as price is extremely bullish at the moment. NFP will have significant impact on the price $BINANCE:BTCUSDT. We will keep you update as price move forward.
We are neutral here and coming days price can reach beyond 50k.
BTCUSDT: Long PositionHi there . We see the char BTCUSDT in a abc wave . We in the C wave to reach the target shows in the chart .

BTC USDT I think there will be a Bitcoin pump soon 40K
In order to liquidate accumulated sales contracts
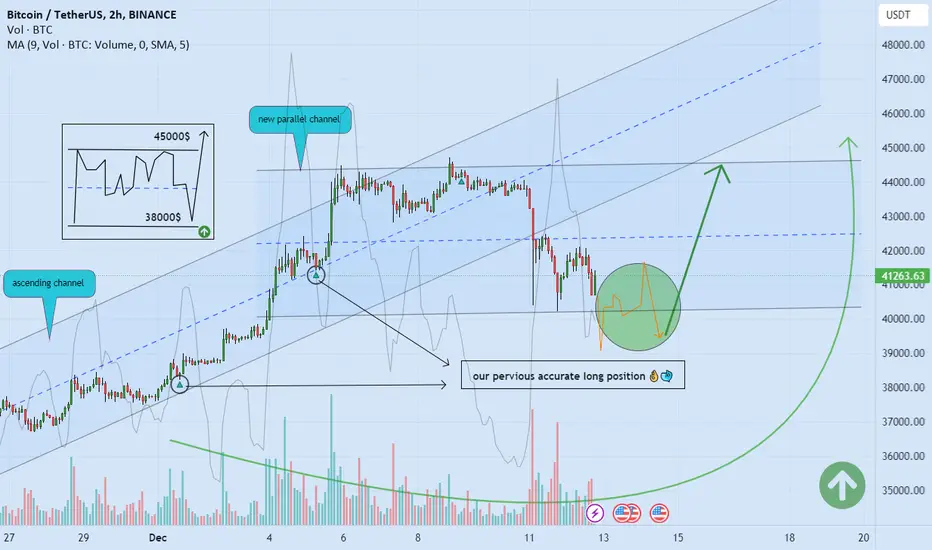
BITCOIN: Range, then gains. 🚀Hello 🐋
Considering the chart
and my previous analysis, the parallel channel created. 👌💪
I anticipate
more correction and range for first target (range of candlesticks both to the downside and upside).📚✔️
Our main goal
is to achieve additional gains, ideally reaching close to 44k. 🚀
👌 Attention: Take note of the price in the condensed chart (positioned above the primary chart in black).
📖💡 Feel free to express your perspective by commenting below. Thanks! 🐋
📈Bitcoin golden position for left behinds📉BINANCE:BTCUSDT
COINBASE:BTCUSD
Hello dear traders. Let's make it simple. I think:
Bitcoin will retest lower levels around 35k. (But the most important dynamic level is the weekly Bollinger midline.)
Then the targets for the next jump are 45k, 47k and then 50k.
Above these levels, the most important price resistance is around 52K and 55K.
I personally bought some bitcoin close to 40k and will keep buying until the price is above 35k. (As you can see, Bitcoin touched the mid-Bollinger line on the daily TF)
✌💥If you are satisfied with my analytical content, please share my ideas💥✌
✍🐱👤Otherwise, make sure you leave comments and let me know what you think.🐱👤✍
🍾Thank you for your support. I hope you will gain profit by following my analyses.🍾

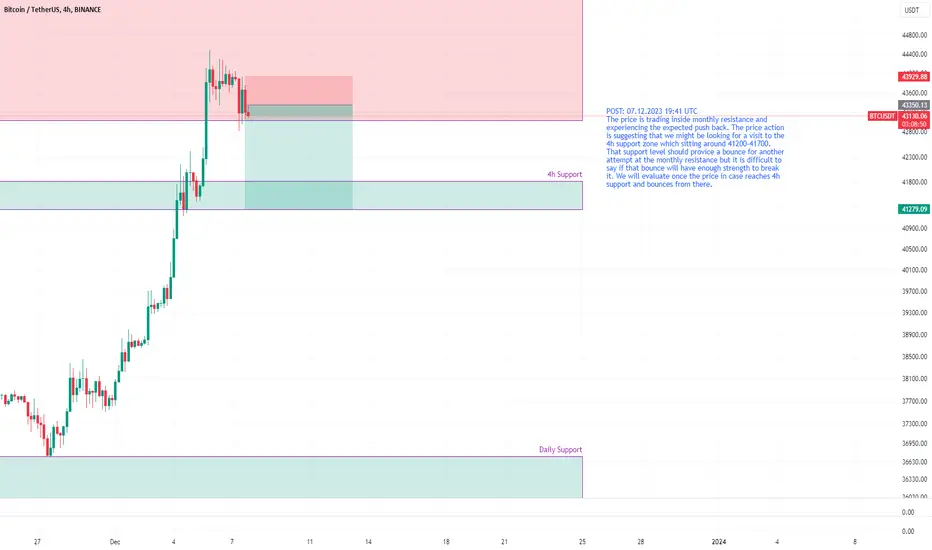
BTCUSDT likely to head to 4h support around 41200-41700The price is trading inside monthly resistance and experiencing the expected push back. The price action is suggesting that we might be looking for a visit to the 4h support zone which sitting around 41200-41700. That support level should provice a bounce for another attempt at the monthly resistance but it is difficult to say if that bounce will have enough strength to break it. We will evaluate once the price in case reaches 4h support and bounces from there.
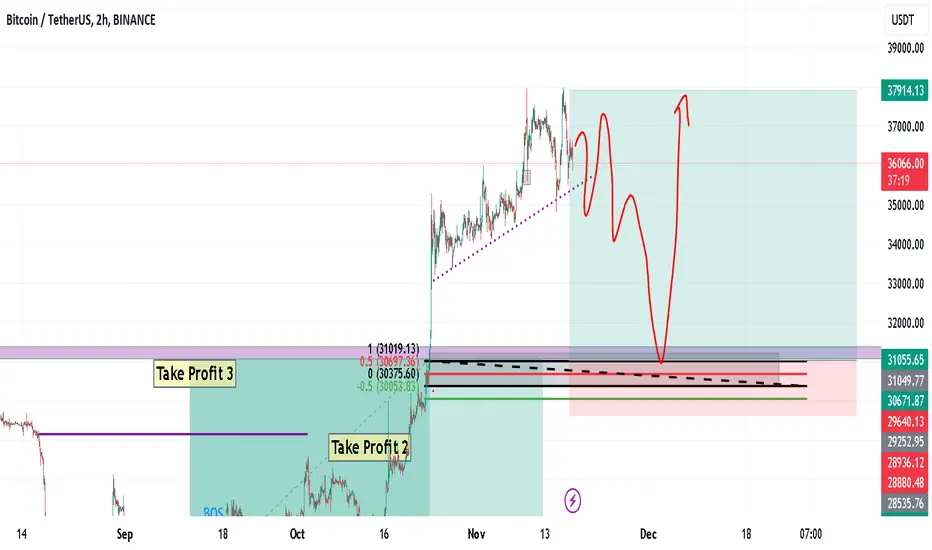
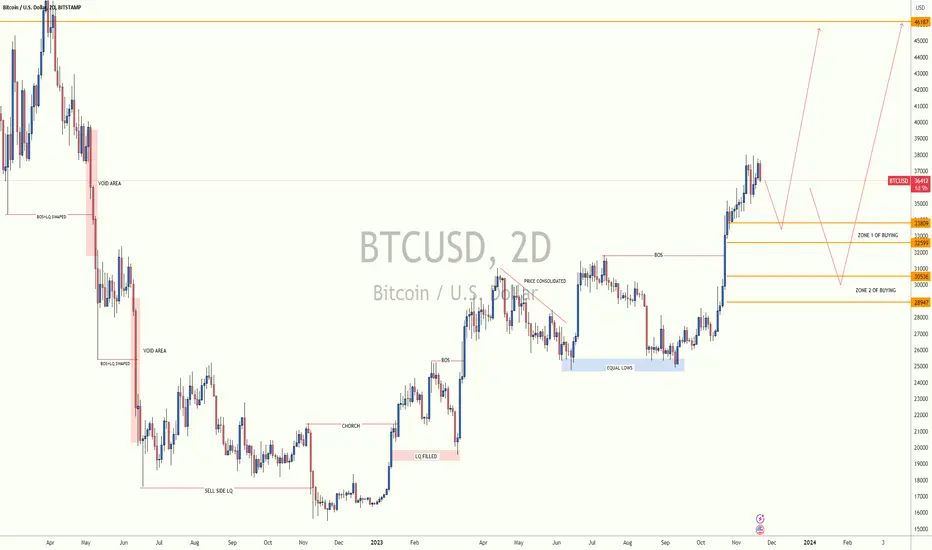
btcDaily update
We have a support range in the green box, which can be an upward trend until it is broken. If the green lines are broken, it will be activated. Our last point is in the range of $27,700. Currently, we are checking in the short term to see the profit of the whole movement. to take
BTCUSDTI'm not bearish on BINANCE:BTCUSDT , but I'm looking for a short setup at 42 and 43K.
⛔"Daily crypto market analyses I provide are personal opinions & not financial advice. Trading carries risks, so do your own research & seek advisor's help. #DYOR"
Don't forget to like and comment.
🚧Bitcoin Can Drop by Rising Wedge Pattern🚧🏃♂️Bitcoin re-entered the 🟡 Price Reversal Zone(PRZ) 🟡 and is currently moving in this zone.
📈If we look at the chart from the view of Classical Analysis , it seems that Bitcoin has succeeded in forming a Rising Wedge Pattern .
🌊In terms of Elliott wave theory , Bitcoin seems to be completing wave C of the corrective Zigzag(ABC/5-3-5) structure.
💡Also, we can see Regular Divergence(RD-) between Consecutive Peaks .( Volume )
🔔I expect Bitcoin to start falling again after touching the upper line of the Rising Wedge Pattern and at least fall to the lower line. If Bitcoin manages to break the support lines and the lower line of the wedge, we should expect Bitcoin to fall to the 🟢 Support
zone($36,000_$35,560) 🟢.
❗️⚠️Note⚠️❗️: If BTC can break the 🟡PRZ🟡, the Scenario will change.
❗️⚠️Note⚠️❗️: An important point you should always remember is capital management and lack of greed.
Bitcoin Analyze ( BTCUSDT ), 4-hour time frame ⏰.
Do not forget to put Stop loss for your positions (For every position you want to open).
Please follow your strategy; this is just my Idea, and I will gladly see your ideas in this post.
Please do not forget the ✅' like '✅ button 🙏😊 & Share it with your friends; thanks, and Trade safe.

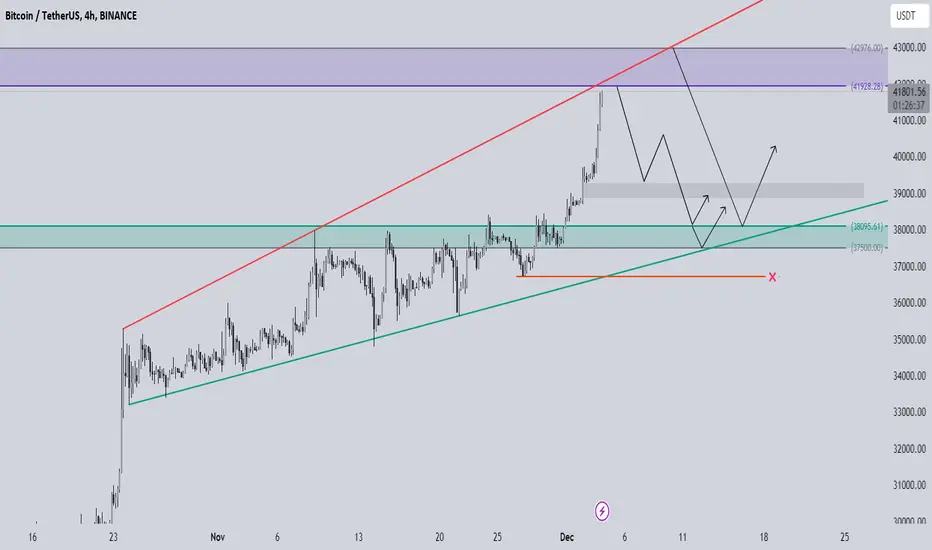
Btc 40 Or 34k? Btc/usdt
Bitcoin is currently trading around 38.1k, moving within a rising wedge on the 4-hour time frame. Possible scenarios include a potential rejection upon testing the upper resistance line of the rising wedge, leading the price towards the support line within the pattern. Alternatively, if the price surges and breaks above the upper resistance line, the pattern would be invalidated. Stay tuned for more updates.
Disclaimer: This information is provided solely as an idea and not intended as financial advice. It's advisable to conduct your own research before making any investment decisions.

BTCUSDT Potential Next Targets!!BTCUSDT (4h Chart) Technical analysis
BTCUSDT (4h Chart) Currently trading at $37000
Buy level: Above $36800
Stop loss: Below $34500
TP1: $39000
TP2: $42000
TP3: $45000
TP4: $48000
Max Leverage 3x
Always keep Stop loss
Follow Our Tradingview Account for More Technical Analysis Updates, | Like, Share and Comment Your thoughts

BTCUSDTDear Traders,
btcusd has been bullish ever since it dropped to 15000 area from where price just skyrocketed. This sudden jumped in price is due to economic side where investors are more keen in investing in crypto assets than in stock markets or DXY itself. The war conflict also influenced btcusd.
If you like our work then please do consider liking the idea and comment your views.
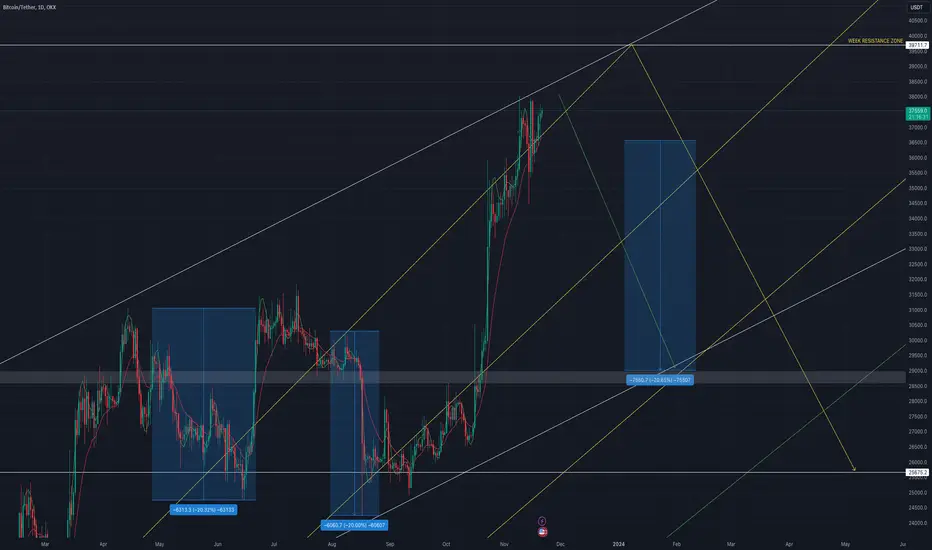
BTCUSDT Cont. Dip to $29k levelsBTCUSDT has been following the weekly resistance.
Anticipating a dip all the way to next support - 29k levels, before a pump to breaking weekly resistance zone.
BTCUSD LONGwe caught am impressive long trade at BTCUSD, As market is still in the long term trade, wait for the price to come to the demand zone to enter long.
Happy Trading