MARKET TECHNICAL BREAK DOWN FOR 16TH TO 20TH JUNE📊 Market Technical Breakdown – EURUSD, AUDUSD, XAUUSD & BTCUSDT 🔍
Traders,
Get ready for this week’s precision-driven analysis across four major markets:
✅ EURUSD – Is the euro gaining strength or facing more downside?
✅ AUDUSD – Key zones to watch as the Aussie reacts to USD data.
✅ XAUUSD (Gold) – Will gold hold strong or give in to bearish pressure?
✅ BTCUSDT – Bitcoin’s momentum shift: Are bulls still in control?
This breakdown covers:
🔹 Clean chart analysis
🔹 Key levels (support & resistance)
🔹 Trade ideas with potential entries & exits
🔹 My personal trading insight for each pair
🎯 Whether you're a beginner or a seasoned trader, this breakdown will help sharpen your bias and build confidence in your trades.
👉 Watch the video till the end to catch all setups, confirmations, and bonus tips for the week.
Drop a comment if you found it helpful or want to see a pair included in the next breakdown!
Btcusdtrade

Middle East Tensions Drive Capital Shift: BTC May Test 100K SupCurrently, we can clearly see that BTC is in a downward trend 🔻. Due to the tense situation in the Middle East 😰, a large amount of capital has flowed into gold and crude oil markets. BTCUSD is likely to continue its downward movement on Monday ⬇️. Let's focus on the support level at 100,000. If it breaks below 100,000, it may continue to decline ⚠️.
⚡️⚡️⚡️ BTCUSD ⚡️⚡️⚡️
🚀 Sell@ 106500 - 105500
🚀 TP 102000 - 101000
Accurate signals are updated every day 📈 If you encounter any problems during trading, these signals can serve as your reliable guide 🧭 Feel free to refer to them! I sincerely hope they'll be of great help to you 🌟 👇
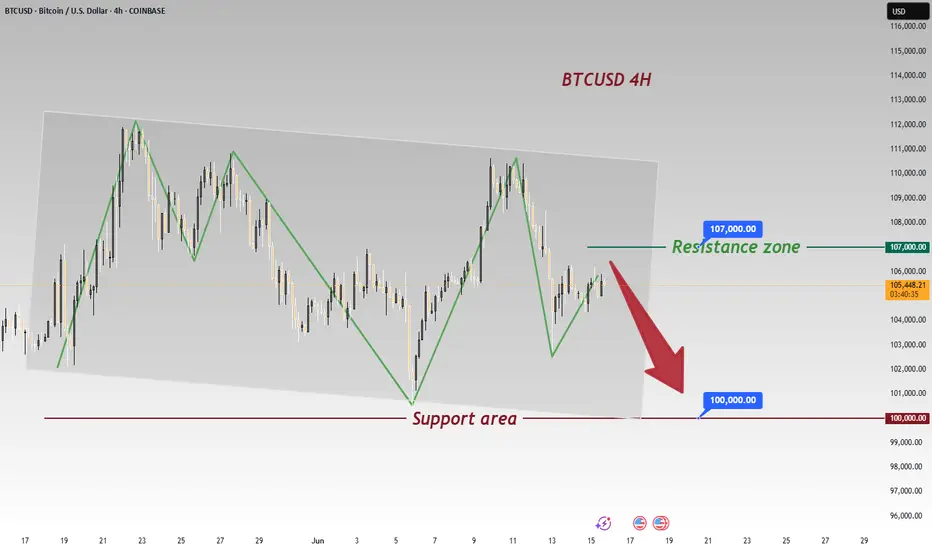
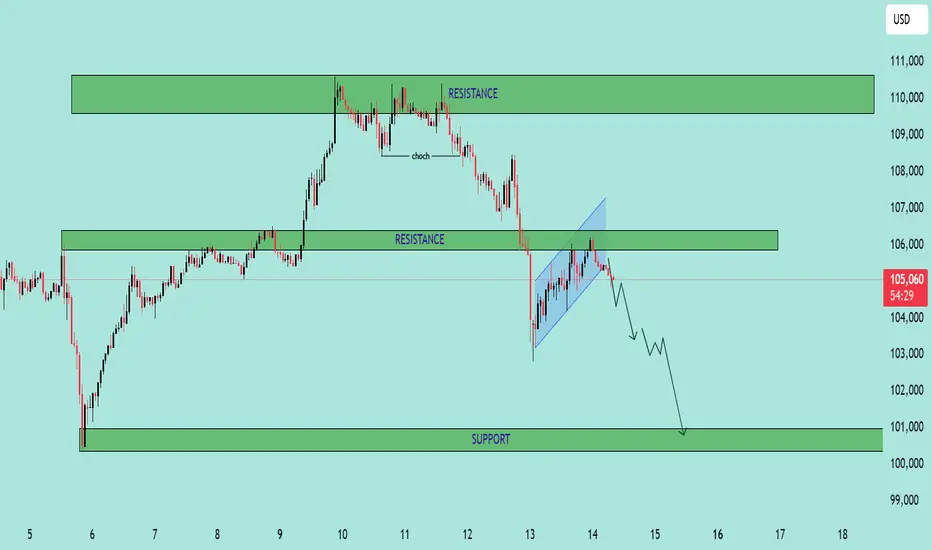
BTC/USD – Bearish Continuation from Rising Channel BTC/USD – Bearish Continuation from Rising Channel 🚨🧱
This chart indicates a bearish market structure with the following key technical features:
🔍 Chart Analysis:
Change of Character (CHoCH) 🔄
A shift from bullish to bearish was confirmed by a strong breakdown after the CHoCH marked at the top.
This breakdown invalidated previous bullish structure.
Bearish Flag Formation 📉📐
After the impulsive drop, price formed a bearish flag (rising channel), suggesting a potential continuation move to the downside.
Resistance Rejection 🚫
Price is currently testing and rejecting the 105,800–106,500 resistance zone, previously a support turned resistance.
The rejection from this level adds further bearish confluence.
Downside Projection ⬇️📍
If the pattern plays out, the projected move shows a potential drop toward the major support zone at 100,000–101,000.
📌 Key Levels:
Resistance Zones:
105,800–106,500 🧱
109,500–111,000 🧱
Support Zone:
100,000–101,000 💚
🧠 Conclusion:
The chart suggests that BTC/USD is in a bearish continuation phase, with strong rejection from key resistance and a confirmed breakdown from a bearish flag. Traders should watch for confirmation of continuation below 104,500 to target the 100k support level. Risk management is crucial near volatile zones.
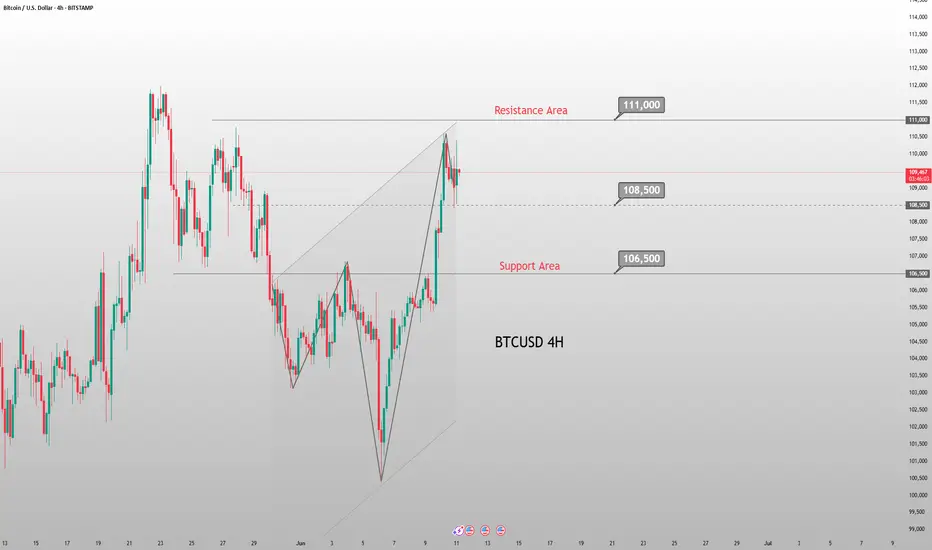
Evening BTC Trend Analysis and Trading RecommendationsDuring the morning session, the Bitcoin price continued its upward momentum from the previous night, surging to an intraday high of 110,653. Subsequently, as bullish momentum gradually waned, the price entered a volatile downward channel. Consecutive bearish candles triggered a significant retracement of earlier gains. In the afternoon, supported by the hourly moving average, Bitcoin saw a brief rebound, climbing to 109,852 as U.S. stocks opened. However, bears quickly regained control, pushing the price down to 108,282 before stabilizing, after which it entered horizontal consolidation. The current price remains around 109,000. Notably, our previous short strategy at 109,800 precisely aligned with the trend, successfully realizing the expected profit.
Current trading advice: Consider light short positions within 109,400–109,700, targeting around 108,500. If the price effectively holds support and stabilizes at 108,500, you may attempt light long positions to speculate on a rebound.
BTCUSD
sell@109400-109700
tp:108500-107500
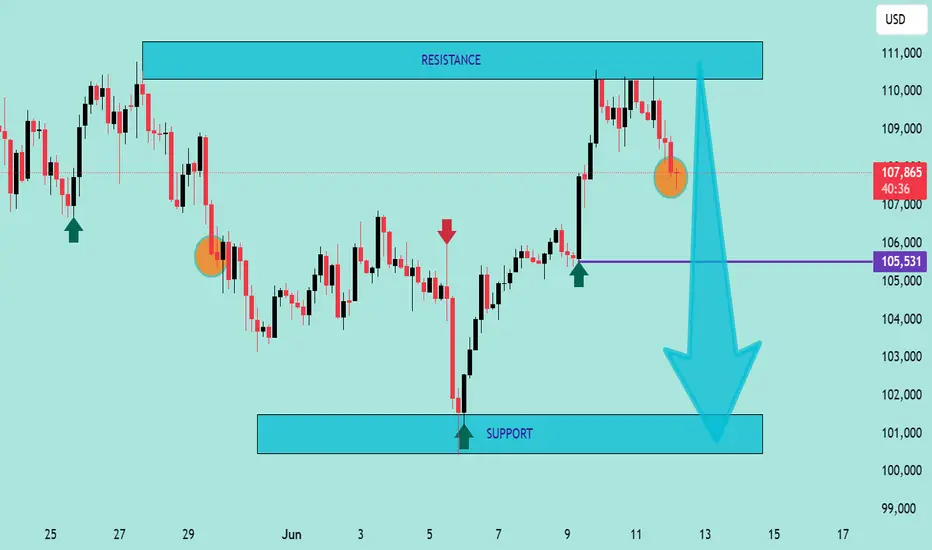
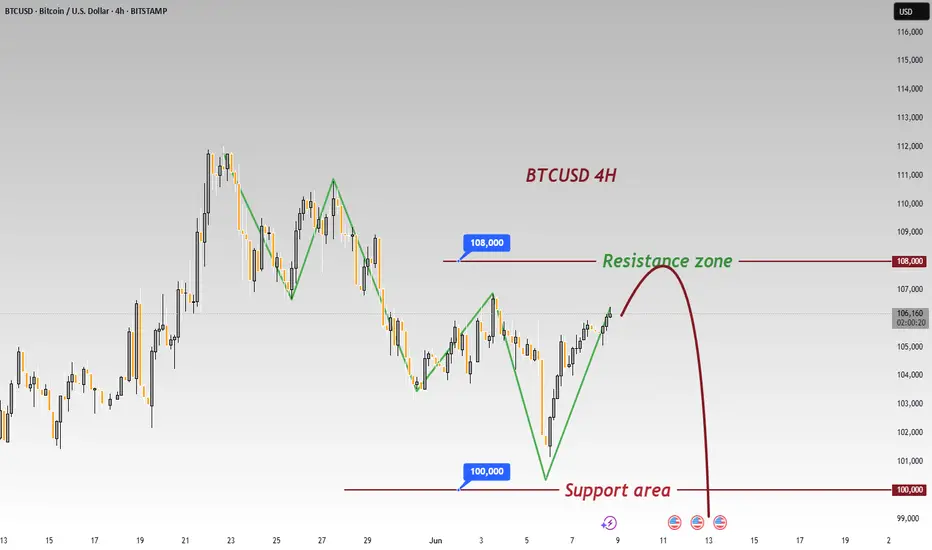
BTC/USD Technical Outlook – Potential Bearish Continuation BelowBTC/USD Technical Outlook – Potential Bearish Continuation Below Resistance 📉🧊
Chart Overview:
The chart illustrates a clear bearish rejection from a major resistance zone (⚠️ 110,000–111,000 USD), followed by the emergence of a bearish engulfing candle 🔻 marked in orange. This move suggests selling pressure has returned after a short-term bullish rally.
Key Zones & Levels:
🔵 Resistance Zone: 110,000–111,000 USD
Price was rejected from this region with a strong bearish reaction.
🟣 Mid-level Support: 105,531 USD
Currently acting as an interim level — if broken, it may lead to deeper declines.
🔵 Support Zone: 100,500–101,500 USD
This is the next strong demand area — price previously rebounded strongly from here.
Technical Signals:
✅ Double Top Structure formation at the resistance zone, indicating trend exhaustion.
❌ Bearish Engulfing Candle near resistance, confirming reversal strength.
📉 Downward Momentum Arrow suggests possible continuation toward support.
🔻 Lower Highs Formation reinforces bearish sentiment after failed breakout attempts.
Projection 🎯:
If the price closes below 105,531, a bearish continuation is likely, targeting the support zone at 101,000–100,500.
Conversely, a strong bounce above this level could delay the drop, but upside is capped below 110,000 unless a breakout occurs.
Summary:
🧭 Bias: Bearish below 105,531
📍 Targets:
Immediate: 105,531 (key level)
Bearish Target: 101,000
Invalidated if: price reclaims and closes above 110,000 with strength
📊 Trader's Note: Look for confirmation of breakdown with volume or candle close before short entry. Set tight risk management due to volatility.
btc updateentry price 109416
stop loss 110500
take profit
107800
103800
result 1 target and risk free
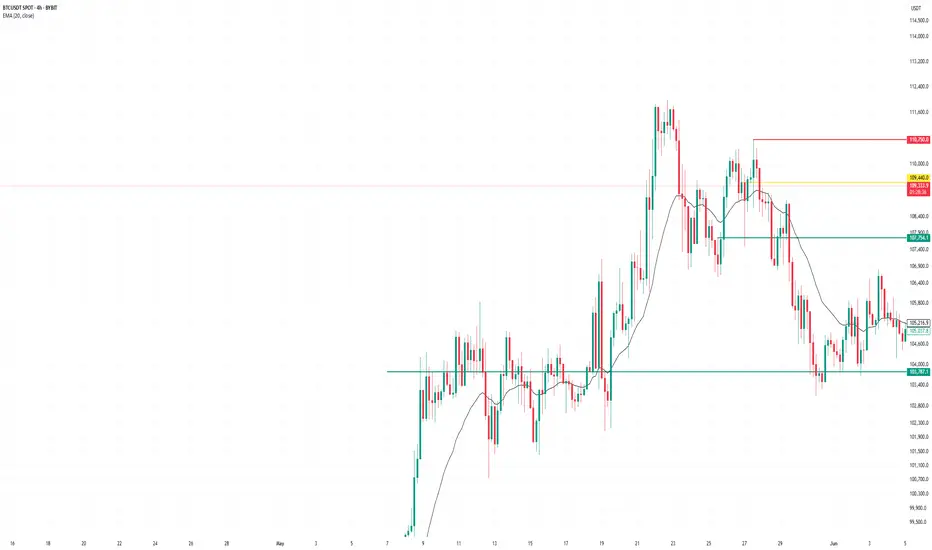
Technical Analysis – BTC/USD Technical Analysis – BTC/USD
📅 Date: June 11, 2025
🔍 Key Observations:
🔴 Resistance Zone – $110,000 to $111,800
Price has tested this resistance block twice (🔴 red arrows) and rejected both times, indicating strong selling pressure in this zone.
Rejection candles show long upper wicks, suggesting failed attempts by bulls to break above.
🟢 Support Zone – $101,800 to $103,500
This demand zone has been respected multiple times (🟢 green arrows), showing a solid base for potential bounces.
Price action previously rallied strongly after touching this level.
📦 Supply to Demand Play
Price made a sharp bullish move from support to resistance (📘 blue box shows the impulsive move).
After reaching resistance, the price is failing to break above, indicating possible exhaustion of bullish momentum.
📉 Potential Move:
🔽 Short-Term Bearish Bias
If price fails to hold current levels and breaks below the small consolidation (after blue box), we may see a drop to ~$105,583 (🔵 purple line = key level).
If that breaks, next likely destination is the support zone around $102,000 (⬇️ downward arrow path).
⚠️ Risk Notes:
🔁 Watch for any false breakouts or liquidity grabs above resistance.
📉 If bearish momentum increases below $105,583, sellers may take control in the short term.
✅ Trade Idea (Hypothetical):
Sell/Short near resistance (⚠️ confirmation needed like bearish engulfing or failed breakout)
Target 1: $105,583
Target 2: $102,000 zone
Stop-loss: Above $111,800 (invalidates setup)
📌 Summary:
BTC/USD is currently stuck between a well-defined resistance and support range. Unless bulls break above $111,800 with strong momentum, the structure favors a potential pullback toward the demand zone. ⚖️

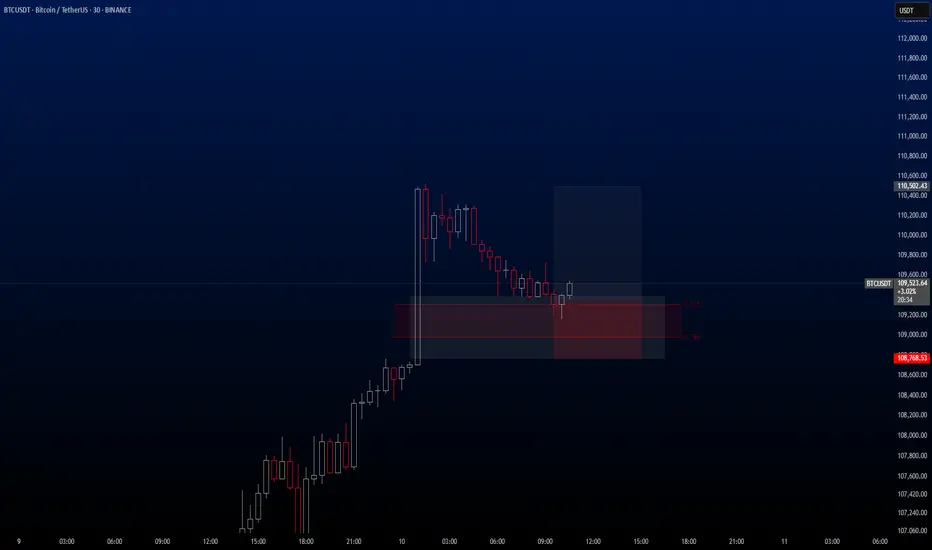
BTCUSDT Hello traders. I’ve spotted an ideal entry opportunity on the BTCUSDT pair. I’ve taken the trade and wanted to share it with you as well.
🔍 Trade Details
✔️ Timeframe: 15-Minute
✔️ Risk-to-Reward Ratio: 1:2
✔️ Trade Direction: Buy
✔️ Entry Price: 109,357.89
✔️ Take Profit: 110,502.43
✔️ Stop Loss: 108,768.53
🔔 Disclaimer: This is not financial advice. I’m simply sharing a trade I’ve taken based on my personal trading system, strictly for educational and illustrative purposes.
📌 Interested in a systematic, data-driven trading approach?
💡 Follow the page and turn on notifications to stay updated on future trade setups and advanced market insights.
BTC Bears Eye 100000 Break; Short at 107000 -108000 ResistanceBTC's downward movement failed to break through 100,000📉, but there is a clear downward trend, and breaking below 100,000 is only a matter of time⏳. In the short term, shorting at high levels can be considered📉. The upward resistance currently has difficulty breaking through 110,000🚧, and shorting can now be considered in the resistance range of 107,000-108,000📉
⚡️⚡️⚡️ BTCUSD ⚡️⚡️⚡️
🚀 Sell@ 107000 - 106000
🚀 TP 102000 - 98000
Accurate signals are updated every day 📈 If you encounter any problems during trading, these signals can serve as your reliable guide 🧭 Feel free to refer to them! I sincerely hope they'll be of great help to you 🌟 👇
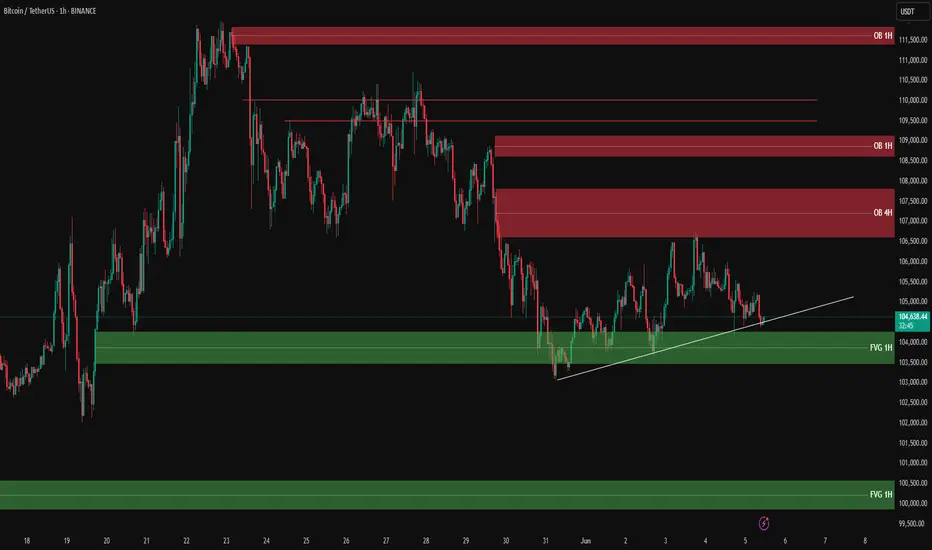
Bitcoin Analysis – Possible Scenarios🟠 Price is consolidating around 104,500, sitting right on the short-term ascending trendline. No clear breakout yet.
🔴 Supply Zones:
1️⃣ OB 1H:📍 107,800 – 108,600📌 Strong rejection zone that led to the current decline.
2️⃣ OB 4H:📍 106,100 – 107,500📌 Key resistance zone – a valid break above may trigger bullish continuation.
3️⃣ Upper OB 1H:📍 110,700 – 111,400📌 Higher resistance to watch in case of strong breakout.
🟢 Demand Zones:
1️⃣ FVG 1H:📍 103,900 – 104,300📌 Price is nearing this imbalance zone – bullish reaction expected if support holds.
2️⃣ Lower FVG 1H:📍 99,900 – 100,700📌 If current support fails, this is the next strong liquidity zone.
📊 Possible Scenarios:
1️⃣ Bounce from current trendline & FVG → move toward OB 4H (buy setup with confirmation)
2️⃣ Break below trendline → deeper pullback into 100K zone
3️⃣ Breakout above OB 4H → target next resistance at 108,600 and above
‼️ Wait for confirmation before jumping in – price action is at a decision point.
🔍 Insight by ProfitaminFX
If this outlook aligns with your bias, or if you see it differently, feel free to share your perspective in the comments. Let’s grow together 📈
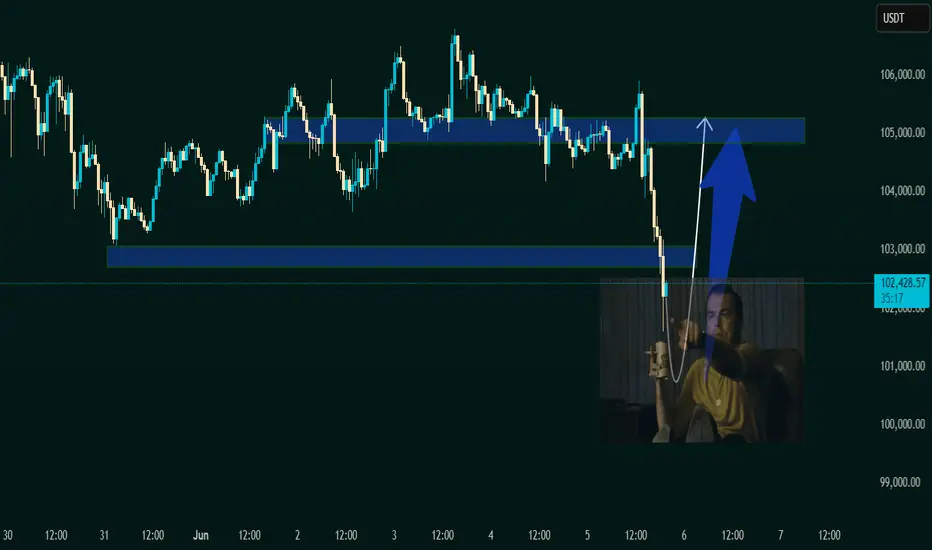
"Caught the Dip – Next Stop: Resistance Zone 1. Current Price Action:
The asset has bounced off the demand zone around 101,500 – 102,000 USDT.
It is now trading at 102,204.56 USDT, indicating early signs of the expected bullish move.
A white curved arrow suggests a rounded bottom pattern, often signaling a bullish reversal.
2. Demand Zone (Support):
Remains the same as the previous chart: 101,500 – 102,500 USDT.
Price reacted exactly at this zone and is starting to move upward.
3. Supply Zone (Target Area):
Clearly marked at 104,800 – 105,500 USDT.
This is where the expected bullish move could face resistance or where traders might look to take profit (TP).
4. Visual Reinforcement:
The large blue arrow indicates strong bullish momentum is anticipated.
The meme (Leonardo DiCaprio pointing) emphasizes that the reversal is happening as previously predicted — likely for motivational or engagement purposes in a VIP group.
---
🧠 Technical Sentiment:
Bullish Bias confirmed: Price bounced exactly from the demand zone.
Momentum Shift is underway, as indicated by the reversal pattern.
A potential "Buy Confirmation" is in play with room to ride up to the 105K resistance zone.
---
🎯 VIP Trade Setup Recap:
Parameter Value
Entry Zone 101,500 – 102,000 USDT
Current Price 102,204.56 USDT
Target (TP) 105,000 – 105,500 USDT
Stop Loss (SL) Below 101,000 USDT
Bias Bullish / Reversal
---
📌 Suggested Title:
"Reversal In Motion – Ride to 105K 🎯🚀"
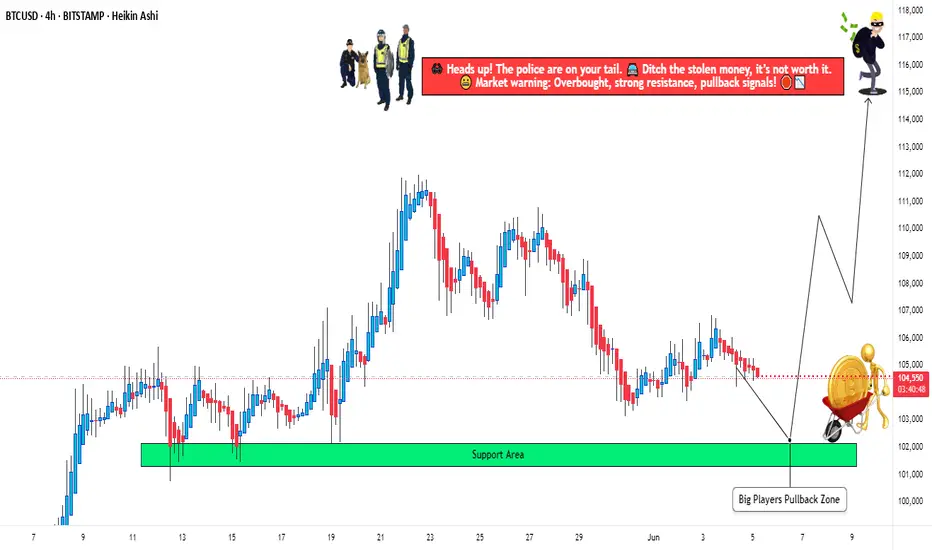
BTC/USD: The Big Player’s Pullback Strategy – Steal Profits!🚨 BITCOIN HEIST ALERT! 🚨 The Ultimate Bullish Raid on BTC/USD (Master Plan Inside)
🌟 Hola! Bonjour! Hallo! Marhaba! Money Makers & Market Robbers! 🤑💸🔥
Based on the 🔥Thief Trading Style🔥 (technical + fundamental analysis), we’re plotting the GREAT BTC/USD HEIST! Time to LONG & escape near the Red Zone—where bears lurk & traps snap shut! Overbought? Risky? Perfect for a slick exit. 🎯 Take profits & treat yourself—you’ve earned it! 💰🏆
🔑 Heist Blueprint:
🎯 Entry: "The raid begins!"
Buy MA Pullback near Big Players’ Zone (102,000)
OR Buy above pullback—bullish momentum = green light! 📈
🛑 Stop Loss:
Thief’s SL = Nearest swing low (or under wick) → 4H candle rules!
Adjust based on risk, lot size & multiple orders.
🏴☠️ Target: 115,000 (Cha-ching! 💵)
⚡ Scalpers’ Quick Strike:
LONG ONLY!
Rich? Strike hard. Not? Join swing robbers!
Trailing SL = Your money’s bodyguard. 🔒
💥 Why BTC/USD?
Bullish fuel pumping! Fundamentals + Macro + COT + On-Chain Data = 📈🚀
👉 Full analysis? Check our bio links! 🔗
⚠️ WARNING: News = Market Chaos!
Avoid new trades during news.
Trailing SL = Profit protector!
💖 Support the Heist!
💥 BOOST THIS IDEA! 💥 Help us steal more profits & grow stronger!
🚀 Daily market heists = Easy money. Stay tuned—next raid coming soon! 🤑🐱👤
btcusd sell signal. Don't forget about stop-loss.
Write in the comments all your questions and instruments analysis of which you want to see.
Friends, push the like button, write a comment, and share with your mates - that would be the best THANK YOU.
P.S. I personally will open entry if the price will show it according to my strategy.
Always make your analysis before a trade

earish trand analysis Read The ChaptianSMC trading point update
Technical analysis of (BTC/USDT) based on the 4-hour timeframe. Here’s a detailed breakdown of the analysis and the idea behind it:
---
Key Components of the Analysis:
1. Resistance Zone (FVG - Fair Value Gap):
The yellow zone marked as “fvg resistance level” indicates an area where price previously dropped quickly, suggesting inefficiency or imbalance in the market.
Price is approaching this zone again, which acts as a strong resistance.
2. Trendline & Lower Highs:
A descending trendline (with red arrows) shows consistent lower highs, indicating ongoing bearish pressure.
Each rejection from the trendline reinforces sellers’ dominance.
3. CHOCH (Change of Character):
The label “choch” signifies a market structure break, where bullish structure turned bearish.
This marks the transition to a downtrend.
4. EMA 200 (Exponential Moving Average):
The EMA (currently around 102,753) acts as dynamic support.
Price is currently trading above it, but a rejection from the resistance may push it below.
5. Target Zone:
A yellow box near 100,817.99 is labeled “target point”, indicating a possible short-term bearish target if price gets rejected at resistance.
6. RSI (Relative Strength Index):
RSI is around 47.11, slightly below neutral (50), suggesting bearish momentum could be building.
No clear oversold or overbought conditions yet.
---
Trade Idea Summary:
Bias: Bearish
Scenario:
If price reaches the resistance zone (~106,800–107,500) and fails to break above, a sell-off is expected.
First target: 100,800–101,000 zone
Price may also dip below EMA 200 confirming bearish strength.
Confirmation:
Rejection candle or bearish engulfing pattern near resistance.
RSI staying below 50 and starting to dip.
Invalidation:
Clean breakout and close above the resistance zone and trendline (~108,000+).
Mr SMC Trading point
---
Conclusion:
This chart sets up a high-probability short trade around the resistance area, leveraging both structural and momentum indicators. It suggests waiting for confirmation of rejection before entering, targeting the previous support and imbalance zone below.
Pales support boost 🚀 analysis follow)

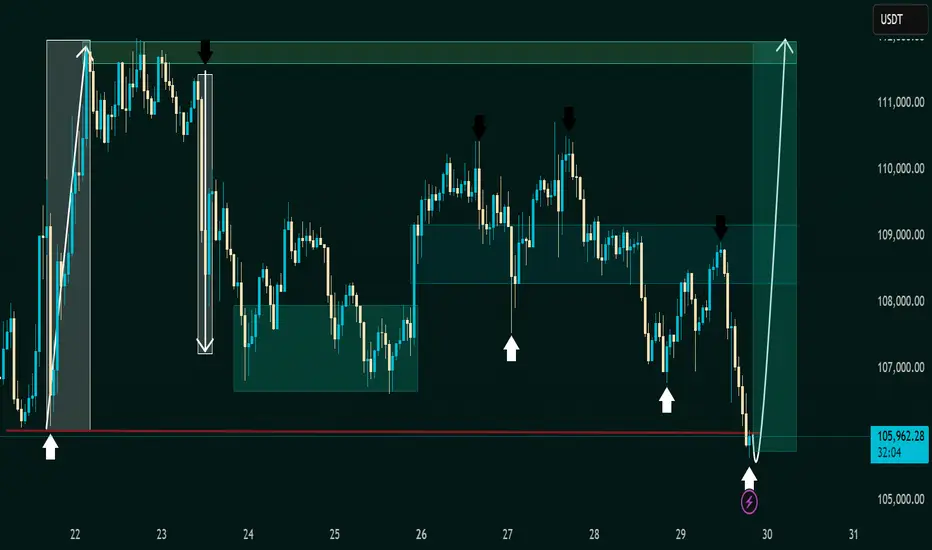
BTC/USDT – Bitcoin 1 hour timeframe 📊 Technical Overview
🟢 Support Zone:
📌 Around $105,700
🛡 Marked by multiple bounces (white arrows), this zone shows strong buyer interest.
🔁 Historically acts as a springboard for upside moves 📈.
🔴 Resistance Zone:
📌 Range: $109,000 – $111,500
🚫 Every approach has triggered a sharp sell-off (black arrows), confirming this zone as significant supply.
🔄 Price Action & Pattern Insights
📉 Bearish Swings from Resistance:
Several high-wick candles followed by strong rejections ⛔
Downward arrows suggest a distribution phase near the top range
📈 Bullish Reversal Signals:
Price sharply rebounds from support 💥
V-shaped recovery setup in motion with a clean reaction from the demand zone ✅
Arrow projection hints at a potential full range recovery 🌈
📦 Box Range Formation:
Market has been consolidating in horizontal zones
Each zone acts as a base for accumulation or distribution 🧭
🎯 Trade Idea & Forecast
📍 Current Price: $105,793.35
📈 Projected Move: Upside rally toward $111,000+
🧠 Rationale:
Bounce from a major support zone
Prior similar price actions led to parabolic rises 🚀
No lower lows made – signs of a bottom forming 🪙
📌 Action Plan
✅ Long Setup:
Entry: Above $106,000
Target: $109,000 – $111,500
Stop Loss: Below $105,000
📉 Risk/Reward: Favorable (~1:3)
🚫 Bearish Alternative:
Breakdown below $105,000 with volume ❗
Target: $103,000 (next liquidity zone)
📎 Conclusion: Ready for a Bullish Comeback?
Bitcoin (BTC/USDT) is showing signs of a textbook bullish reversal 📘 after defending a key demand level 💪. If the current momentum holds, we could see a swift move back to the top of the range. Ideal for short-term buyers looking to ride the intraday wave 🌊.
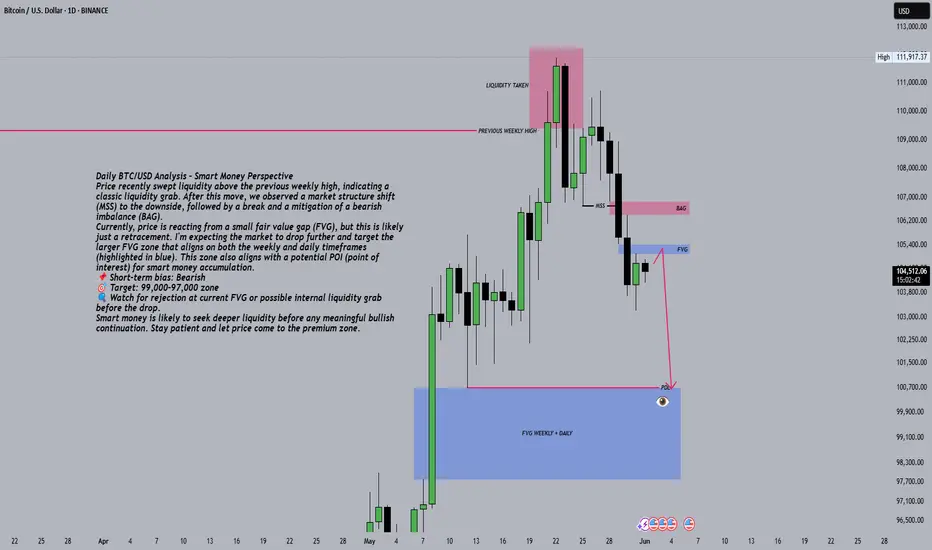
Daily BTC/USD Analysis - Smart Money PerspectivePrice recently swept liquidity above the previous weekly high, indicating a classic liquidity grab. After this move, we observed a market structure shift (MSS) to the downside, followed by a break and a mitigation of a bearish imbalance (BAG).
Currently, price is reacting from a small fair value gap (FVG), but this is likely just a retracement. I'm expecting the market to drop further and target the larger FVG zone that aligns on both the weekly and daily timeframes (highlighted in blue). This zone also aligns with a potential POI (point of interest) for smart money accumulation.
📌 Short-term bias: Bearish
🎯 Target: 99,000–97,000 zone
🔍 Watch for rejection at current FVG or possible internal liquidity grab before the drop.
Smart money is likely to seek deeper liquidity before any meaningful bullish continuation. Stay patient and let price come to the premium zone.
Bitcoin - Ready to go but from lowerAfter breaking out of the marked range, Bitcoin retested the level but is now showing weakness in bullish momentum.
Although the price has broken above the high that created the last lower low, it did so without strong momentum, and is now pulling back.
🔍 We are watching the highlighted zones for potential bullish reactions.
In these areas, we will look for a confirmed long entry trigger.
⚠️ The lower the price drops—especially if it reaches the 4H Fair Value Gap (FVG)—the higher the reward-to-risk ratio for long setups.
Be patient and wait for confirmation before entering. ✅
🔍 Insight by ProfitaminFX
If this outlook aligns with your bias, or if you see it differently, feel free to share your perspective in the comments. Let’s grow together 📈

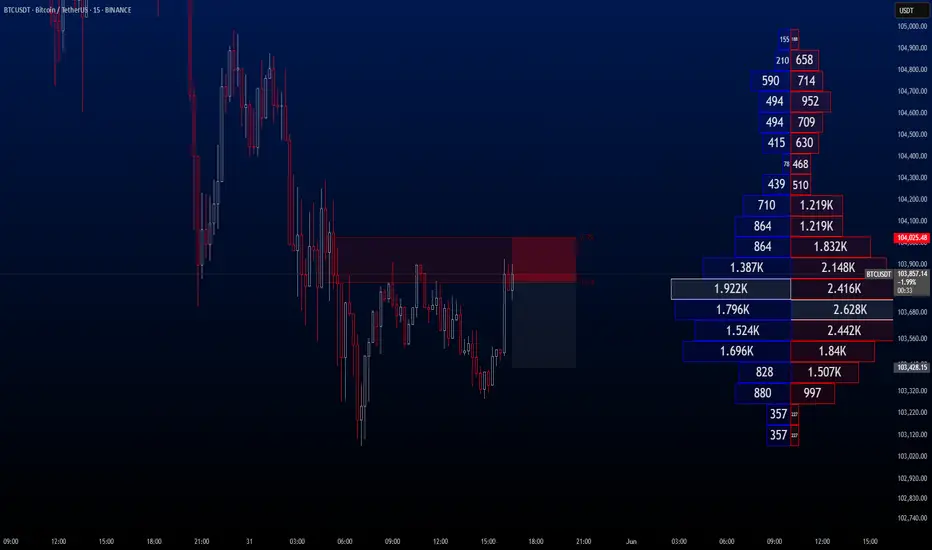
BTCUSDT Hello traders, wishing everyone a great weekend!
I’ve identified a sell opportunity on BTCUSDT and decided to share it with you as well.
🔍 Trade Details:
✔️ Timeframe: 15-Minute
✔️ Risk-to-Reward Ratio: 1:2 / 1:4
✔️ Trade Direction: Sell
✔️ Entry Price: 103,826.28
✔️ Take Profit: 103,428.15
✔️ Stop Loss: 104,025.48
🔔 Disclaimer: This is not financial advice. I’m simply sharing a trade I’ve taken based on my personal trading system, strictly for educational and illustrative purposes.
📌 Interested in a systematic, data-driven trading approach?
💡 Follow the page and turn on notifications to stay informed about upcoming trade ideas and advanced market insights.
BTCUSDT Hello everyone. I’ve spotted a sell opportunity on BTCUSDT and have already activated the trade. I wanted to share the same setup with you as well.
🔍 Trade Details:
✔️ Timeframe: 15-Minute
✔️ Risk-to-Reward Ratio: 1:1 / 1:1.50
✔️ Trade Direction: Sell
✔️ Entry Price: 106155.39
✔️ Take Profit: 105560.48
✔️ Stop Loss: 106550.09
🔔 Disclaimer: This is not financial advice. I’m simply sharing a trade I’ve taken based on my personal trading system, strictly for educational and illustrative purposes.
📌 Interested in a systematic, data-driven trading approach?
💡 Follow the page and turn on notifications to stay updated on future trade setups and advanced market insights.

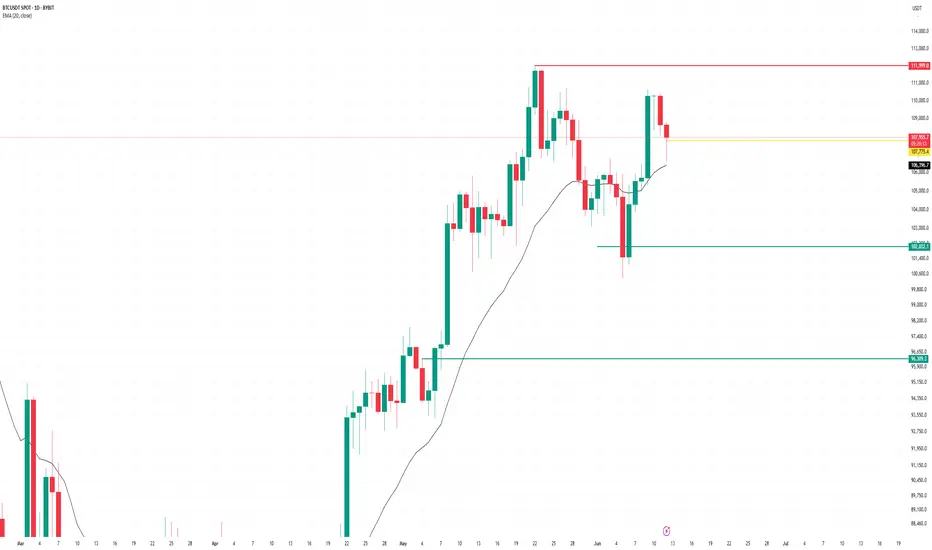
BTCUSDT 4H AnalysisBTC ~ 4H Analysis
#BTC On the 4H Time frame Bitcoin is retesting this multi support level. Let's see how far this support can hold.
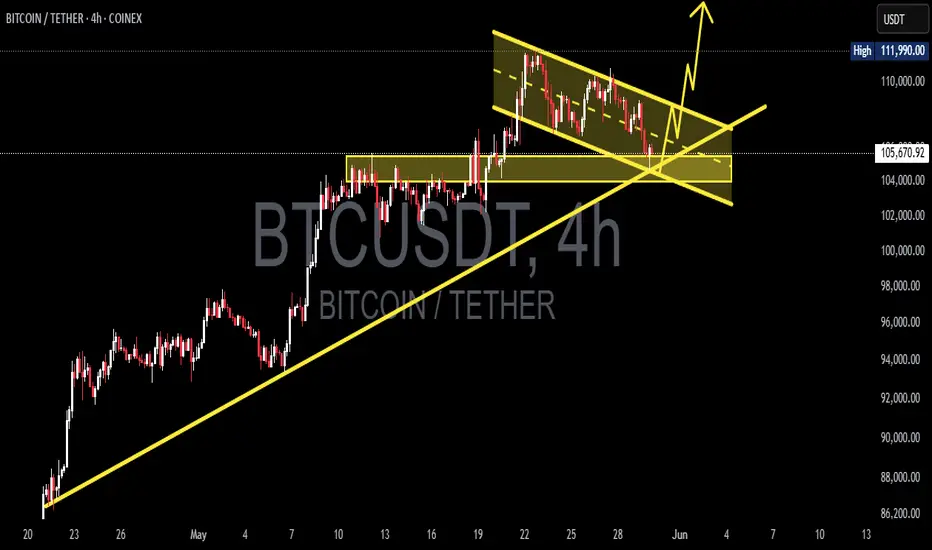
BTC/USD) Make some trand analysis Read The ChaptianSMC trading point update
Technical analysis of Bitcoin (BTC) against USDT on a 4-hour timeframe using key price action concepts. Here's a breakdown of the idea conveyed:
Key Elements in the Chart:
1. Support and Resistance Zones:
Support Level (Yellow Boxes): Indicate areas where buying interest is strong enough to prevent the price from falling further.
Resistance Level: Zones where selling interest is strong enough to halt upward price movement.
These zones have been respected multiple times and serve as potential trade entry or exit points.
2. Breakout Strategy:
The chart highlights breakout points (black circles) above resistance zones, signaling strong bullish momentum.
After breaking resistance, price typically retests the zone as new support before moving higher—this is a classic breakout and retest structure.
3. Target Projection:
The vertical lines represent measured move projections, likely using the height of the prior consolidation range to estimate the next move.
The target point is marked around $112,559.59, indicating a bullish target following the breakout.
4. 200 EMA (Exponential Moving Average):
The 200 EMA at $96,827.38 acts as dynamic support, showing the overall bullish trend is intact.
5. RSI (Relative Strength Index):
RSI values (54.97 and 52.87) suggest neither overbought nor oversold conditions, implying room for further upside.
Mr SMC Trading point
---
Conclusion:
The analysis suggests a bullish continuation setup:
BTC has broken out from a consolidation range.
Retesting previous resistance as support.
The bullish target is $112,559.59 based on the breakout projection.
The trend remains bullish as long as price stays above the support zone and 200 EMA.
Pales support boost 🚀 analysis follow)

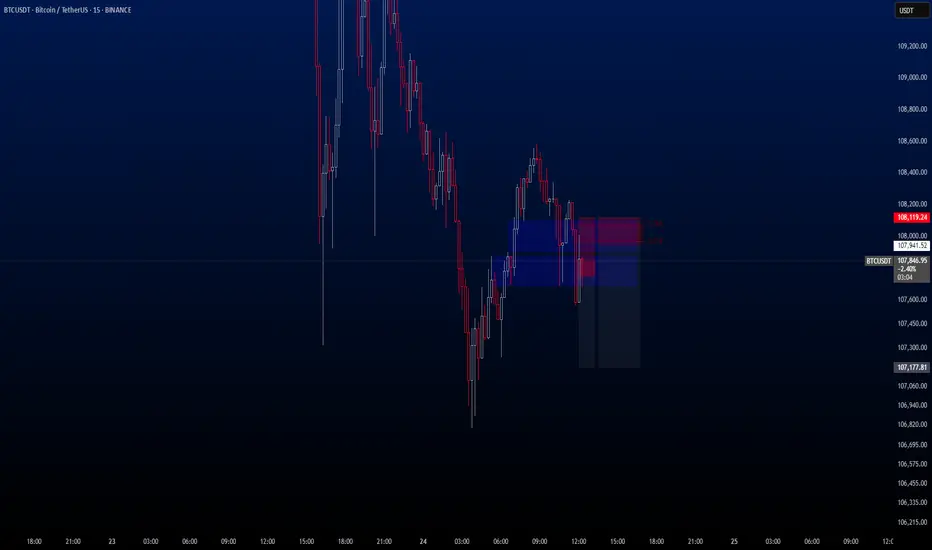
BTCUSDTHello Traders,
Despite it being the weekend, I’ve identified a short trade opportunity on BTCUSDT. The trade is currently active on my end, and anyone interested is welcome to consider entering as well.
🔍 Trade Details:
✔️ Timeframe: 15-Minute
✔️ Risk-to-Reward Ratio: 1:2 / 1:4
✔️ Trade Direction: Sell
✔️ Entry Price: 107,743.42
✔️ Take Profit: 107,181.56
✔️ Stop Loss: 108,119.24
🔔 Disclaimer: This is not financial advice. I’m simply sharing a trade I’ve taken based on my personal trading system, strictly for educational and illustrative purposes.
📌 Interested in a systematic, data-driven trading approach?
💡 Follow the page and turn on notifications to stay informed about upcoming trade ideas and advanced market insights.