TOTAL MARKET CAP IMPORTANT UPDATE MUST READ!!Hi guys, This is CryptoMojo, One of the most active trading view authors and fastest-growing communities.
Consider following me for the latest updates and Long /Short calls on almost every exchange.
I post short mid and long-term trade setups too.
Let’s get to the chart!
I have tried my best to bring the best possible outcome to this chart, Do not consider financial advice.
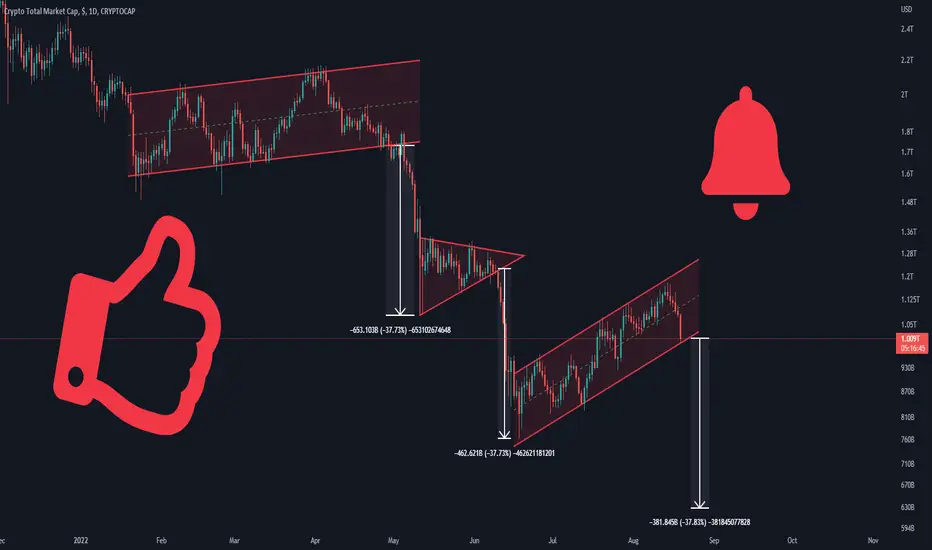
TOTAL MARKET CAP UPDATE
In the last 2022 February, the total market cap made a bearish flag pattern and breakdown this pattern and dropped up to 37%.
In 2022 May Total market cap made a bearish pennant pattern and broke down and dropped up to 37% again
As you can see from the chart or absorb in the chart that now Total market cap again makes this bearish flag pattern but the breakdown is not yet done if it breaks down this pattern we can drop up to 37% again.
This chart is likely to help you make better trade decisions if it does consider upvoting it.
I would also love to know your charts and views in the comment section.
Thank you
Btcusdtsell
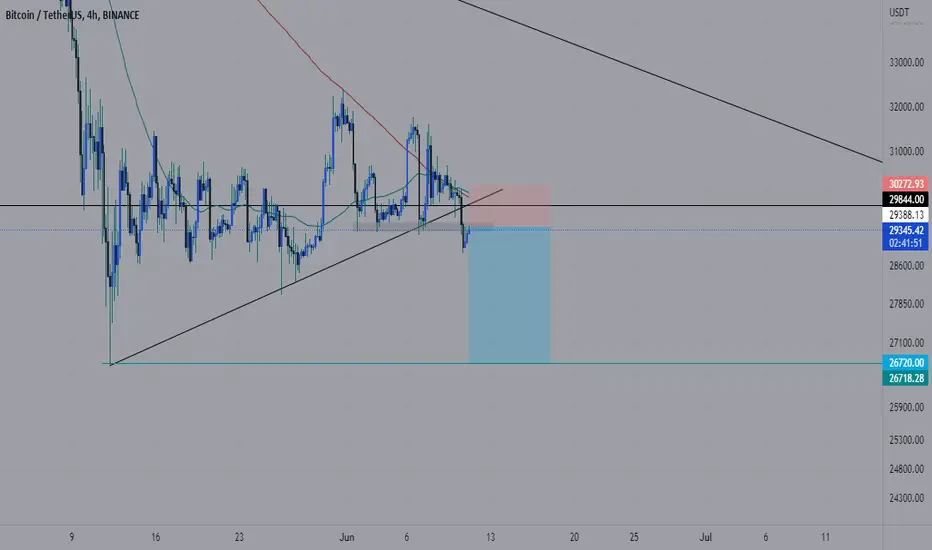
Bitcoin is under pressure.The Bitcoin exchange rate (BTCUSDT) is at the lower limit of the long-term horizontal range, which took shape after reaching a minimum of 26700 on 12.05.2022.
On the H4 chart, the consolidation figure after the downward impulse is most clearly visible. The figure resembles a triangle, which from the point of view of classical technical analysis is a continuation figure of the previous momentum. Our trading strategy signals confirm it, pointing to the current bears superiority.
We expect the bitcoins decline to the new minimum and the formation of a bullish divergence on the MACD indicator. After that, growth is possible.
How to trade.
Sell BTCUSDT (open short) with the first target of 26700. The goal of working out the triangle is around 26500.

BTCUSDT Potential Short 1:3 RR Confluences
1. Broke the ($30000) level
2. Broke the counter trendline
3. broke the strong support
TP1 - 28500
TP2 - 26720
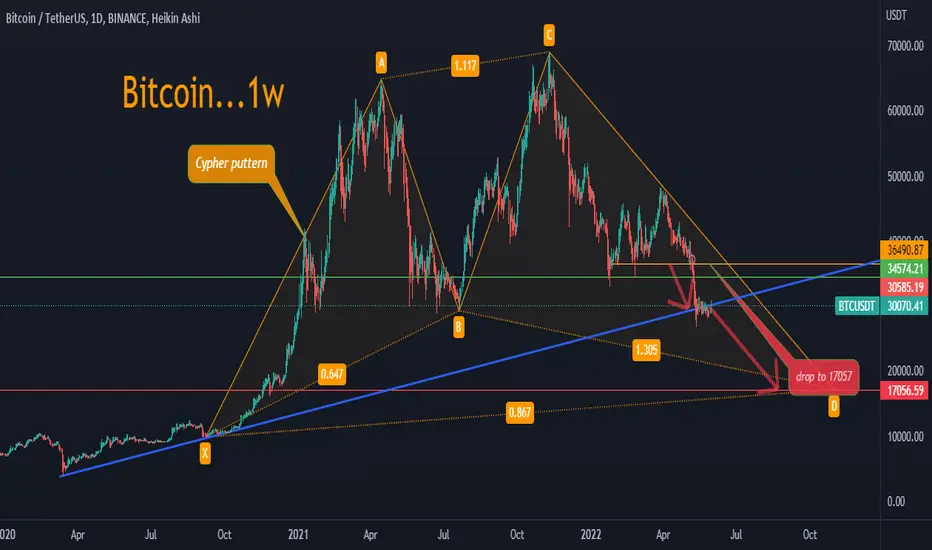
bitusdt......DTechnical analysis of bitcoin on the harmonic strategy
= We've had a Cypher model for a long time
= If the price respects the cypher, it will remain in a state of hypocrisy to complete the cypher's building
BTC/USDT Bounce to Down ... Golden Chance ..,Sell BTC/USTHello freands
It is difficult for Bitcoin to breach this point. 29400 strong retracement points are an opportunity to enter short in a medium term
our order :
Sell BTC/USDT
ST : 29700
TP : you can see the chart 3 tp
GOOD LUCK

BTCUSDT will create the bottom then fly!Hello, everyone!
As you know, bitcoin is now in bearish range, need to pullback. I’m not waiting the huge crash from this range! In technical view BTC try to double bottom in $25.7K range. And then fly to $37K! So ready for ride!
Remember, there is no place for luck in trading - only strategy!
For best result in trading follow these rules for best result!
1. WHAT IS THE OVERALL TREND? PRICE ACTION WILL GIVE YOU CLUE!
2. IS PRICE AT A LEVEL OF SUPPLY OR DEMAND (SUPPORT OR RESISTANCE)?
3. IS PRICE APPROACHING A LEVEL OF SUPPLY OR DEMAND (SUPPORT OR RESISTANCE)?
4. ARE YOU TRADING WITH THE TREND OR AGAINST THE TREND (MAKE SURE YOU ONLY TRADE AGAINST THE TREND ON THE 4HR TIME-FRAME AND ABOVE.
5. AND MUST CHECK THE DIVERGENCE.

Bitcoin Roadmap Chapter 5Bitcoin just reached to 200 daily moving average and also the D point of multiple harmonic patterns ! In these prices we see lots of long analysis after the moving average is violated , but I think this is a good place to take a small short position and reduce a little bit of other open long positions that I have , such as Hbar or Doge , see the analysis in description.
Good Luck !

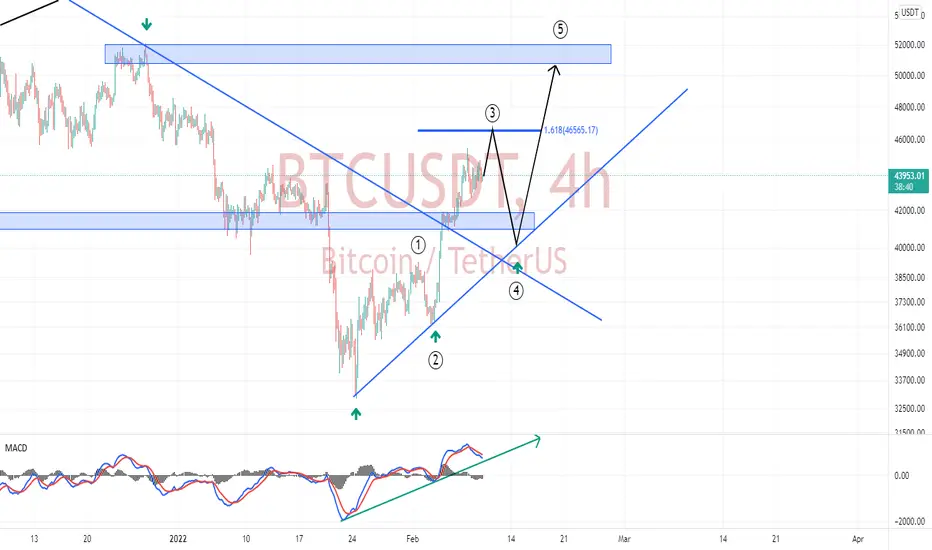
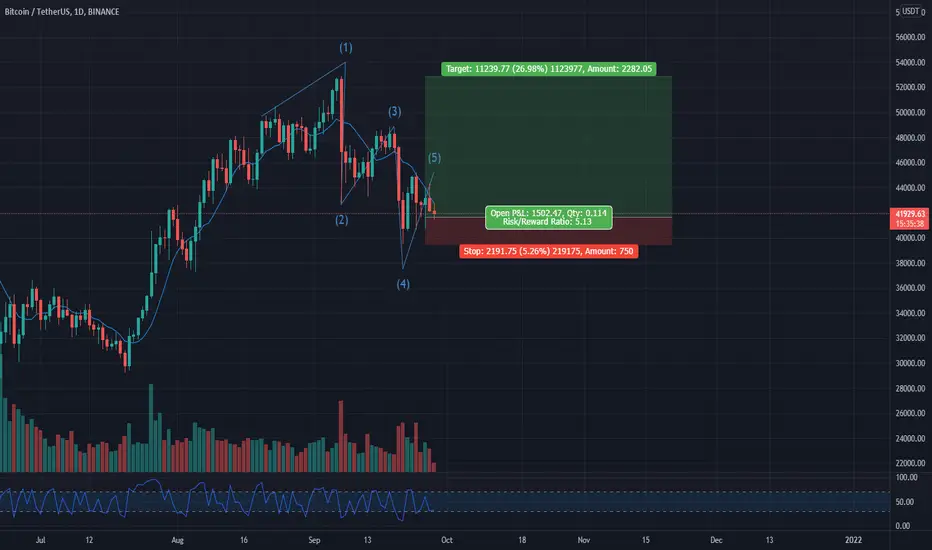
BTCHello traders. The price is on an uptrend and is now in the third stimulus wave and I predict it will rise to the range of 51,000.
Bitcoin 4HrHello traders. +RD is evident in the daily bitcoin time frame. I expect bitcoin to increase after another decline. Be profitable

Btcusdt created bearish flag on 4h Timeframe Posible Breakdown Hello Everyone
Btc Has created bearish flag on 4h chart
struggling to stay above 35k but i think we got a fall toward 32k & lower .
sell pressure if high - Capital outflow is high - volume is low - fear is very high
all this cause a bloody fall in short-term
NOT A COMMERCIAL ADVICE
BE CAREFUL ABOUT YOUR POSITION
ALWAYS CONSIDER SL IN YOUR TRADES

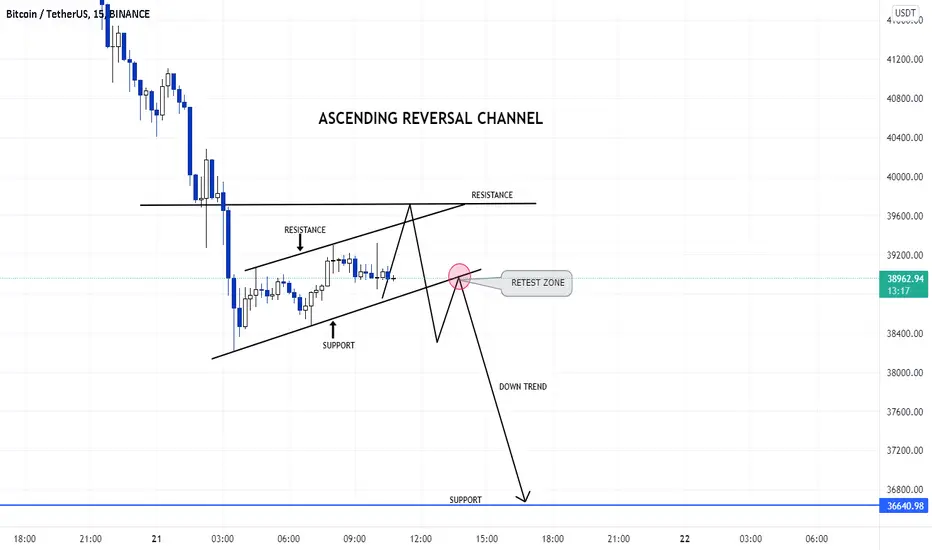
BTCUSDT Ascending Reversal Channel.!#BTCUSDT Hello trader, I hope are good and safe. Today I opened the chart of #BTCUSDT for 15 MIN and analyzed it then I see that this chart has made a ASCENDING REVERSAL CHANNEL, So I hope #BTCUSDT will go downside,
Now Nice opportunity for short.
If you have any query then leave a COMMENT, LIKE and FOLLOW.
Keep Supporting And Thank You..
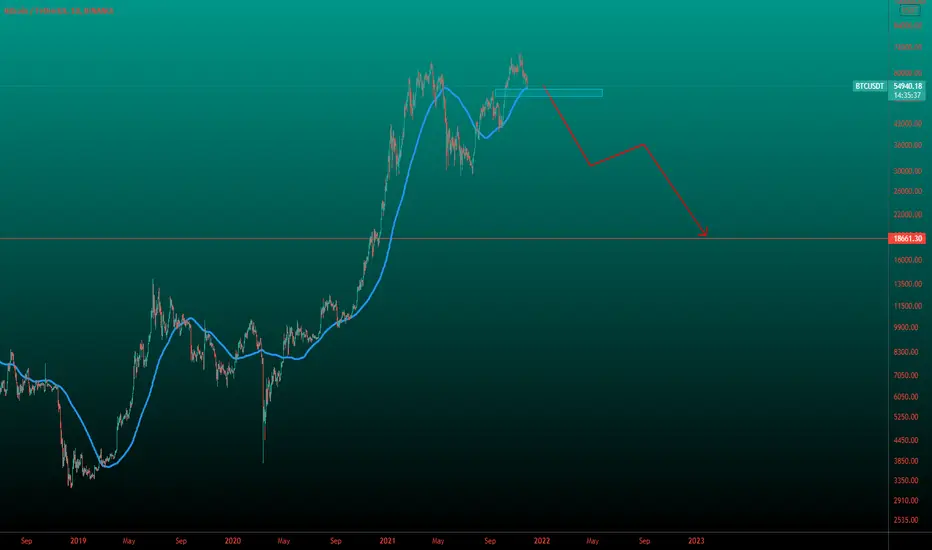
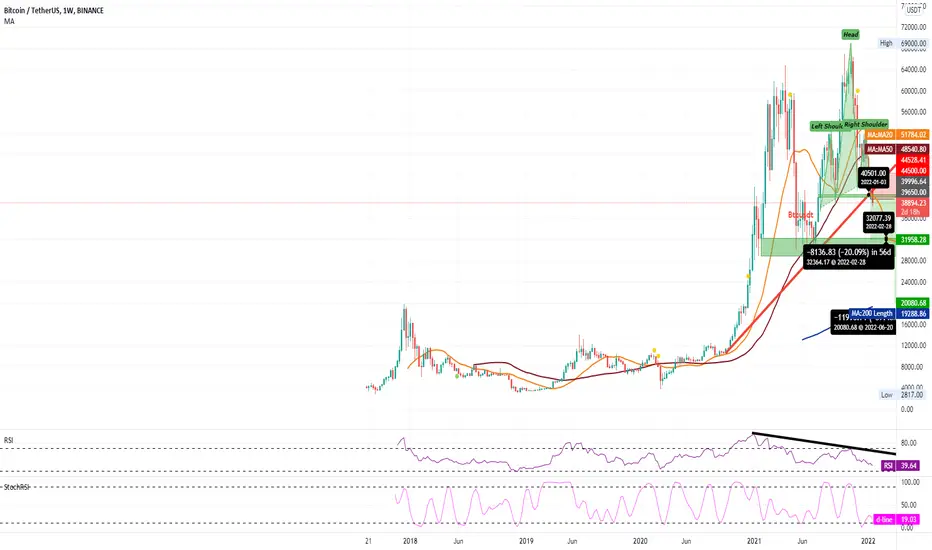
BtcusdtEveryone has been saying buy for months, but we sell because it broke the diagonal support on a weekly basis, pull back was not enough, it breaks the horizontal, so the first target is $32.000/$29.000 band, it will seek buyers from here, but our prediction is that an asset that sells from $ 69.000 to here may not find a buyer here, the reason is $ 4.100. It's only one correction since the non-stop $65,000 band broke out with uncorrected inflation panic buying. For this reason, the $32,000/$29,000 band is an important region below here, the target of the monthly double top and the 78.6 target of the correction, which is $20,000. It will want to go to the /$19,000 band.
This is not investment advice
This idea is a prediction, no one knows the future.
BTCUSDT Bearish Rectangle Pattern.!#BTCUSDT Looking for Sell trade setup as I mentioned in the Chart.!
Keep Supporting LIKE, COMMENT And FOLLOW.!
Thank You.!

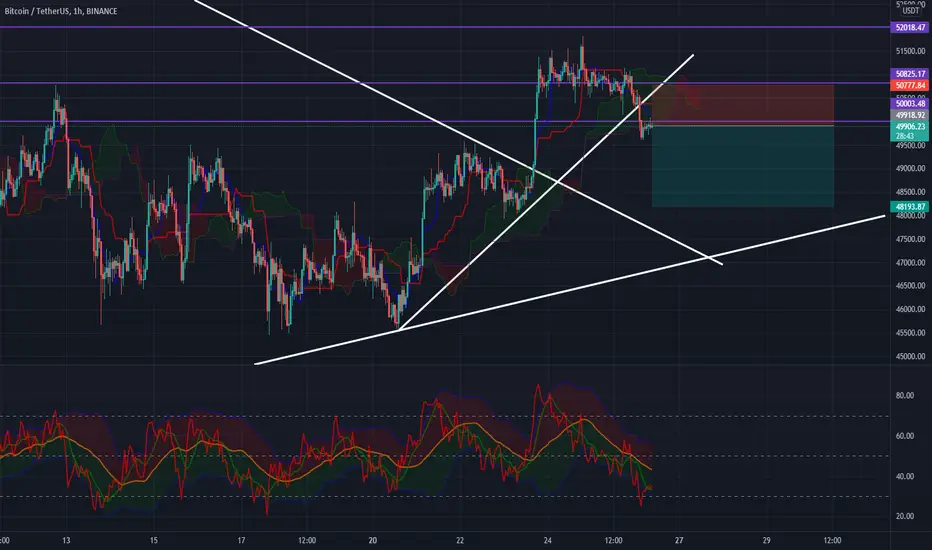
BTC for another leg down?So far we failed to stay above the 50k area, and this one could give a small opportunity to take a short trade. Based on the 4rh and 1hr charts we have a potential H&S pattern forming and plenty of space to fall. And I'm still triggered by that long wick from the 4th of December on the weekly charts because in my opinion that one acting like a "magnet" and we still have a fairly big chance to retest the low levels around 42K area.
I tried to take a long trade on this to push further upwards but seems like momentum is falling and so could BTC visit lower levels. I always take the trade with a minimum RR of 1:2 so I hope this one will be good :)
BTCUSDT ShortBTC/USDT Sell
- Entry : 63300 - 64300
- Target : 55000 - 52500
- SL : 65800
Lets See How Law of Newton Works. - Easy Bulls.
Goodnight

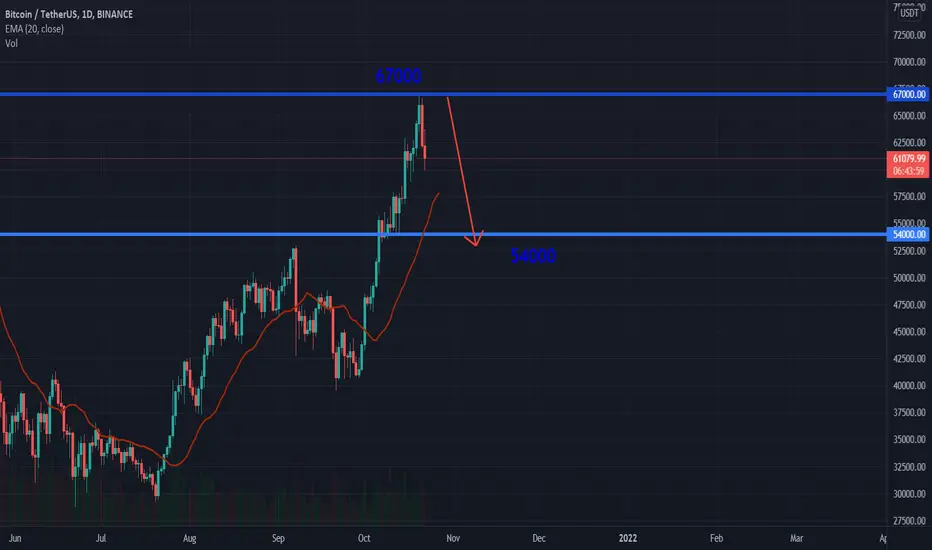
BTCUSDT 1D: Possible SHORTFollowing the rebound from level 67000, there may be a fall to the support level of 54000
BTCUSDT In my opinion, This symbol is in a daily uptrend channel and is expected to continue its uptrend.
BTCUSDT Daily TimeframeSNIPER STRATEGY
It works ALMOST ON ANY CHART but the BEST CHARTS are stocks then other charts.
It produces Weak, Medium and Strong signals based on consisting elements.
NOT ALL TARGETS CAN BE ACHIEVED, let's make that clear.
TARGETS ARE STRONG SUPPORT AND RESISTANCE LEVELS, so have this point in mind.
IT CAN NOT PREDICT pullbacks or bounce backs of the price, so I strongly warn you:
DO NOT USE THIS STROTEGY FOR LEVERAGED TRADING, IT CAN MAKES YOU LIQUID EASILY.
Does it make FALSE SIGNALS?
Like any other strategy out there yes it can but the actual WIN RATE is really high and pretty impressive and it is obvious that weak signals are more likely to be false but even weak signals have really good win rates.
It will not give you the whole wave like any other strategy out there but it will give you huge part of the wave.
The BEST TIMEFRAMES for this strategy are Daily, Weekly and Monthly however it can work on any timeframe above three minutes.
Consider those points and you will have a huge advantage in the market.
There is a lot more about this strategy.
It can predict and also it can give you almost exact buy or sell time on the spot.
I am developing it even more so stay tuned and start to follow me for more signals and forecasts.
START BELIEVING AND GOOD LUCK
HADIMOZAYAN

BTCUSDT start correctionBTCUSDT start correction!
Accuracy 95%
1. Rising Wages.
2. Hidden Bearish Divergence

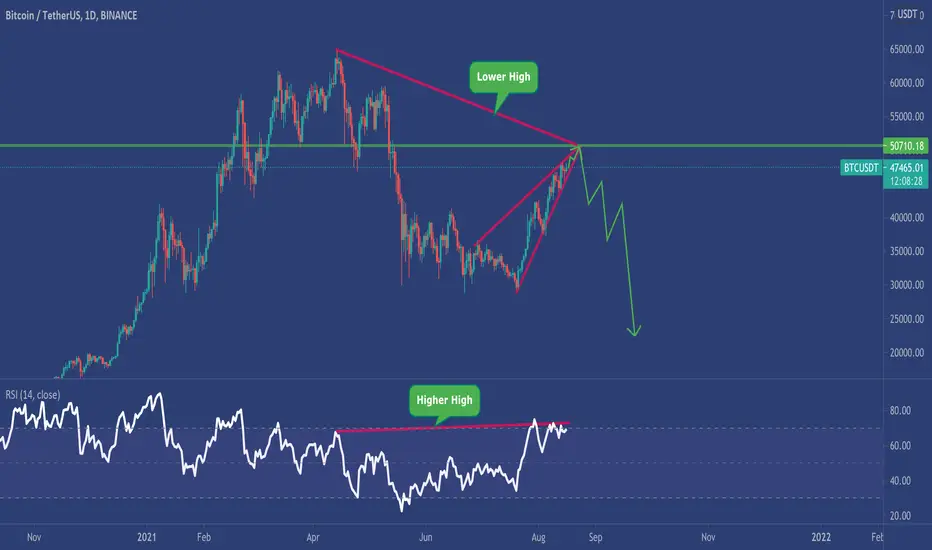
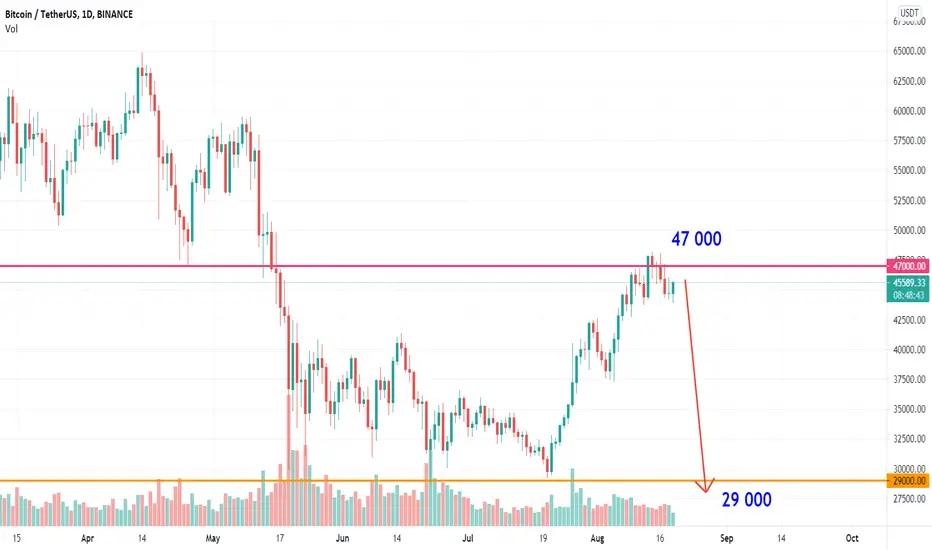
BTCUSDT 1D: Possible SHORTBTCUSDT 1D: Possible SHORT
Rebound from resistance level 47000 and fall to support level 29000
BTCUSDT correction required FROM $50.7KBTCUSDT correction demand from $50.7k. BTC create rising wages and should be fall immediately.