Gold's Slide Powers BTC Past 100K: Time to Short at Highs🚀 BTC Explodes Past the 100,000 Milestone!
Today, BTC shattered the highly anticipated 100,000 mark, sending shockwaves through the crypto market. But this remarkable rally came at a steep cost—💥 many traders faced liquidations, wiping out their accounts as the price volatility reached a fever pitch.
💎 The Gold - Crypto Connection
Interestingly, as gold continues its noticeable downward slide 📉, virtual currencies are stepping in as an alternative haven. The influx of capital seeking new opportunities has fueled the upward trajectory of cryptos, firmly establishing their bullish momentum.
📈 What’s Next?
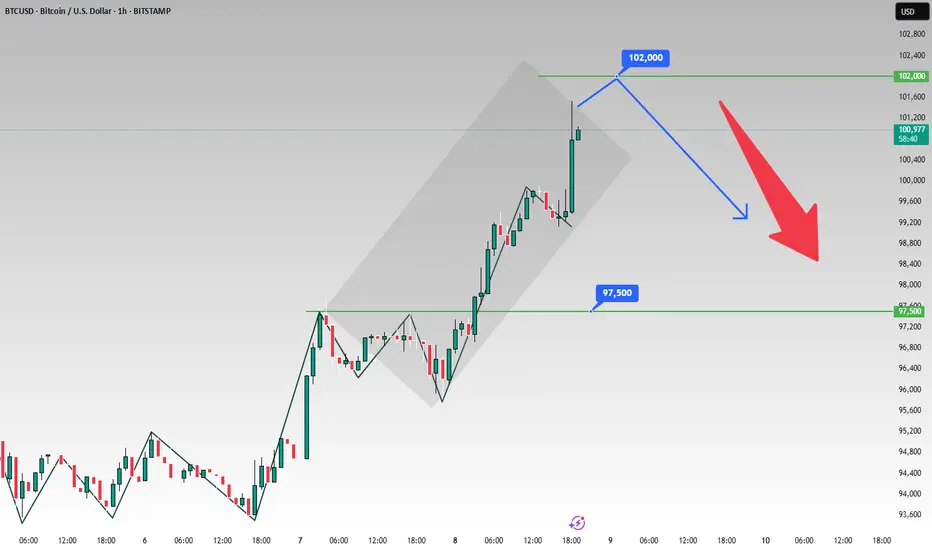
With the 100,000 resistance now decisively breached, BTC is poised to climb even higher, riding the wave of its recent triumph 🌊. But savvy traders are eyeing a strategic play: once the price hits a peak, it could be prime time to short at the highs ⏳—a move that balances the allure of profit with the inherent risks of a volatile market.
⚡⚡⚡ BTCUSD ⚡⚡⚡
🚀 Sell@101000
🚀 TP 98000 - 97000
Accurate signals are updated every day 📈 If you encounter any problems during trading, these signals can serve as your reliable guide 🧭 Feel free to refer to them! I sincerely hope they'll be of great help to you 🌟
Btcusdtshort
btcusd sell signal. Don't forget about stop-loss.
Write in the comments all your questions and instruments analysis of which you want to see.
Friends, push the like button, write a comment, and share with your mates - that would be the best THANK YOU.
P.S. I personally will open entry if the price will show it according to my strategy.
Always make your analysis before a trade
BTCUSD short-term view.It is a good opportunity to sell BTCUSD in real time. Short-term is based on the right side of the swing trading, with a target of 93000-92500. In addition, the uncertainty of the news on BTCUSD. It is a good time to sell now.

BTCUSDT Take ProfitThe BTCUSDT trade I shared a few hours ago closed in profit. Those who wanted could have set the TP at a 1:2 Risk-to-Reward Ratio as well. I entered the trade with a sniper entry. 🎯📈

BTCUSDTWishing everyone a great weekend! I opened a BTCUSDT trade this morning and hit TP — price has now returned to the same level (I didn’t share that signal with you). I'm considering taking another trade. Although BTC tends to act “blind” during weekends, I still want to seize the opportunity. For that reason, it's better to enter with a smaller lot size. I may close this trade manually — so turn on notifications to stay updated 🙂
🔍 Criteria:
✔️ Timeframe: 15M
✔️ Risk-to-Reward Ratio: 1:2
✔️ Trade Direction: Sell
✔️ Entry Price: 96428.33
✔️ Take Profit: 95978.61
✔️ Stop Loss: 96728.22
🔔 Disclaimer: This is not financial advice. It's a trade I’m taking based on my own system, shared purely for educational purposes.
📌 If you're also interested in systematic and data-driven trading strategies:
💡 Don’t forget to follow the page and subscribe to stay updated on future analyses.

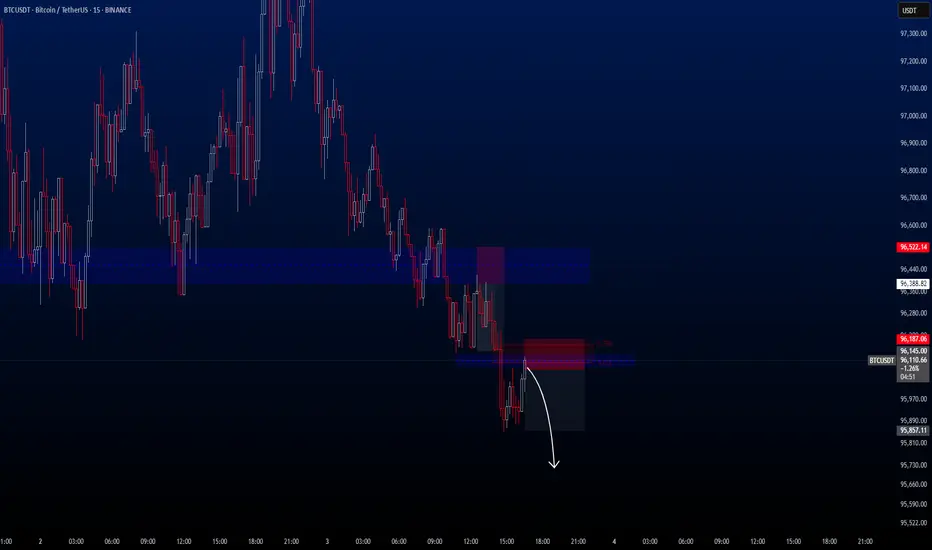
BTCUSDT Wishing everyone a great weekend! I'm considering opening a BTCUSDT trade. Although BTC tends to act “blind” over the weekend, I still plan to take advantage of the opportunity.**
🔍 Criteria:
✔️ Timeframe: 15M
✔️ Risk-to-Reward Ratio: 1:2
✔️ Trade Direction: Sell
✔️ Entry Price: 96061.32
✔️ Take Profit: 95810.45
✔️ Stop Loss: 96187.06
🔔 Disclaimer: This is not financial advice. It's a trade I’m taking based on my own system, shared purely for educational purposes.
📌 If you're also interested in systematic and data-driven trading strategies:
💡 Don’t forget to follow the page and subscribe to stay updated on future analyses.
The decisive day of major data (BTCUSD)Yesterday, it was mentioned that the expectation of continuing to buy after a retracement of 96k was completely correct. Followers also made good profits.
BTCUSD bulls are still strong. The retracement is mainly long trading, which needs to be paid attention to at present. 96k/95k are both good buying opportunities.
TP98K-100K
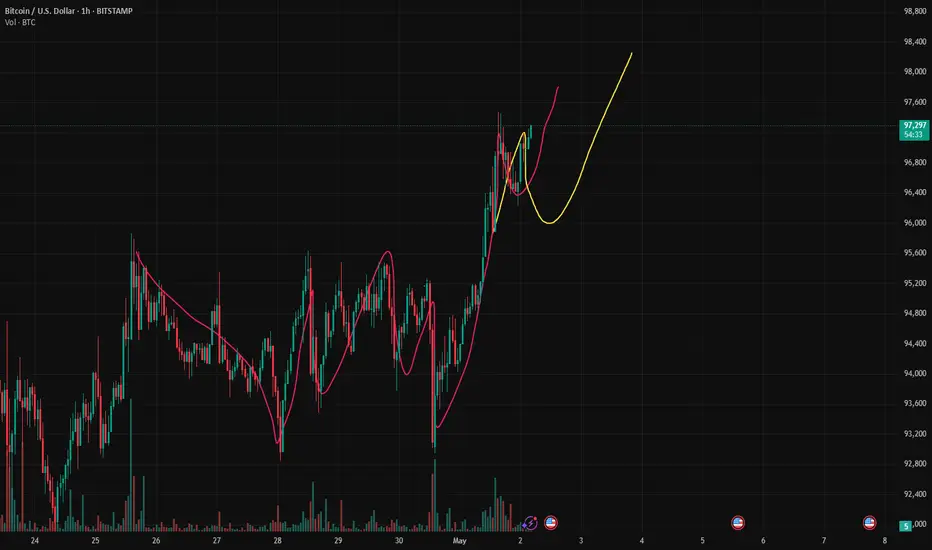
Can BTCUSD continue to be purchased? The answer is definitely.Can BTCUSD continue to be purchased? The answer is definitely.
The current trend is a rebound trend after a volatile decline. The space for a short-term increase of 1,500 points is very simple. The target position is 94,700-95,200. Friends who like to do short-term swing trading can follow.

Buy@9500096000: This represents the resistance level adjacent to the upper trend-line of the current ascending wedge. The price has repeatedly probed this zone but hasn't managed to achieve a decisive breakthrough, underscoring significant selling pressure at this crucial juncture 💥.
97500: It stands as a more elevated resistance milestone. Should the price powerfully breach the 96000 resistance barrier and sustain its upward momentum, it could potentially challenge this level 🎯.
⚡⚡⚡ BTCUSD ⚡⚡⚡
🚀 Buy@95000
🚀 TP 96000 - 97000
Accurate signals are updated every day 📈 If you encounter any problems during trading, these signals can serve as your reliable guide 🧭 Feel free to refer to them! I sincerely hope they'll be of great help to you 🌟

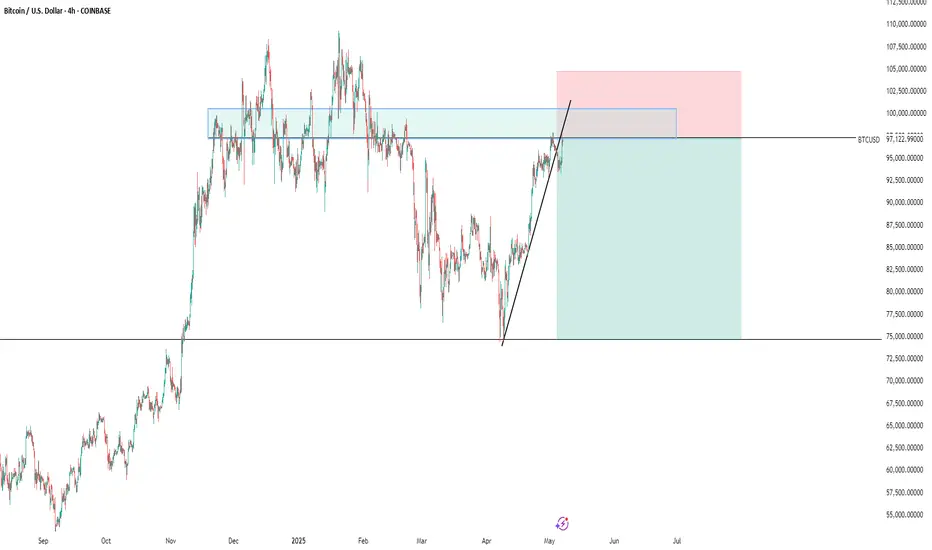
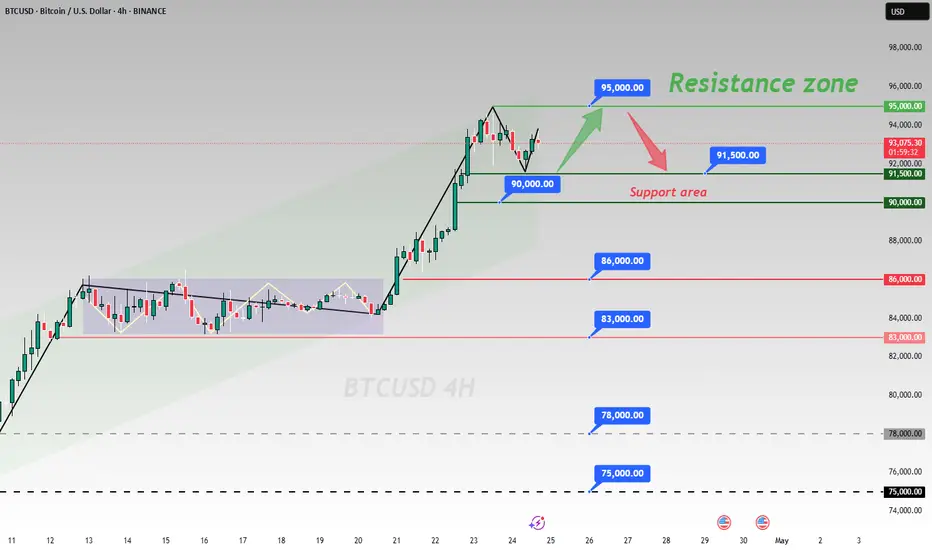
BTCUSD 4 - hour Chart AnalysisBTCUSD 4 - hour Chart Analysis
I. Trend Judgment
From the 4 - hour chart, BTCUSD is on an upward trend, consolidating at relatively high levels. Despite price fluctuations, bulls are still in control to some extent 🐂.
II. Key Levels
Support Area: The 90,000 - 91,500 range is a key support zone. The price has rebounded here multiple times, suggesting strong buying interest. If it drops back, it could be a buying opportunity 📈. 86,000 and 83,000 are additional lower - level supports.
Resistance Area: 95,000 is the resistance area. The price has faced hurdles here. If bullish momentum strengthens, breaking this could open up more upside 🚀.
III. Trading Strategies
Long - position Strategy: When the price retreats to the 90,000 - 91,500 support area and a bullish candlestick shows up, consider going long. Place stop - loss below the support and aim for 95,000. If broken, higher levels may follow 💰.
Short - position Strategy: Near 95,000, if a bearish candlestick appears with rising volume, try a small short position. Set stop - loss above resistance and target 91,500 - 90,000 ⬇️.
⚡⚡⚡ BTCUSD ⚡⚡⚡
🚀 Sell@95000 - 94000
🚀 TP 92000 - 91000
🚀 Buy@91000 - 92000
🚀 TP 94000 - 95000
Accurate signals are updated every day 📈 If you encounter any problems during trading, these signals can serve as your reliable guide 🧭 Feel free to refer to them! I sincerely hope they'll be of great help to you 🌟
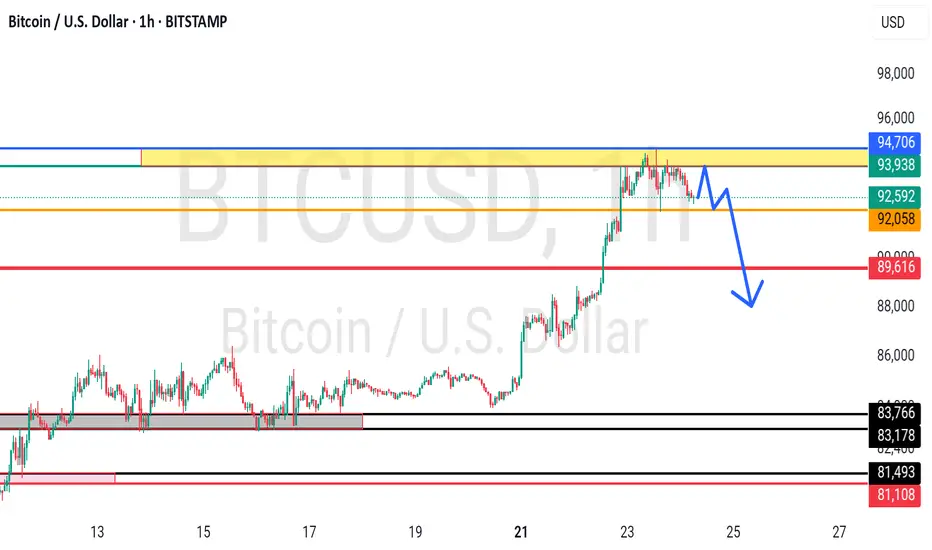
BTCUSDT- high placed? What's next??#BTCUSDT - well after a fantastic bull run market placed a reasonable high in yesterday,
Keep close that region b cause if market hold it in that case we can expect a drop from here.
Good luck
Trade wisley
BTC may drop back to 90,000 pointsBTC is likely to pull back to around 90,000 points before starting to rebound.
In terms of capital flow, the upward momentum of XAU/USD has been temporarily halted ⏸️, and a large amount of capital is rapidly flowing into the virtual currency market 💸! As the leader of virtual currencies, Bitcoin has undoubtedly become an important destination for capital inflows 🌟. The injection of a large amount of capital has directly driven a significant surge in the price of BTC 📈. Capital chases profits just like water flows 🌊. Against the backdrop of the phased adjustment in the gold market, Bitcoin, with its unique technological attributes and market vitality, has attracted the attention of many investors, laying a solid capital foundation for its subsequent price increase 🏗️.
At the macro policy level, Trump's remarks have had a strong impact on the financial market 😲! His change in attitude towards Fed Chairman Powell has triggered the reallocation of market funds 🔄. When he previously threatened to remove Powell, investors' concerns about the Fed's policy intensified, and they flocked to the gold market for hedging, pushing up the gold price 🚀. However, Trump's latest statement that he will not fire Powell and his call for interest rate cuts have alleviated some of the investors' anxiety, prompting funds to flow back into US dollar - denominated assets 📉. It should be noted that during this process, some of the funds withdrawn from the gold market have not fully returned to traditional US dollar assets but have flowed into the virtual currency field such as Bitcoin 💥. As an emerging digital asset, Bitcoin has both certain hedging and speculative attributes, and has become a new safe haven and value - added target for funds 💰.
In international trade, Trump has shown signs of easing in the trade negotiations with China and is trying to reach an agreement quickly to reduce tariffs (although not to zero) 🤝. The past uncertainty in trade relations was one of the important factors driving up the gold price ⚠️. With the expected easing of trade tensions, potential future trade easing measures may suppress the market demand for gold as a safe haven asset ⏳. In contrast, the Bitcoin market is less directly affected by trade policies. Instead, due to its characteristics such as decentralization and global circulation 🌐, it has gained more favor during the process of capital reallocation. When the attractiveness of traditional safe haven assets declines, the scarcity and innovation of Bitcoin make it a new choice for investors to diversify risks and pursue returns 🎯, further stimulating the market demand for BTC 📈.
⚡⚡⚡ BTCUSD ⚡⚡⚡
🚀 Sell@92000 - 92500
🚀 TP 91000 - 90000
The market has been extremely volatile lately 📈📉 If you can't figure out the market's direction, you'll only be a cash dispenser for others 💰

BTCUSDT at daily resistance, likely to head to 84kThe price has hit the daily resistance as expected in the quoted post. I see a pullback here which is already started. A short trade setup is favorable gere, We take a short in this zone and target towards daily support DS1. The correction can go upto weekly suppor WS1 but lets focus on this short trade first. risking 1.5% for 4.5% win.

"Bitcoin vs Tether" Crypto Market Heist Plan (Scalping/Day)🌟Hi! Hola! Ola! Bonjour! Hallo! Marhaba!🌟
Dear Money Makers & Robbers, 🤑💰✈️
Based on 🔥Thief Trading style technical and fundamental analysis🔥, here is our master plan to heist the "Bitcoin vs Tether" Crypto Market. Please adhere to the strategy I've outlined in the chart, which emphasizes short entry. Our aim is the high-risk Green MA Zone. Risky level, oversold market, consolidation, trend reversal, trap at the level where traders and bullish robbers are stronger. 🏆💸"Take profit and treat yourself, traders. You deserve it!💪🏆🎉
Entry 📈 : "The vault is wide open! Swipe the Bearish loot at any price - the heist is on!
however I advise to Place sell limit orders within a 15 or 30 minute timeframe most nearest or swing, low or high level for Pullback Entries.
Stop Loss 🛑:
📌Thief SL placed at the nearest/swing High or Low level Using the 4H timeframe (81000) Day/Scalping trade basis.
📌SL is based on your risk of the trade, lot size and how many multiple orders you have to take.
Target 🎯: 70000 (or) Escape Before the Target
"Bitcoin vs Tether" Crypto Market Heist Plan (Scalping/Day Trade) is currently experiencing a Bearish trend.., driven by several key factors.👇👇👇
📰🗞️Get & Read the Fundamental, Macro, COT Report, On Chain Analysis, Sentimental Outlook, Intermarket Analysis, Future trend targets... go ahead to check 👉👉👉🔗🔗
Detailed Point Recap 📋
Fundamentals 📊: Strong network + adoption ✅ offset regulatory risks ⚠️—moderately bullish 📈.
Macro 🌍: Inflation aids BTC 🥇, but tight policy/USD weigh ⚖️—mixed 🤔.
COT 📈: Institutional longs 📈 vs. leverage risks ⚡—cautiously bullish ✅.
On-Chain 🔗: LTH bullishness 📈 vs. STH selling 📉—leans positive but capped ⚖️.
Intermarket 🔄: Short-term bearish (equity/USD) 📉, long-term hedging 📈—mixed ⚖️.
Sentiment 😊: Neutral across cohorts ⚖️—lacking conviction 🤷.
Trends 🎯: Short-term downside ($70K) 📉 vs. long-term upside ($129K) 📈—context-driven 🔮.
Outlook 🌟: Neutral now ⚖️, tilting bearish short-term 📉, bullish long-term 📈.
⚠️Trading Alert : News Releases and Position Management 📰 🗞️ 🚫🚏
As a reminder, news releases can have a significant impact on market prices and volatility. To minimize potential losses and protect your running positions,
we recommend the following:
Avoid taking new trades during news releases
Use trailing stop-loss orders to protect your running positions and lock in profits
💖Supporting our robbery plan 💥Hit the Boost Button💥 will enable us to effortlessly make and steal money 💰💵. Boost the strength of our robbery team. Every day in this market make money with ease by using the Thief Trading Style.🏆💪🤝❤️🎉🚀
I'll see you soon with another heist plan, so stay tuned 🤑🐱👤🤗🤩

BTC | FAKE REVERSAL - Here's WhyI'm not convinced of the recent "bullish" price action. In fact, I say it's likely the calm before the next bearish move down.
In a downtrend, there are a few tale tell signs that the price has gone into full bear mode . In this video, I discuss two of them.
Make sure you catch up on ALTCOINS, and their ideal buying zones HERE 👀👇
__________________
BINANCE:BTCUSDT

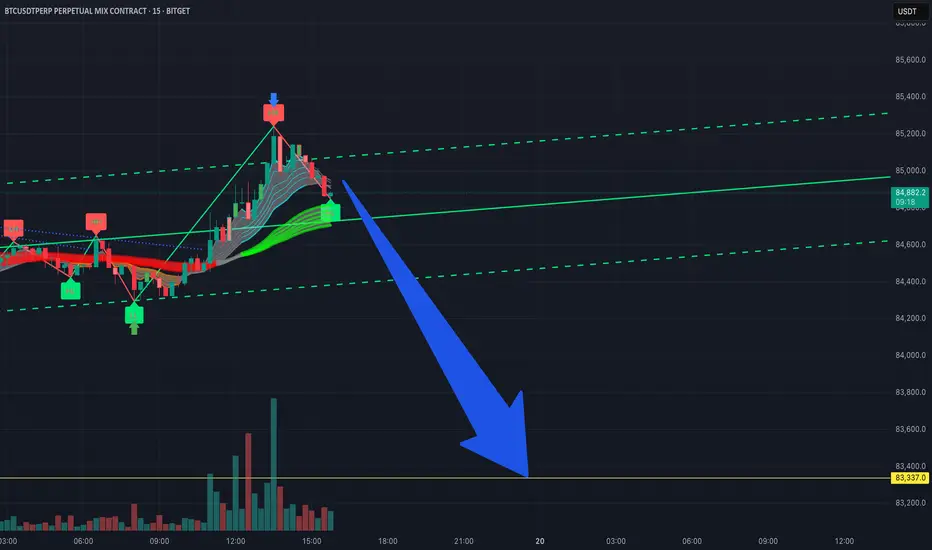
I’m estimating a short target for Bitcoin futures on the 15-minuLooking at the 15-minute chart on Bitget, I'm expecting a potential drop down to around 83,337. Just something to keep an eye on if you're in a short-term trade.
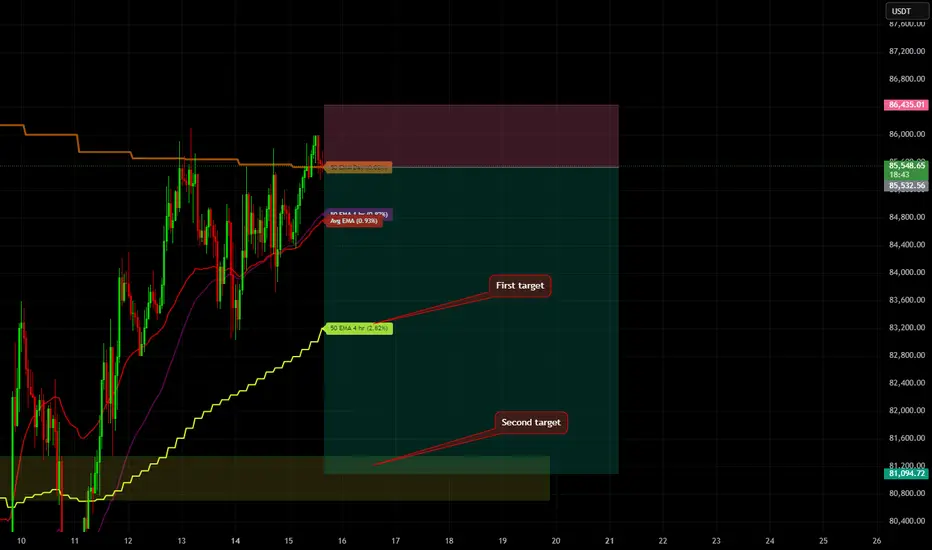
BTCUSDT shortBTCUSDT has notably deviated from the 4-hour EMA50 — by as much as 2.8%, which is a significant move for this asset.
Additionally, the daily EMA50 is acting as strong resistance, holding the price down.
I expect a pullback within the next couple of days — key levels are marked on the chart.
Want to track such deviations automatically? Send me a DM — I’ll grant you access to the indicator.
Keep a close eye on the downward movement of BTC at all times.Today, BTC is in a sideways trend, with its price fluctuating in the range of 83,000 to 86,000. 📊
At present, there are no significant new developments in the area of tariffs. 👍
However, what we need to be vigilant about is that if the tariff situation deteriorates and triggers the market's safe - haven mechanism, a large amount of capital is highly likely to flow into the relatively stable gold and foreign exchange markets. 😟
This, in turn, could lead to a large - scale sell - off in the Bitcoin market. 💥
Therefore, it is recommended to consider short - selling at relatively high price points. 📉
The accuracy rate of our daily signals has remained above 98% throughout a month 📈! You are warmly welcome to follow us and join in on the success 🌟.
💰💰💰 BTCUSD 💰💰💰
🎯 Sell@84500 - 85500
🎯 TP 82500 - 81500
Traders, if you're fond of this perspective or have your own insights regarding it, feel free to share in the comments. I'm really looking forward to reading your thoughts! 🤗

At present, a selling phenomenon has emergedAt present, a selling phenomenon has emerged😰, and a large number of traders are waiting for the market to open⏰.
When other markets open on Monday, the situation of a large amount of capital flowing out to other trading fields also deserves attention. 😟
Especially the flows to the XAU/USD and USOIL markets, or other foreign exchange markets. 💱 The movement of funds to these areas might be influenced by economic news, geopolitical events, or simply portfolio re - balancing by investors. 📰
💰💰💰 BTCUSD 💰💰💰
💰💰💰 BTCUSD 💰💰💰
🎯 Sell@84000 - 84500
🎯 TP 82500 - 81500
Recently, the market has been extremely volatile 😱, which has led to the clearing of many traders' accounts or significant losses 😫. You can follow my signals and gradually recover your losses and achieve profitability 🌟💪.
Traders, if you're fond of this perspective or have your own insights regarding it, feel free to share in the comments. I'm really looking forward to reading your thoughts! 🤗

Short - term Upside & Mon. Outflow RiskAnalysis of the Price Trend of Bitcoin 📈: Short - term Upward Expectations 💰 and the Risk of Capital Outflow on Monday 💸
The current price of BTC is at 84,500 points. 📊
Considering various factors comprehensively, there is a possibility that the price will rise to around 86,500 points tomorrow. 🚀 This could be due to factors like positive market sentiment or recent trends in the cryptocurrency space. 💰
However, when other markets open on Monday, the situation of a large amount of capital flowing out to other trading fields also deserves attention. 😟
Especially the flows to the XAU/USD and USOIL markets, or other foreign exchange markets. 💱 The movement of funds to these areas might be influenced by economic news, geopolitical events, or simply portfolio re - balancing by investors. 📰
💰💰💰 BTCUSD 💰💰💰
🎯 Buy@84000 - 84500
🎯 TP 85500 - 86500
Recently, the market has been extremely volatile 😱, which has led to the clearing of many traders' accounts or significant losses 😫. You can follow my signals and gradually recover your losses and achieve profitability 🌟💪.
Traders, if you're fond of this perspective or have your own insights regarding it, feel free to share in the comments. I'm really looking forward to reading your thoughts! 🤗

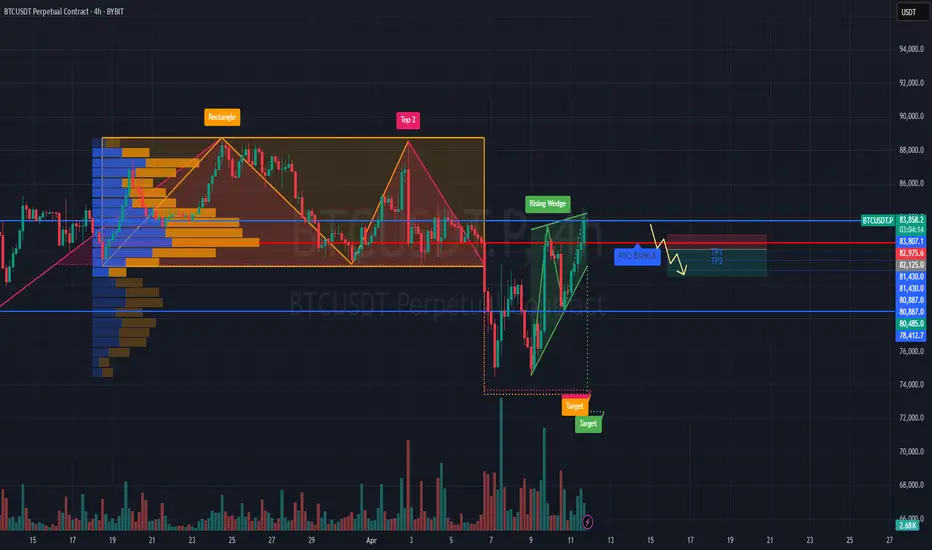
#BTCUSDT shows signs of reversal📉 SHORT BYBIT:BTCUSDT.P from $82,125.0
🛡 Stop loss: $82,976.0
🕒 Timeframe: 4H
✅ Overview:
➡️ The BYBIT:BTCUSDT.P chart shows a rising wedge — a typical bearish pattern.
➡️ Price hit the upper wedge boundary and started to decline, breaking support.
➡️ A second top (Top 2) has formed on weakening volume, signaling a possible reversal.
➡️ The POC at $82,490.8 has been broken — price is holding below it, strengthening the bearish case.
🎯 TP Targets:
💎 TP 1: $81,430.0
💎 TP 2: $80,887.0
💎 TP 3: $80,485.0
📢 Additional scenario notes:
📢 Entry activates upon breakdown and consolidation below $82,125.
📢 Watch for increased volume at key TP levels for confirmation.
📢 A move above $82,976.0 invalidates the setup — stop placed just above key resistance and wedge top.
🚀 BYBIT:BTCUSDT.P shows signs of reversal — a corrective move to the downside is expected.
BTC/USD) rejected point analysis Read The ChaptianSMC Trading point update
This chart presents a bearish short-term technical analysis for Bitcoin (BTC/USD) on the 2-hour timeframe. Here’s a breakdown
---
Key Observations:
1. Downtrend Structure:
Price is forming lower highs and lower lows.
A clear downtrend is marked on the chart.
2. Rejection Zone:
The yellow highlighted area near $83,800–$84,000 is labeled as a “rejected point.”
Price touched this zone and got rejected again, confirming resistance.
3. 200 EMA (Exponential Moving Average):
The 200 EMA is at $82,291, acting as dynamic resistance. Price is currently below it, reinforcing bearish momentum.
4. Support Level / Target:
The yellow box at the bottom around $74,559 is marked as the support zone and target level.
This is the previous low and aligns with the lower boundary of the descending channel.
5. RSI (Relative Strength Index):
RSI is showing a potential bearish divergence and is pointing downward, suggesting weakening bullish momentum and a likely move lower.
Mr SMC Trading point
---
Trade Idea:
Bias: Bearish
Entry: Around $81,300–$82,000 (after rejection confirmation)
Target: $74,559 (support level)
Stop-loss: Could be placed just above the rejection zone, around $84,000
---
Pales support boost 🚀 analysis follow)

BTC | BEARISH Cycle Begins | $71KThere are a few tell signs that BTC has entered the bearish market.
If the price fails to maintain closing daily candles ABOVE the 70k area, there is a likelihood for a nasty Head and Shoulders pattern to form.
A key point to watch are the Bollinger Bands, which gives you an indication of the next possible zone to watch.
_____________________
BINANCE:BTCUSDT
