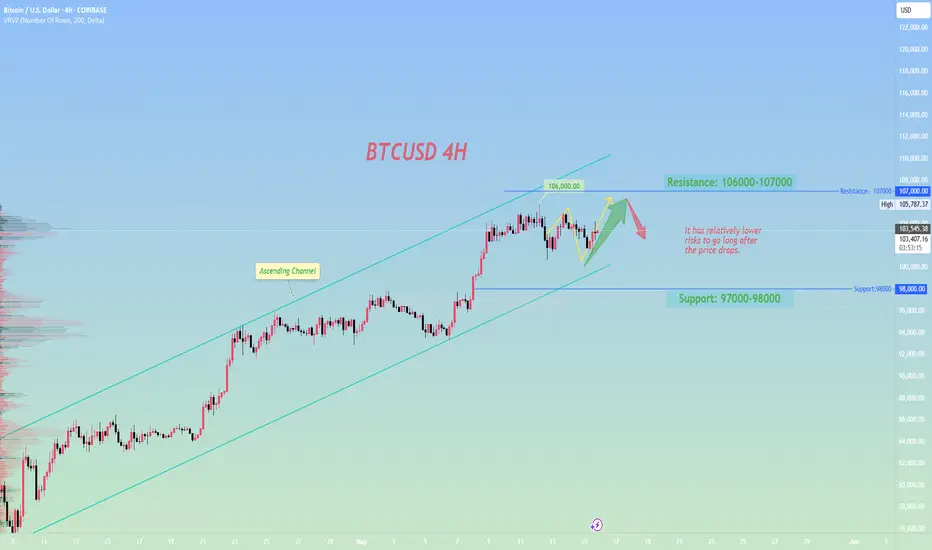
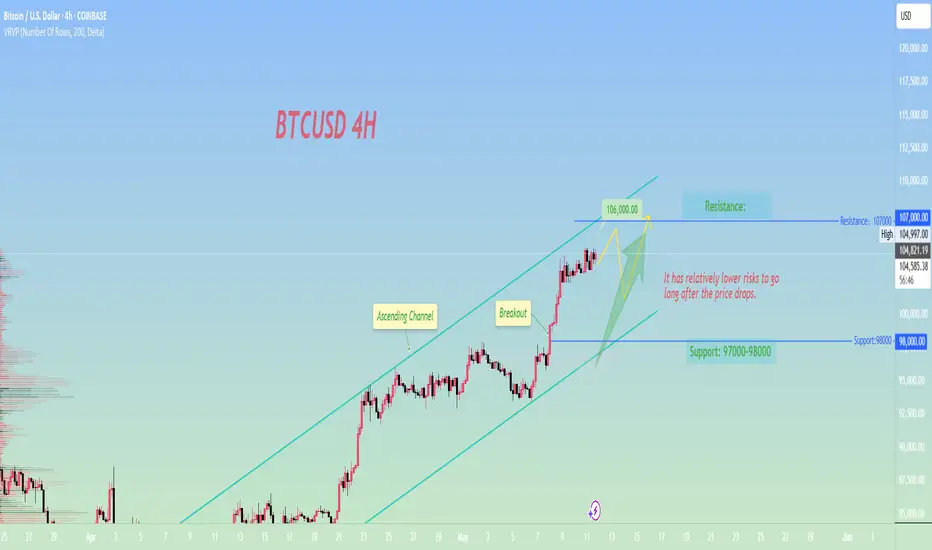
Analysis of BTC's Trend After Two Breakthroughs Above 105,000Recently, the price of BTC has been fluctuating within the range of 102,000-105,000 📊. It has broken through the 105,000 resistance level twice: the first breakout reached 106,000 💥, and today it strongly broke through to 107,000 🔥 before quickly retracing to the 102,000 support level ⬇️. After hitting the bottom, it rebounded rapidly to 105,000 📈. The current upward trend has not stalled 🚀, and shorting at high levels near 106,000 can be considered when the price rebounds to this area ⏳ 👉
⚡⚡⚡ BTCUSD ⚡⚡⚡
🚀 Sell@105000 - 106000
🚀 TP 102500 - 101500
🚀 Buy@101500 - 102500
🚀 TP 105000 - 106000
👇Accurate signals are updated every day 📈 If you encounter any problems during trading, these signals can serve as your reliable guide 🧭 Feel free to refer to them! I sincerely hope they'll be of great help to you 👇
Btcusdtsignal

Still bullish, it is recommended to focus on going long.Earlier, Bitcoin reached a weekly high of $106,518 before pulling back due to market liquidation, with total market liquidations exceeding $669 million. Bitcoin has closed higher for five consecutive weeks on the weekly chart, forming a "higher highs and higher lows" upward pattern, rising nearly 43.75% from its recent low. However, it encountered resistance near the all-time high of $109,588 and failed to break through. Currently, Bitcoin is trading in the $100,000-$110,000 range, with strong support at $100,000 and $90,000, and key resistance at $110,000.👉👉👉
After Bitcoin previously broke through $105,500, the moving averages showed an upward trend, and the RSI was in the overbought zone, indicating strong bullish momentum.
Overall, under the combined influence of news and technical factors, the Bitcoin market on May 19th showed a short-term volatile but long-term optimistic trend. Investors need to closely monitor changes in key support and resistance levels, as well as the impact of market news, and make investment decisions cautiously.
BTCUSD Trading Strategy
buy @ 102500-102700
sl 101000
tp 103800-104000
If you think the analysis helpful, you can give a thumbs-up to show your support. If you have different opinions, you can leave your thoughts in the comments. Thank you for reading!👉👉👉

Bitcoin still has strong supportThe RSI index is in a neutral-to-strong zone but has retreated from earlier levels, indicating that short-term upward momentum has weakened. The MACD indicator still maintains a bullish pattern, though the height of the bars has decreased. The price remains well above both the 50-day and 200-day moving averages, with the medium-to-long-term upward channel intact, keeping the overall structure in a strong bull market. However, there are signs of a potential short-term pullback.👉👉👉
On the daily chart, the Bitcoin price remains above the long-term trend breakout point since April. The 20-day moving average is at $103,260, forming a direct resistance level, while the 50-day moving average at $101,904 coincides with a key support level. As long as the Bitcoin price stays above this dynamic range, bulls still have opportunities.
In view of the current market conditions, short-term trading is recommended for investors to closely monitor the breakthrough of key support and resistance levels. If the price pulls back to the $100,000-$101,000 range and finds support, while forming daily K-line doji or long lower shadow patterns, appropriate position increases can be considered, with targets set at $105,000. After a breakthrough, the target can be further adjusted to $110,000. At the same time, due to market uncertainties and short-term pullback risks, investors should control their position sizes and avoid excessive leverage and blind chasing of gains or panic selling.
BTCUSD Trading Strategy
buy @ 102500-102700
sl 101000
tp 103800-104000
If you think the analysis helpful, you can give a thumbs-up to show your support. If you have different opinions, you can leave your thoughts in the comments. Thank you for reading!👉👉👉
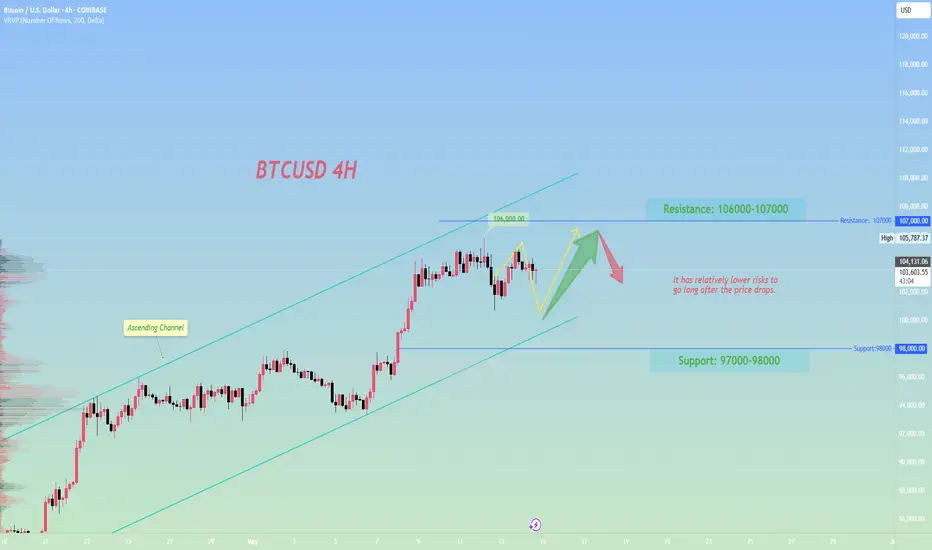
Bitcoin remains in high-level fluctuationsThe price of Bitcoin has generally remained above $103,000 today, demonstrating strong support. In the short term, after experiencing previous fluctuations, Bitcoin is currently in a relatively stable upward trend and continues to move towards higher prices.👉👉👉
Global economic events have contributed to the rise of Bitcoin. The decision between China and the U.S. to temporarily reduce tariffs has improved investor confidence and encouraged market risk appetite, making funds more willing to flow into risky assets like Bitcoin.
From a technical perspective, Bitcoin is in a strong upward trend. The RSI is above 70, indicating that Bitcoin may be in an overbought state in the short term. This could lead to a slight pullback or sideways consolidation in the upcoming market to digest excessive buying pressure. Investors need to pay attention to potential pullback risks, while closely monitoring factors such as macroeconomic data, policy changes, and market capital flows to adjust investment strategies in a timely manner.
BTCUSD Trading Strategy
buy @ 102700-103000
sl 101000
tp 104000-104200
If you think the analysis helpful, you can give a thumbs-up to show your support. If you have different opinions, you can leave your thoughts in the comments. Thank you for reading!👉👉👉
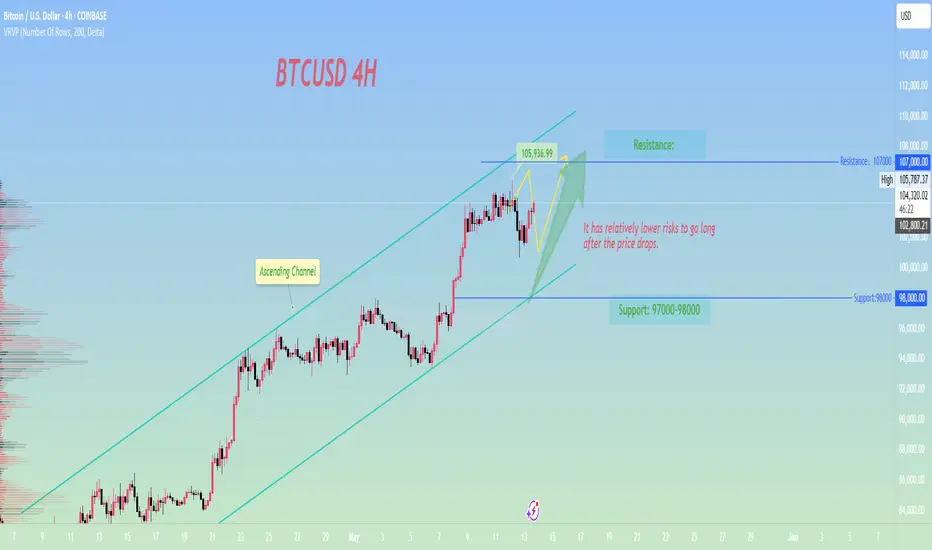
Bitcoin remains fluctuating at a high levelThe overall market trend is largely in line with my analysis chart. Today, the Bitcoin market shows a pattern of high-level fluctuations and a slight decline. The RSI index is 40.47, having retreated from the overbought area, indicating short-term pullback pressure. However, although the momentum of the MACD indicator has weakened, it still maintains a bullish trend.Moreover, the price is far above both the 50-day moving average and the 200-day moving average, and the medium- and long-term upward channel remains intact, with the overall market in a strong bullish structure.
The operation suggestion is mainly to go long on the pullback, and patiently wait to enter the market at the key position.👉👉👉
BTCUSD Trading Strategy
buy @ 103000-103200
sl 101000
tp 104200-104500
If you think the analysis is helpful to you, you can give a thumbs-up to show your support. If you have different opinions, you can leave your thoughts in the comments. Thank you!👉👉👉
btcusdt - short i thinq time to short?
Push like if you think this is a useful idea!
Before to trade my ideas make your own analysis.
Write your comments and questions here!
Thanks for your support!

Summary of Bitcoin Last WeekThe overall trend of the Bitcoin market shows a pattern of "first decline and then rise". The price has continuously broken through several key technical resistance levels, strongly breaking through the psychological barrier of the $100,000 mark and reaching a new stage high.👉👉👉
With the rise in price, the hash price of Bitcoin has steadily rebounded and is approaching the high range of the past month, rising for several consecutive days, indicating that the market demand for computing power resources remains robust.
Overall, after the previous fluctuations, the Bitcoin market has demonstrated strong resilience and optimistic expectations under the dominance of the bulls in the recent period. However, the cryptocurrency market is highly uncertain and risky, and investors still need to approach it with caution.
If you approve of my analysis, you can give it a thumbs-up as support. If you have different opinions, you can leave your thoughts in the comments.Thank you!👉👉👉
BTCUSDT: Drops Towards $53000 region may help us hitting $80000.BINANCE:BTCUSDT price currently in making of AB=CD pattern, it is likely to touch and reject at the $53000 which area remain crucial for most of the swing investors. The following news we can significant impact in the crypto market also 50k to 53k area remain extremely bullish. With accurate entry at 530000 area when we can target 80-100k possibly.

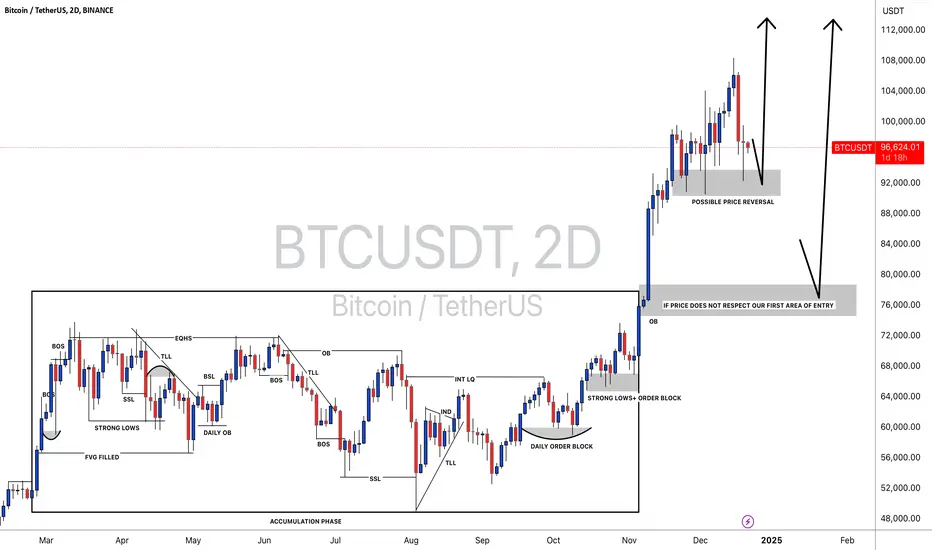
BTCUSDT: Safe Zone Vs Risk Zone, Which one would you choose? Dear Traders,
WE have possible buying opportunities, with the first entry, the only reason that we think that price would reverse is, possible end of year bullish push which may take price to another record higher high. Although, since the price already has rejected we think price is unlikely to reject at the level, and may drop to 75k region.
good luck.
#BITCOIN: Another drop and then Swing Bounce $125,000The current market sentiment is bearish, indicating a potential further decline towards the 65k price point. However, we anticipate a rebound towards the 125k region. As we approach the 65k threshold, we expect a substantial price increase.
To make informed investment decisions, it is crucial to observe a strong bullish trend before considering any bullish entries.
For more insights and market analysis, please like and comment.🚀❤️
Team Setupsfx_
Gold's Slide Powers BTC Past 100K: Time to Short at Highs🚀 BTC Explodes Past the 100,000 Milestone!
Today, BTC shattered the highly anticipated 100,000 mark, sending shockwaves through the crypto market. But this remarkable rally came at a steep cost—💥 many traders faced liquidations, wiping out their accounts as the price volatility reached a fever pitch.
💎 The Gold - Crypto Connection
Interestingly, as gold continues its noticeable downward slide 📉, virtual currencies are stepping in as an alternative haven. The influx of capital seeking new opportunities has fueled the upward trajectory of cryptos, firmly establishing their bullish momentum.
📈 What’s Next?
With the 100,000 resistance now decisively breached, BTC is poised to climb even higher, riding the wave of its recent triumph 🌊. But savvy traders are eyeing a strategic play: once the price hits a peak, it could be prime time to short at the highs ⏳—a move that balances the allure of profit with the inherent risks of a volatile market.
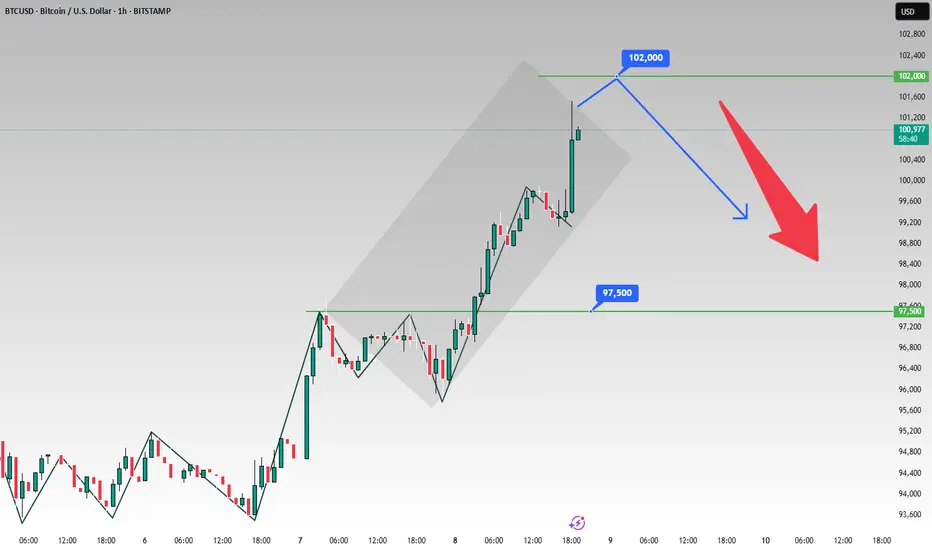
⚡⚡⚡ BTCUSD ⚡⚡⚡
🚀 Sell@101000
🚀 TP 98000 - 97000
Accurate signals are updated every day 📈 If you encounter any problems during trading, these signals can serve as your reliable guide 🧭 Feel free to refer to them! I sincerely hope they'll be of great help to you 🌟
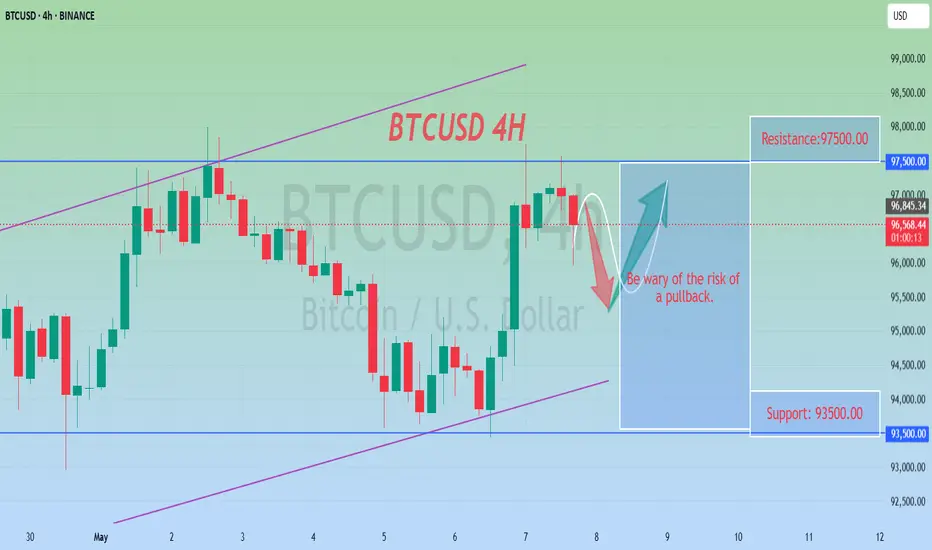
Bitcoin has pulled back after a substantial riseThe price of Bitcoin showed a trend of rising first and then making a small correction. On that day, the price rose after getting support near $93,500 and reached around $97,500 at its highest point, before pulling back somewhat.👉👉👉
The bulls in the market have shown strong performance, and the price has significantly increased at one point. However, we still need to be cautious about the potential pullback risks brought by the bearish divergence at the top and the resistance level above.
BTCUSD Trading Strategy
buy @ 94000-94370
sl 93000
tp 95000-95500
If you approve of my analysis, you can give it a thumbs-up as support. If you have different opinions, you can leave your thoughts in the comments.Thank you!👉👉👉
BTCUSD short-term view.It is a good opportunity to sell BTCUSD in real time. Short-term is based on the right side of the swing trading, with a target of 93000-92500. In addition, the uncertainty of the news on BTCUSD. It is a good time to sell now.

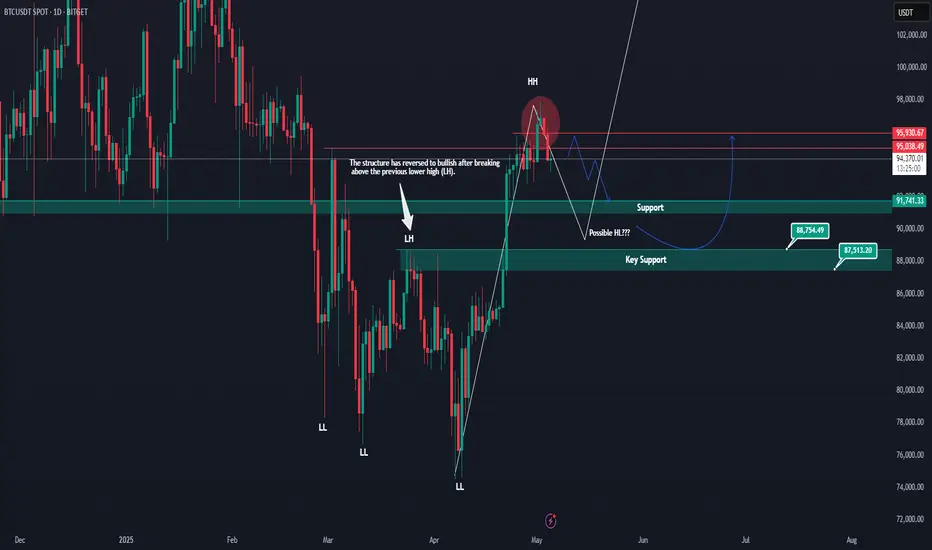
BTC Forming Bullish Structure — But Wait for the Higher LowAfter months of lower lows and lower highs, Bitcoin has finally broken structure by pushing above the previous lower high, officially forming a new higher high (HH). This is an early sign of a potential trend reversal back into bullish territory.
However, before momentum continues upward, a healthy retracement could occur. The key level to watch is the support zone around $91,200. If price pulls back and forms a higher low (HL) here or slightly lower around the $88,700–$87,500 zone, it would confirm the bullish structure and potentially kickstart the next leg up.
Patience is key here — let the higher low form before looking for long setups.
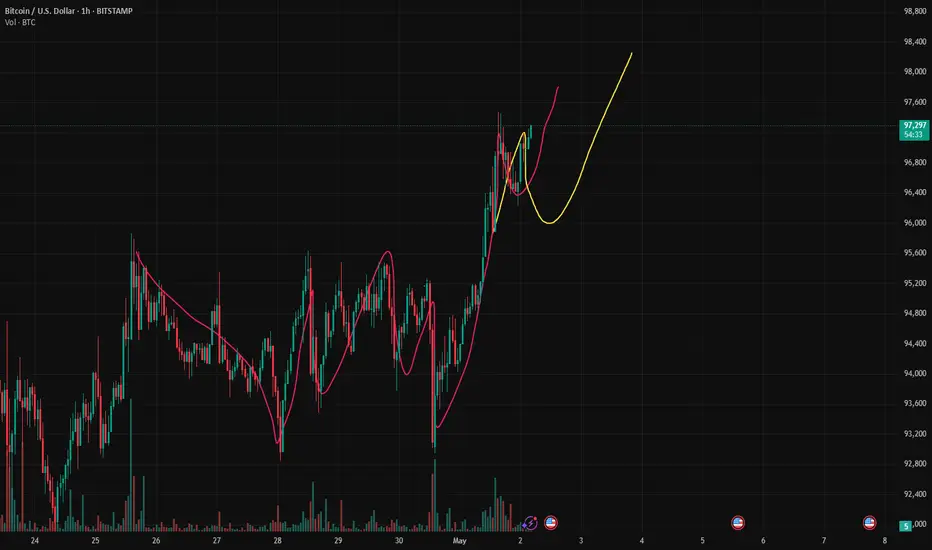
The decisive day of major data (BTCUSD)Yesterday, it was mentioned that the expectation of continuing to buy after a retracement of 96k was completely correct. Followers also made good profits.
BTCUSD bulls are still strong. The retracement is mainly long trading, which needs to be paid attention to at present. 96k/95k are both good buying opportunities.
TP98K-100K
Can BTCUSD continue to be purchased? The answer is definitely.Can BTCUSD continue to be purchased? The answer is definitely.
The current trend is a rebound trend after a volatile decline. The space for a short-term increase of 1,500 points is very simple. The target position is 94,700-95,200. Friends who like to do short-term swing trading can follow.

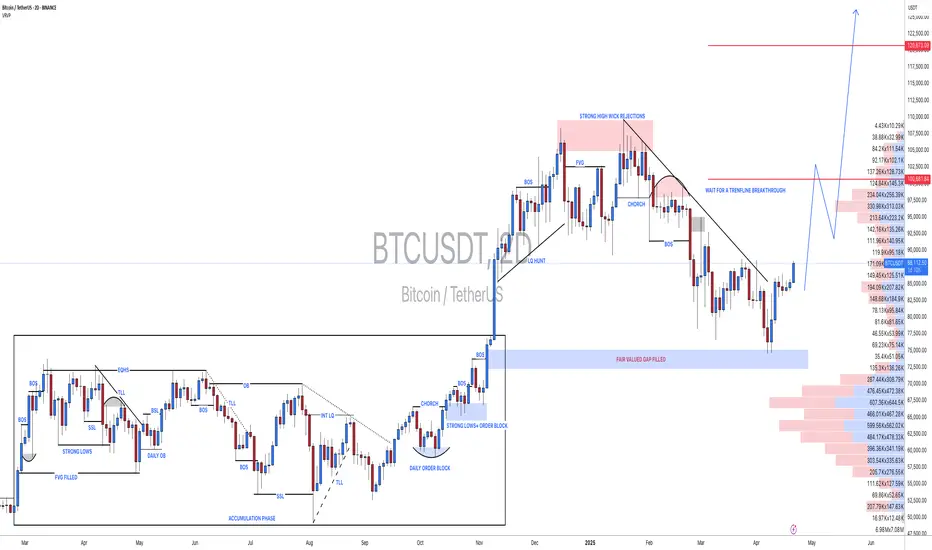
BTCUSDT 1W UpdateYes, history is likely to repeat itself, making it possible for Bitcoin to reach a new all-time high in the range of $130K to $150K this year.
Are you ready?

#BTCUSDT: From $74,000 to $88,000 Moving Well! More Growth CominIt’s been on a steady climb from $74,000 to $88,000. We’re expecting even more growth in the coming weeks. The price has finally broken free from its consolidation phase and is now on the rise. We think it’ll reach $94,000, then $100,000, and maybe even go up to $120,000 by the end of the year.
What do you think? Let me know in the comments below!
Thanks!
Team Setupsfx_
BTCUSDT 1W AnalysisBTC ~ 1W Analysis
#BTC It is necessary to wait until this pattern is successfully broken to confirm a sustained bullish trend.

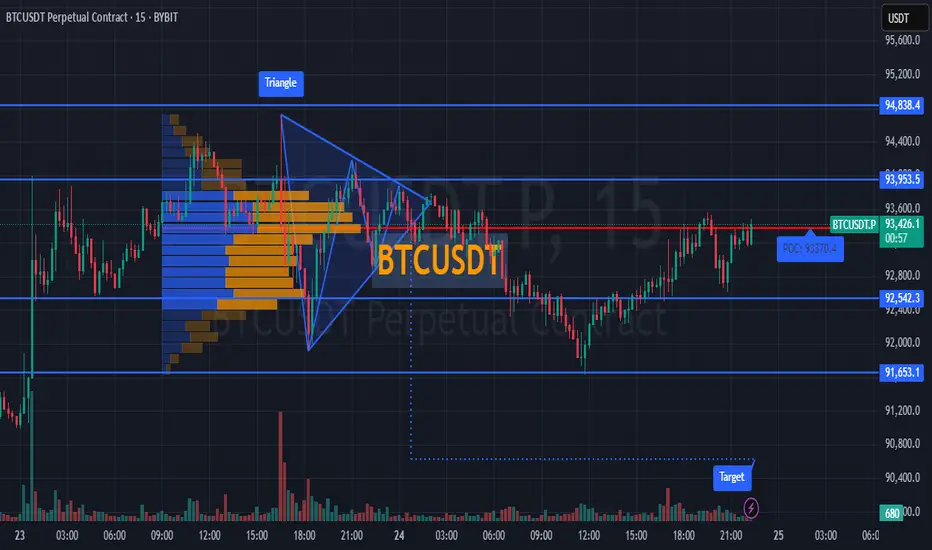
Market Analysis: #BTCUSDT💰 On the BYBIT:BTCUSDT.P chart, a clear symmetrical triangle pattern has formed and already broken down, leading to a confirmed bearish impulse. Price has now returned below the POC level at $93,370.4 (Point of Control by volume), indicating weakness from buyers.
📊 Key Levels
🔴 POC BYBIT:BTCUSDT.P $93,370.4
— This is the highest volume area, now acting as strong resistance. As long as price remains below, short bias is favored.
🔵 Support BYBIT:BTCUSDT.P $91,905.5
— A short-term target if the bearish momentum continues.
🎯 Lower Target Zone
— Indicates the full depth of the breakdown move, aiming at the $90,800–$91,000 range.
📈 Volume
➡️ Volume increased during the breakdown, then dropped as price revisited the $93,000 zone — this signals a weak retest and seller control.
📍 Important Notes
➡️ Currently, BYBIT:BTCUSDT.P is trading between two key zones — the POC above and the $91,900 support below.
➡️ Failure to break and hold above $93,370 keeps the bearish scenario in play.
➡️ A move below $92,600 will confirm continuation of the downtrend.
📢 Strategy Recommendations:
🚨 SHORT Scenario BYBIT:BTCUSDT.P
Entry: on a retest of $93,000–$93,200 and rejection
Stop Loss: above POC ($93,450)
Targets: $92,100 → $91,900 → $90,800
🚨 Alternative LONG Scenario BYBIT:BTCUSDT.P (only if POC is broken):
Entry: after a solid breakout and hold above $93,400 with volume
Target: $94,200–$94,800
Stop Loss: below $93,000
🚨 Conclusion :
BYBIT:BTCUSDT.P has completed the triangle pattern and is now in a retest phase. So far, signs still point to bearish continuation, with final confirmation coming from a break below $92,600.
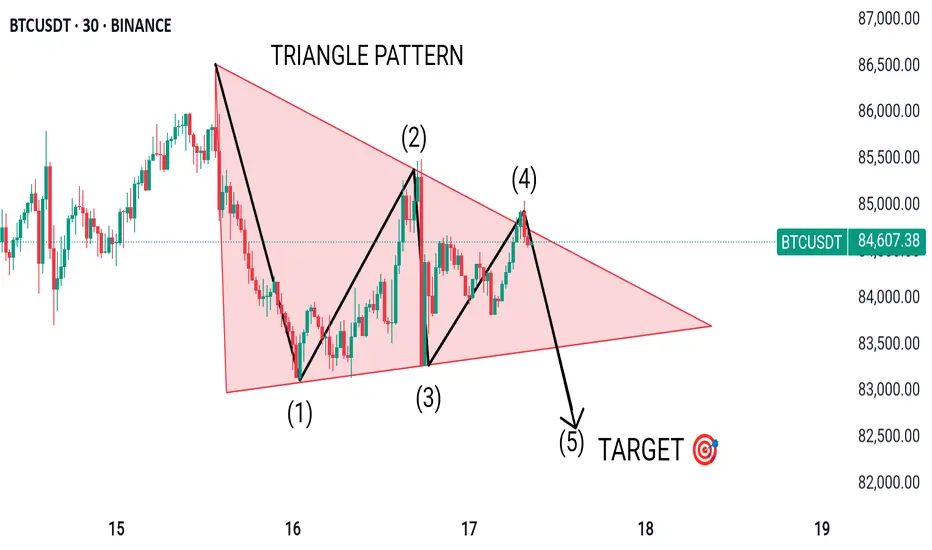
BTCUSDT TRIANGLE PATTERN IN 30-MI Created This BTCUSDT Chart Analysis In 30-M Tf
ENTRY LEVEL. 84600
Resistance zone : 84800
Target Well Be : 82800
BTCUSDT made Triangle Pattern, It's Take Resistance BTC went to Downtrend Soon
BTCUSDT 1D Analysis UpdateBTC ~ 1D Analysis Update
#BTC Alright let's continue this bullish, a minimum of $ 130,000 - $ 150,000 in 2025.
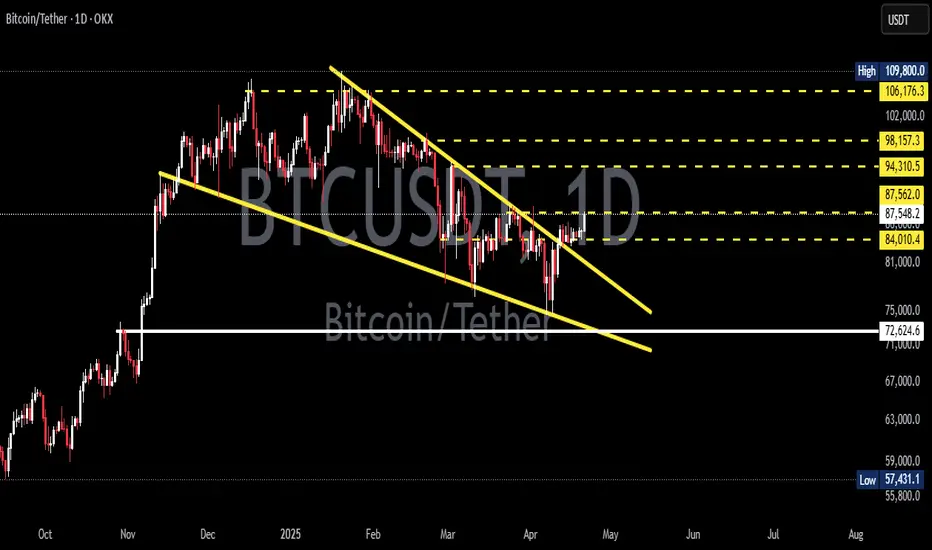
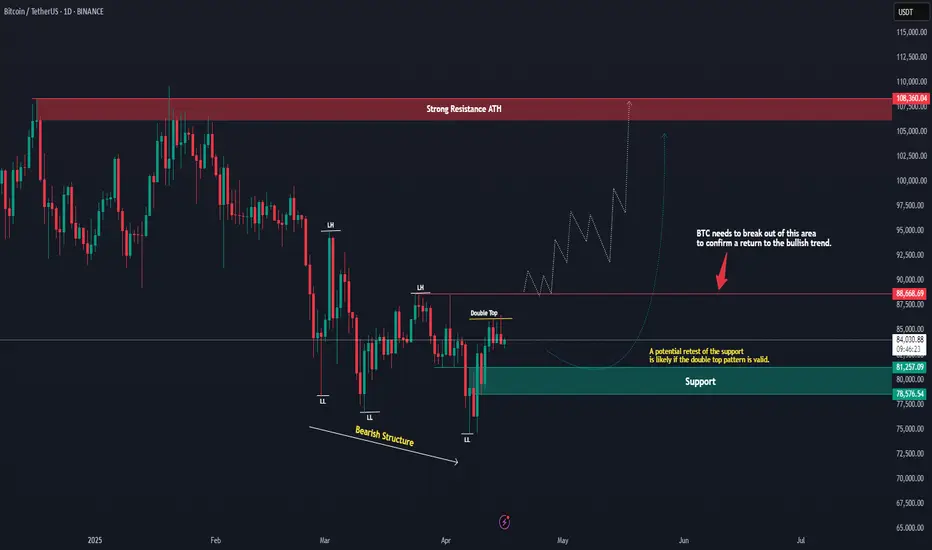
BTCUSDT – Big Move Incoming, Key Level To watch!Bitcoin is approaching a key decision area after a few months of downward pressure. The chart shows a clear bearish structure with lower highs and lower lows. Recently, a possible double top has formed just below the major resistance near 88.668, which could suggest a short-term pullback if buyers don't step in.
If the double top plays out, a retest of the support zone between 78.576 and 82.000 is likely. This zone has held well in the past and could act as a strong base again.
However, if price manages to break and hold above 88668, that would be a strong signal of strength. It could mark a shift back to a bullish trend, with the next major target being the all-time high area around 108.360.
Key areas to watch:
Support: 78.576 to 82.000
Resistance: 88.668 and 108.360
Right now, Bitcoin is at a make-or-break point. A breakout could trigger a strong rally, while rejection may lead to another dip. Stay patient, watch how price reacts at these levels, and let the market confirm the next move.