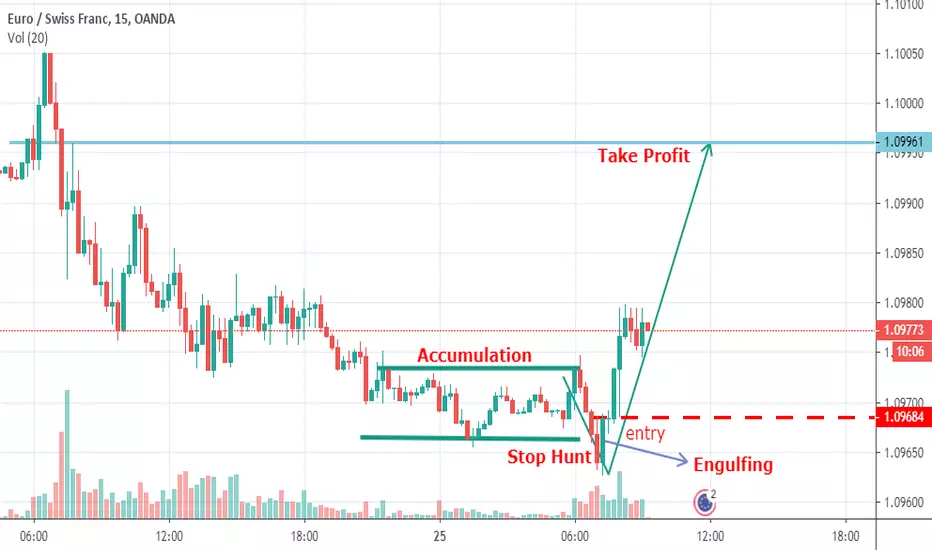
EURUSD long tradeAfter the market has dropped straight down for three days, they have just stop hunted to the low showing a potential rise for the day with a W on the m2 pivot point. Intraday trade we looking at taking profit, towards the 1.09936 level.
Btmm
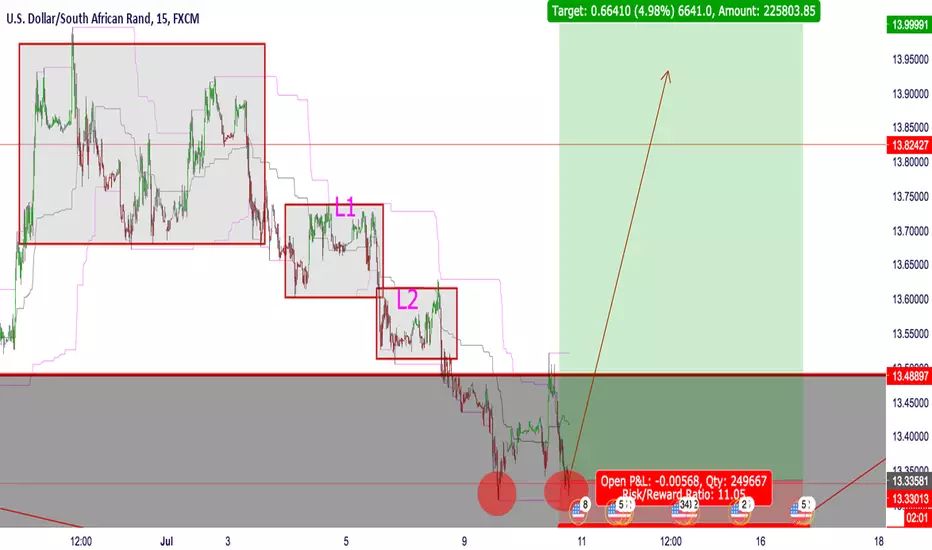
WEEKLY XRPUSD ANALYSIS (CONSOLIDATION BEFORE RISE)TECHNICAL:
Currently, the pattern shows we are in Level 1, after being confirmed with a break 0.46 USD Cents zone, and is now consolidating before moving upwards towards the next Peak at 0.48 Cents USD.
There is a possibility that price action might continue to consolidate downwards towards the KETCHUP (13 EMA), however, if it does that, it will most likely PIN the KETCHUP.
In my opinion, the most probable move will consolidate around the MUSTARD (5 EMA) before moving upwards to complete the Level 2 move up to 0.52 cents area.
This is before another consolidation down to the 0.48 Cents area, before a massive push upwards towards 0.58 cents, possibly even towards the $1.00+ zone at a later date.
FUNDAMENTAL:
There are a huge number of reasons why I forecast this... Here are just a few
* XRP is now being adopted and prepared to be used by some of the largest Asian banks. The SEC court case does not have any standing with banks within Asia when interbank transfers occur, outside of the USA or its jurisdictions.
Thus the sheer volume will push market pressure upwards, once the xRapid/xCurrent service is used in the real market.
* COMEX RULE 589
(NO NOTHING TO DO WITH THE 589 EOY 2018 SILLINESS)
Directly affects the price of XRP in this context, as it is rumored that XRP will be linked to the price of gold. Rumor or not, it has affected the market somewhat already and continues to do so.
* GEOMETRY: We are at the start of a Bull Market, as well as market geometry shows we are about to break out of a major triangle, towards the upside. Usually, breakouts of this magnitude (in the Weekly) will produce spectacular gains
TDI shows RSI is also at level 1 position, although we have a current RSI (at time of writing) of 49.82, coming from the lower part of the RSI map, the market has made a particular move which should show a Bounce off the Blood (which is around the same area as the KETCHUP 13 EMA on the chart), in order to complete the Level 1 marker and progress through to the Level 2 move. The move is still currently AFP (Away From Peak), until we get closer to the confirmation peak area, which was previously broken.
As RSI is in the 40s area, we can also expect continued push upwards towards 80 RSI in the coming months. Remember this is a Weekly chart, not an hourly or daily.
Next chart I will post will be the XRP DAILY, to see if we can get some synergy with both and the overall trend.
###########
DISCLAIMER:
These are my analysis, my opinion, I give no guarantees and I'm not responsible for any losses that you may occur if you trade this, whether you buy crypto or trade it in the CFD market. If you want to trade this chart, do your own analysis and make sure you have a good money management plan in place. If you want to learn more about trading, here is a good place to start: babypips dot com
I generally post my own analysis in BTMM format, although I am proficient in Crypto Patterns, Gartleys, Butterflies, Pattern Trading, Elliott Wave Trading, Pitchfork, Trendline, VSA and Price Action trading, for which I may from time to time post additional analysis including some of these other methods.
I don't answer to bullies, trolls or charlatans. If you want to genuinely debate me, post a proper analysis, but don't post a blank chart with words or claim you are a 'WE' and have some magical algorithm or secret, I will not waste my valuable time to answer you. I'm posting this chart here for my own personal record and to share with those that may appreciate it, with the hope that it can help someone better their life.
###########

BTCUSD ANALYSIS - CURRENTLY SHORTTECHNICALS:
Currently, BTC has completed a Peak Formation High (PFH) with an M pattern and has progressed down to confirm a Level 1 position.
There is a high probability for a good SHORT down towards the MAYO (200 EMA) as well as most likely PIN the BLUEBERRY (800 EMA) before forming a Peak Formation Low (PFL) with a W pattern.
Once it forms the W pattern, we can then LONG it upwards to the next major PFH which would be at around the $11,673 USD Zone.
TDI Indicator also gives me confirmation of these moves, as currently, RSI is outside the LOWER TDI Band at approx 52.65 RSI (At time of writing). It initially looked as if it would form a Shark Fin outside the water, but now there is a very high probability that it will continue downwards to make another cycle on the TDI, possibly to the 40 RSI range or thereabouts, before making another Bullish move upwards to the next peak.
FUNDAMENTALS:
BTC is seeing continued growth and adoption as well as many mining rigs have now been turned on again after the market price rose above the $6,000+ mark. Adoption of bitcoin continues, not only in the crypto marketplace but also in other sectors including commerce. There is no doubt that we are out of the crypto winter (bearish trend), and we are now at the initial stages of a bullish trend.
###########
DISCLAIMER:
These are my analysis, my opinion, I give no guarantees and I'm not responsible for any losses that you may occur if you trade this, whether you buy crypto or trade it in the CFD market. If you want to trade this chart, do your own analysis and make sure you have a good money management plan in place. If you want to learn more about trading, here is a good place to start: babypips dot com
I generally post my own analysis in BTMM format, although I am proficient in Crypto Patterns, Gartleys, Butterflies, Pattern Trading, Elliott Wave Trading, Pitchfork, Trendline, VSA and Price Action trading, for which I may from time to time post additional analysis including some of these other methods.
I don't answer to bullies, trolls or charlatans. If you want to genuinely debate me, post a proper analysis, but don't post a blank chart with words or claim you are a 'WE' and have some magical algorithm or secret, I will not waste my valuable time to answer you. I'm posting this chart here for my own personal record and to share with those that may appreciate it, with the hope that it can help someone better their life.
###########

Sooner or later it needs to pullback Confirmations:
- for about a month now we have gone on a downtrend and market needs to pull back up
- Three pins to the low
- Divergence and price above liquid 50
- price resisting well hesitation zone of the quarter and should retrase back to previous Major Whole Number

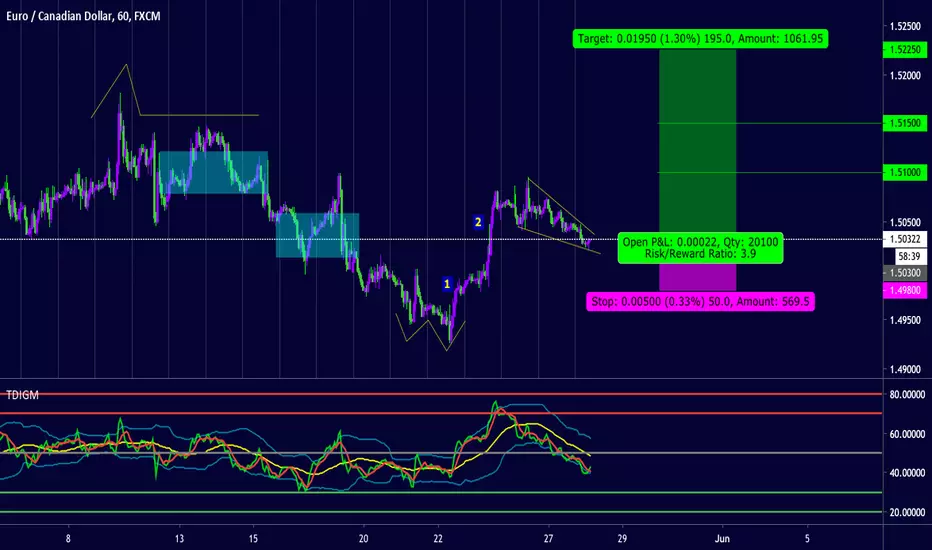
EURCAD Long Typical BTMM strategy
We can see on the charts how last week we had a bearish cycle going down to 1.49250 yet could not break that zone. After that, we made a multi session W formation and today we are coming in to create a wedge that should breakout soon enough to create a new higher high and change momentum for this trade to the upside. Stop is a bit too much in my case but I am hoping for a good long term swing to the upside so If price keeps going up I may even keep this open hopefully.
Confirmations:
- second level rise off a wedge
- price could not break hesitation zone of 1.49250 so it could not go to next quarter, therefore it must go up
- on 4h we see price pinning liquid 50 and baseline so im hoping for a rejection off that key level
- reversal should come in London Session
- price is above large quarter point of 1.50000 and should go up to next quarter point of 1.525000
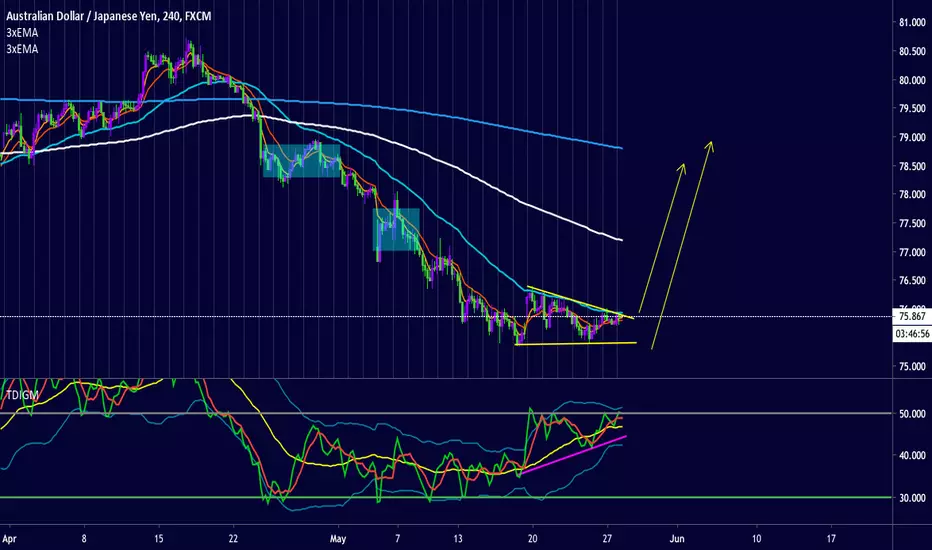
AUDJPY Going long until further noticePrice struggles to make a new lower low and could not reach the quarter level and psychological level of 75.00. We can see a double top formation coming along with ideal divergence after a macro level cycle finished on a wedge that has been occurring for a matter of weeks now. Going to be looking for long opportunities
Confirmations:
- Double Bottom
- Price struggles to make a new low and reach quarter level
- Price divergence on TDI and above liquid 50 (yellow line in TDI)
- macro cycle has finished with 3 long term pushes to the downside
EURAUD macro cycle finished and holding price in large quarterPrice has found resistance in a large quarter point and psychological number of 1.625000. As we can see as well, this correlates with a large macro cycle being finished and made a large M formation between last week and this week. Im looking to enter this coming days as midweek reversal and hold for a long term cycle down for a good 500 pips potentially.
Confirmations:
- divergence on TDI on 4h with first leg above band and second band below liquid 50
- macro cycle has finished and holding current price
- price has finished quarter cycle and held position on 1.62500 and has never past it or made a new high
- price made a new higher low but struggles to make a new higher high and consolidates below the high
- AUD pairs seem to be having a bit of consolidation across the board.
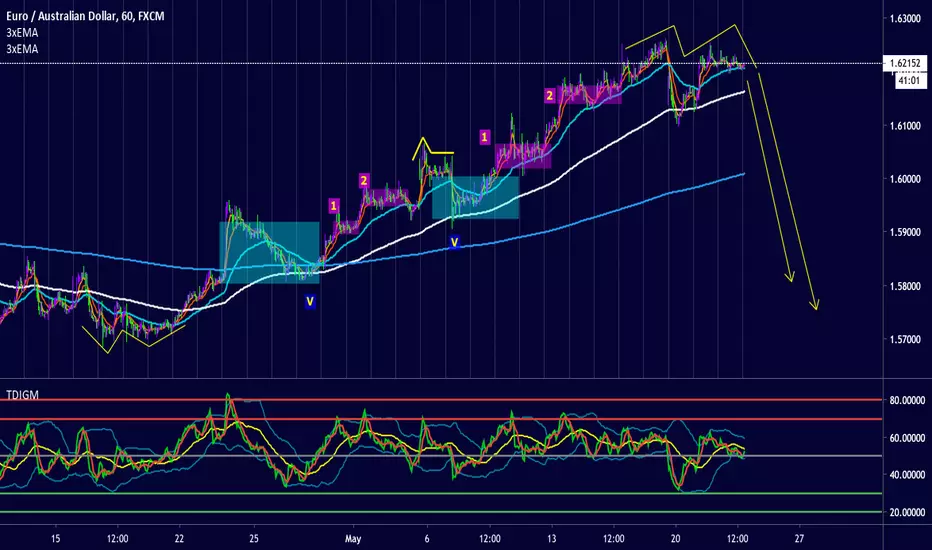
EURAUD for next coming weeks Price has struggled to breach the large quarter point of 1.62500. This coincides with a macro cycle of three pushes that has finished (as can be seen in chart in blue squares) and correlates with finished cycle of micro cycle (pink squares). We have divergence on higher timeframes of TDI which indicate a long term swing. Going to be looking to enter in london
Confirmations:
- 4h divergence with first leg on top of band and second leg below the liquid 50
- respected large quarter point of 1.625000 and created a double top formation
- finished macro cycle indicating a good swing
- micro cycle has finished as well
- price made a new lower high but never made a new higher high after it pinned 1.625
- AUD pairs have been slowing a bit in the past week and we can notice exhaustion in price

Backtesting Quarters Theory BACKTESTING ON A DEMO
NOT TO BE TAKEN SERIOUSLY
- 200 ema and 800 ema have not crossed so we may be seeing one last push down
- two pins off the 200 for a reset
- respected the liquid 50 and is below market baseline
- pointing for the next quarter
3 TPs
- TP1 on hestiation zone @ 1.94250 (90 pips)
- TP2 on half way point @ 1.93750 (130 pips)
- TP3 on large quarter point @ 1.92500 (260 pips)

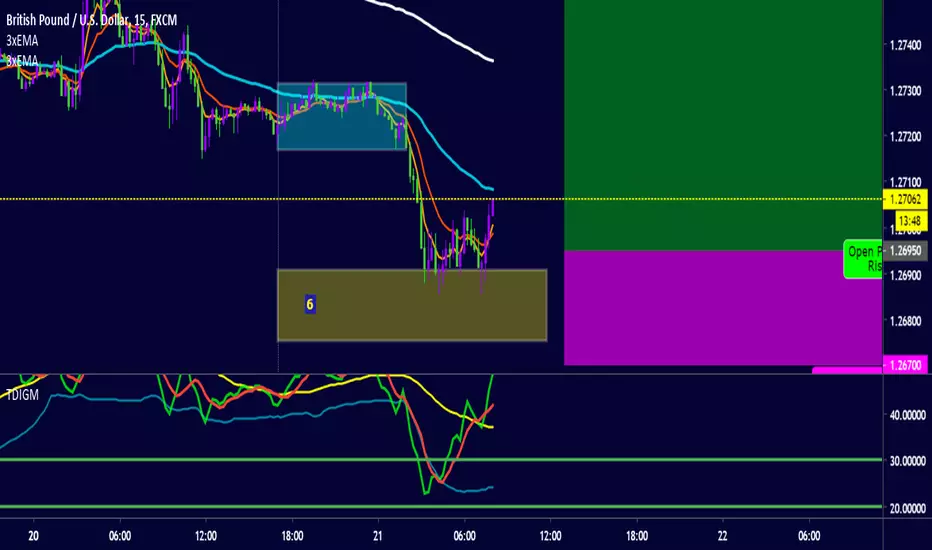
GBPUSD HAS to have a pullback This is the 6th day of drop for GU, this HAS to have some sort of correction and today is the day. Stophunt low with a W is a perfect indication for a buy
ACAD finished cycle and awaits long swing position Pretty self exclamatory really.
Confirmations:
- TDI divergence,
- Level 3 consolidation
- Respected the liquid 50 line (Yellow line in TDI)
- today has done a 3 push down on 15m

EURJPY bias is still to the upside In my past analysis we entered at the wrong time but now in 4h this looks crisp and ready to fly high. Its late in the day but in 4h we have a railroad formation that stopped many people out, and as you can see in my TDI it respected liquidity (yellow line).
Here are my confirmations:
- railroad formation on 4h
- respected liquid 50 (yellow line in TDI)
- divergence in rsi (green line in TDI)
- micro and macro cycles are both on level 3 chop
3 pins to the high and its lights out Finished macro cycle with 3 pins to the high. Note how that giant candle stick's body closed below the high. This news to the upside was to induce retail trader long, stop sellers and trap traders who bought too late. This is just an idea. Not taking this trade honestly because of TDI confluence but yet it is quite possible for it to tumble down in a new cycle to the downside in long term. Gonna see how it unravels in London Session.

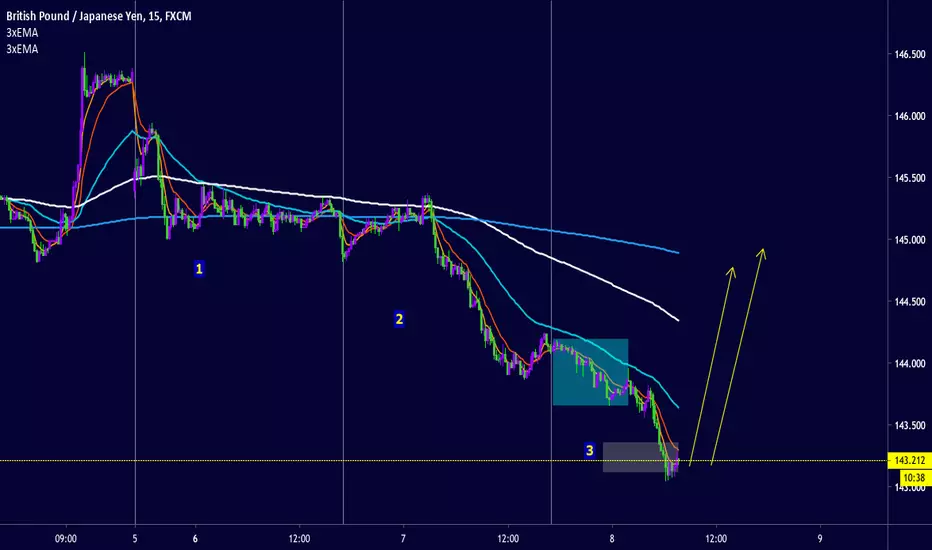
GBPJPY Long 3 day drop and on midweek reversal we see this third drop exceed the ADR LOW and also stophunt to the low.
SL at 20 pips of 143.000
TP1 is 95 pips
TP2 is 140 pips
TP3 is 200 pips
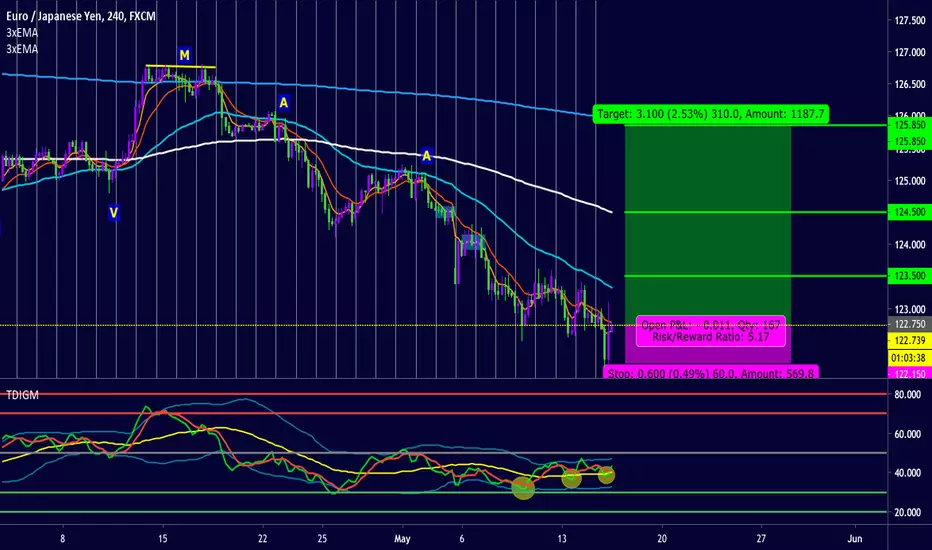
EURJPY reversal is inevitable 33 trade. Macro 3 level drop and on this last push we see 3 levels drop in a matter of days.
with a 33 trade put into play, reversal is inevitable, oh and also.... its Wednesday, meaning midweek reversal. Hopefully this will play out to all my TPs

EURUSD going for an aggressive bull run This start of the week has been nothing but bulls for the EURUSD. We are currently seeing it at level 2 rise. The only way I would enter this trade is if we see it go down now in London to the EMA or stophunt low rise. If these 2 scenarios are correct then we should be seeing it go back up for a 3rd aggressive push to the 800 ema in time for mid week reversal hopefully

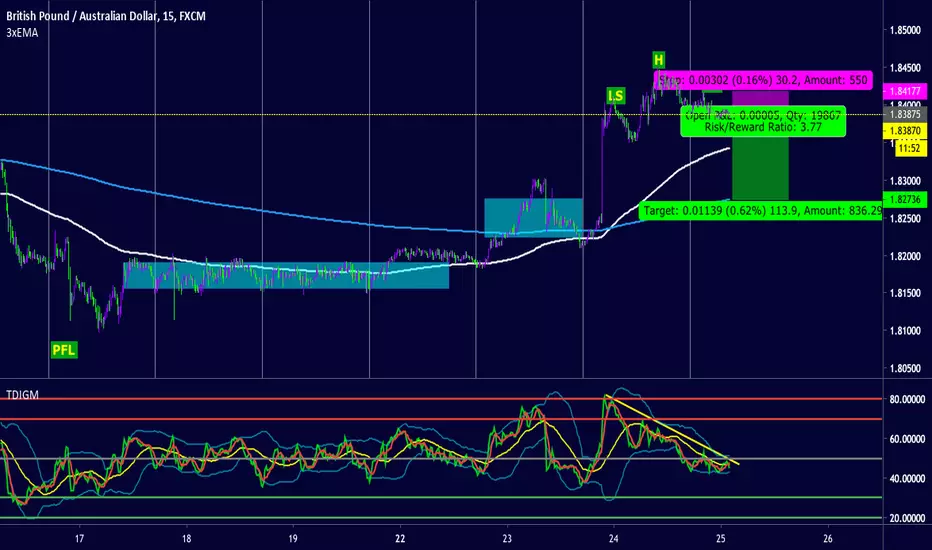
GBP weakness hello everybody! First trade pair I ever send publicly on Tradingview.com!
What we are seeing on GBPAUD is that all GBP pairs are showing weakness though-out the board. 6 days we had a start of a new cycle and that has finished today with that 3rd aggresive push off news. Today we are seeing a good divergence and RSI below market baseline (Grey line in my tdi) that also shows us a Head and shoulders formation. Im riding this for a good 100 pip TP with a 30 pip SL so a 1:3 ish risk to reward is always ideal. Hope you enjoy!
RIPPLE XRP - MARKET PROGRESSION LONG - (UPDATE)Here is an update to my previous analysis.
XRP has been progressing through the consolidation zone and has finally dropped below the previous Daily chart level 1 marker, thus making this retracement significantly deep, as it has currently retraced almost 80% of the initial Level 3 move. In the last 24 hours, price has bounced off major support zone (flip zone) and is currently forming a W (Level 3) on the 4 hour chart, where we can expect a bullish trend to ensue from here on in.
However before we can confirm this, there may be an additional reset which would take the price even lower to around the 0.33 ~ 0.34 cent area. I consider that move to be highly unlikely, but still possible.
The reason for my consideration are:
1) The manipulation pattern has completed on a higher timeframe, even in Daily should we get a confirmation of Level 1 move, it will continue upwards.
2) The W pattern is in progress on the 4 hourly, we can expect with high probability, that it will form a level 1 pattern which once confirmed, will signify the bullish trend continuation.
3) Looking at the 'TDI', where 'RSI' low point was 9.9 RSI, (with current RSI setting at 10) and has formed a W
4) 'RSI' has made a sharkfin as well as a W, outside of the Lower 'TDI' band.
5) Fast 'MA' (Fast Moving Average) - (Red Colour) has hit the Lower TDI band.
All of these are prime for a super high probability bullish move/continuation.
Note: In lieu of the current high volume dumping of Futures Contracts against Bitcoin (See twitter channel here for live updates: t.me), because XRP is currently correlated with bitcoin, we will see similar movements on XRP, until as such time as XRP is decoupled from bitcoin, which shouldn't be far away, I'm expecting that to happen after the 11th of November.
----------------------------------------------------------------------------------------------------------------------------------------------------------
Obviously, nobody can tell the future and trading is a game of probability based on previous structure, fibonacci measurements, experience etc...
Sure anyone can disagree with my analysis, but don't just say you disagree, show me your analysis. However don't be surprised if I don't reply, I'm not interested in debating with people, because it seems Tradingview is full of trolls lately and altcoin fanboys who treat trading and crypto coins like barracking for football teams. I'm a professional full time trader, I live from trading, I make money from trading. I don't care about the name of a coin or currency pair, I just care about making money, and I make a lot of it because I know what I'm doing.
----------------------------------------------------------------------------------------------------------------------------------------------------------
DISCLAIMER: This chart is for sharing and educational purposes only and is not intended to be a signal service or similar.
This chart analysis is only provided as my own opinion, based on my own analysis and comes with absolutely no warranty that this analysis is correct, whatsoever. Do not trade this chart if you do not have your own strategy. Trade only with your own strategy at your own risk. Plan your trade and trade your plan... and IF in doubt, stay out.
.....::::: If you like this chart, please click on the THUMBS UP! :::::.....
----------------------------------------------------------------------------------------------------------------------------------------------------------

RIPPLE XRP - Market Progression - LONGRipple has made 2 breakouts from structure and is on it's way to perform the first part of a wave 1 impulse wave.
Through wave one we should see 3 impulses in total and 2 consolidations/corrections.
See my previous analysis back on the 14th of March 2018 (almost 7 months ago).
Although current pricing, to some inexperienced amateurs, may seem like it is reversing... it is not !
The pricing is still within the consolidation zone, as I've marked on the chart. You can see the current price (at the time of writing) is still 8 cents above the low. The level count on this current move is Level 1, and should confirm this once the high is broken, possibly within the next 1 to 3 days.
'TDI' (Traders Dynamic Index) shows that the 'RSI' (Relative Strength Index) is currently at 59 and is close to the center of the bands, where I'm expecting it to bounce again for the next move to Level 2 and Level 3, before the first correction as Elliot wave 2 begins, at around $1.40. Sure it could be lower and it could be higher.
Most likely when Level 1 confirms (means it will break the previous high), it will be a bigger move than from Level 3 'PFL' (Peak Formation Low) to the previous high, thus passing the 80 cents mark. Patience is a virtue as well as removal of emotion, especially in trading. Let the market play out, don't listen to FUD, there are a lot of XRP/Ripple haters out there, I don't understand why, especially if the coin can make you money.
XRP is the only coin, thus far, to have a solid company behind it, has been in development longer than BTC and has a solid business model with contracts signed and already customers using the technology. It costs peanuts to transfer XRP, unlike BTC or any other coin, XRP is faster transfer than BTC and has a real world use, currently with several banks, many more coming online daily, which will ultimately help push daily volume into the trillions. XRP currently has 2nd place in coinmarketcap and I am expecting it to increase even more to eventually take over 1st place. Binance.com has reported yesterday, that XRP volume has surpassed BTC volume, therefore it is only a matter of time until XRP will be the number one coin with the biggest market cap. It will make holders of XRP a huge amount of money, what could be bad about that.
Don't be an amateur, be a professional, look at the charts, understand the charts and act accordingly.
Obviously, nobody can tell the future and trading is a game of probability based on previous structure, fibonacci measurements, experience etc...
Sure anyone can disagree with my analysis, but don't just say you disagree, show me your analysis. However don't be surprised if I don't reply, I'm not interested in debating with people, because it seems Teamviewer is full of trolls and altcoin fanboys who treat trading and crypto coins like barracking for football teams. I'm a professional full time trader, I live from trading, I make money from trading. I don't care about the name of a coin or currency pair, I just care about making money, and I make a lot of it because I know what I'm doing.
----------------------------------------------------------------------------------------------------------------------------------------------------------
DISCLAIMER: This chart is for sharing and educational purposes only and is not intended to be a signal service or similar.
This chart analysis is only provided as my own opinion, based on my own analysis and comes with absolutely no warranty that this analysis is correct, whatsoever. Do not trade this chart if you do not have your own strategy. Trade only with your own strategy at your own risk. Plan your trade and trade your plan... and IF in doubt, stay out.
.....::::: If you like this chart, please click on the THUMBS UP! :::::.....
----------------------------------------------------------------------------------------------------------------------------------------------------------


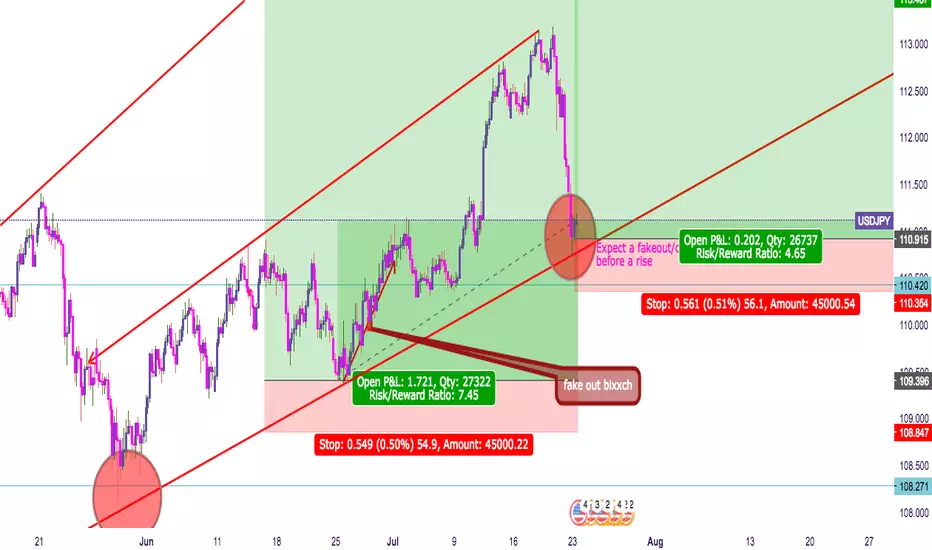
USDJPY H4 BTTMMPrice touhed the H4 lower trendline.
We are officaslly on level 2 on the Macro cycle.
Expect price to consolidate for abit before we see the biggest push of the year.
Mark my words