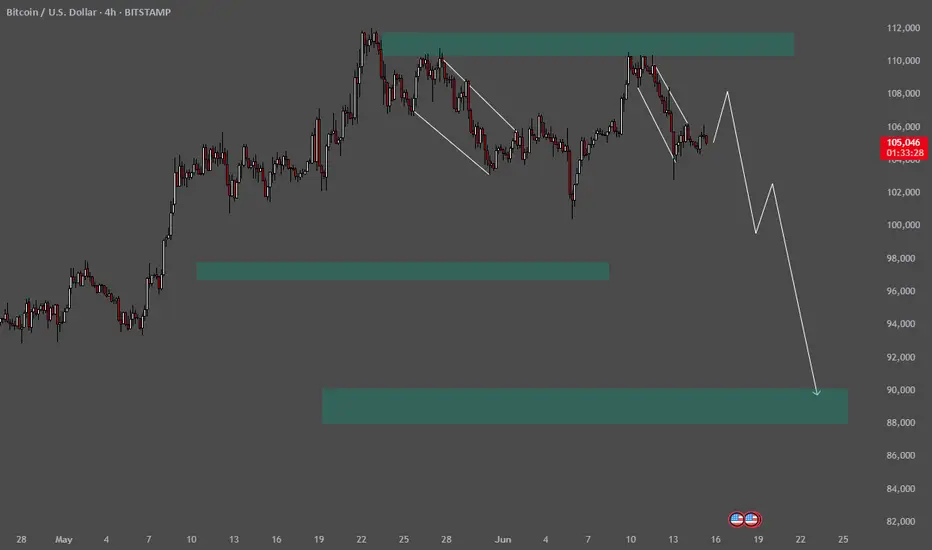
Support (Demand Zone): Around $90,000 — the projected downside .✅ Current Market Structure:
We’re seeing lower highs and lower lows, which typically signals a downtrend.
The price recently fell from a resistance zone (marked in green) near $110,000.
Currently, we’re bouncing upward (forming a small correction) before a potential further drop.
✅ Key Levels:
Resistance (Supply Zone): Around $108,000–$111,000 — strong selling pressure here.
Support (Demand Zone): Around $90,000 — the projected downside target.
The price might break down toward that $90,000 range after a small upward correction.
✅ Expected Scenario:
The price may rebound toward $106,000 or even up toward $108,000 (forming a lower high), then reverse and continue its descent toward $100,000, and ultimately toward $90,000.
This forms a zig-zag down — a classical downtrend structure with lower tops and lower bottoms.
✨ If you’d like, I can:
Provide entry, stop-loss, and take-profit for a short trade.
Perform a more granular technical analysis with indicators (RSI, MACD, or Fibonacci).
Btsusdshort
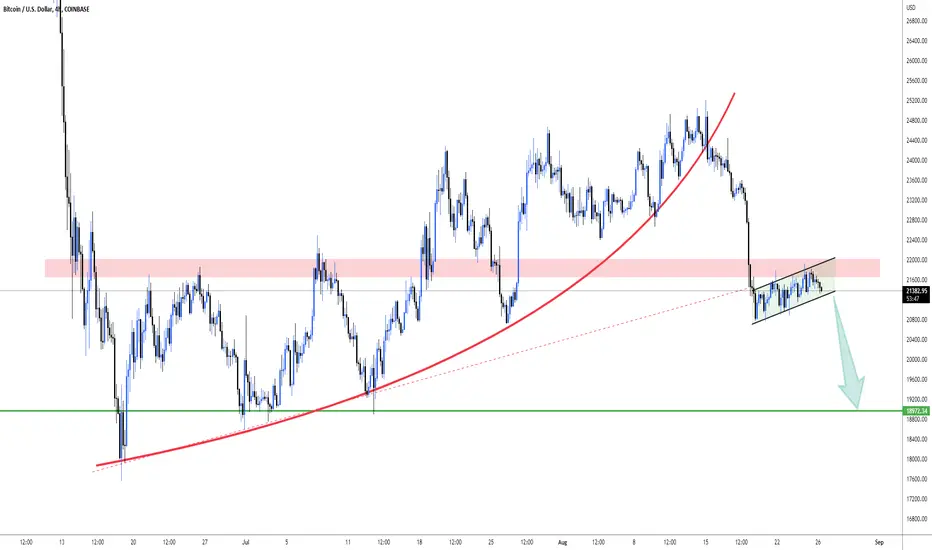
BTC : A Short opportunityJust Keeping things simple here... BTC Looks as a Bear flag ready to break low. Invalidation will be a breakout to the upper side.
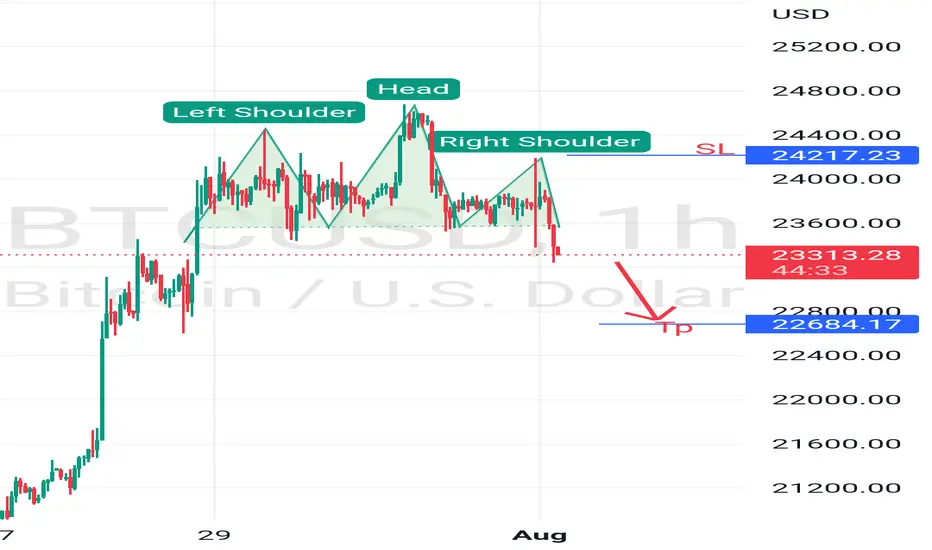
BTCUSD Bearish Potential BTUSD has formed a Head and shoulders pattern now price break the neck line
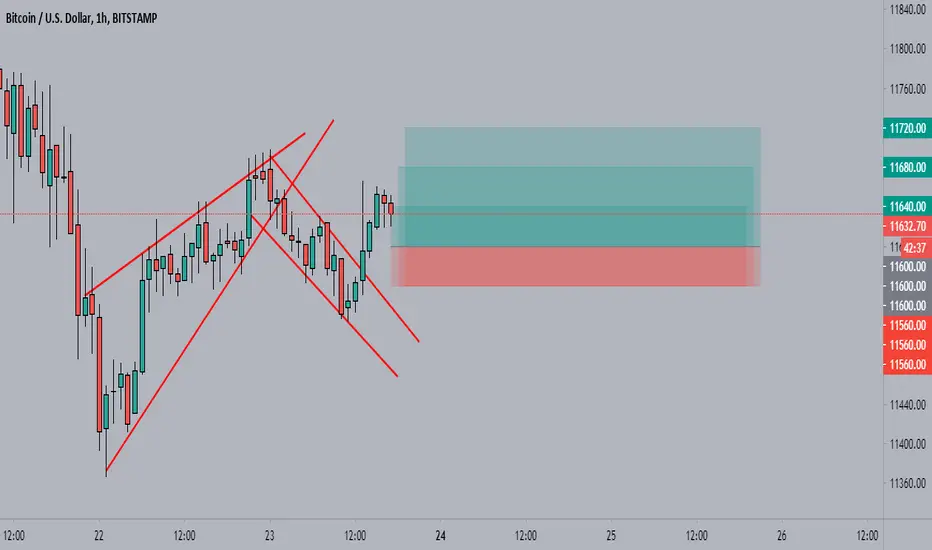
BTC/USDTHello Traders
#BTC / #USDT chart
This is our suggested position for 1H on #BTC
Set your stop loss and enjoy that
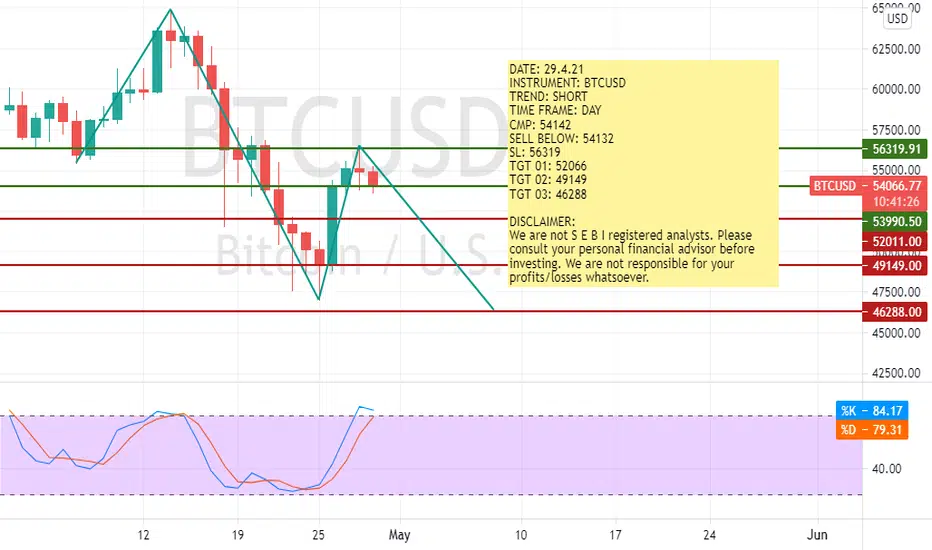
BTCUSD ::: SHORTDATE: 29.4.21
INSTRUMENT: BTCUSD
TREND: SHORT
TIME FRAME: DAY
CMP: 54142
SELL BELOW: 54132
SL: 56319
TGT 01: 52066
TGT 02: 49149
TGT 03: 46288
DISCLAIMER:
We are not S E B I registered analysts. Please consult your personal financial advisor before investing. We are not responsible for your profits/losses whatsoever.
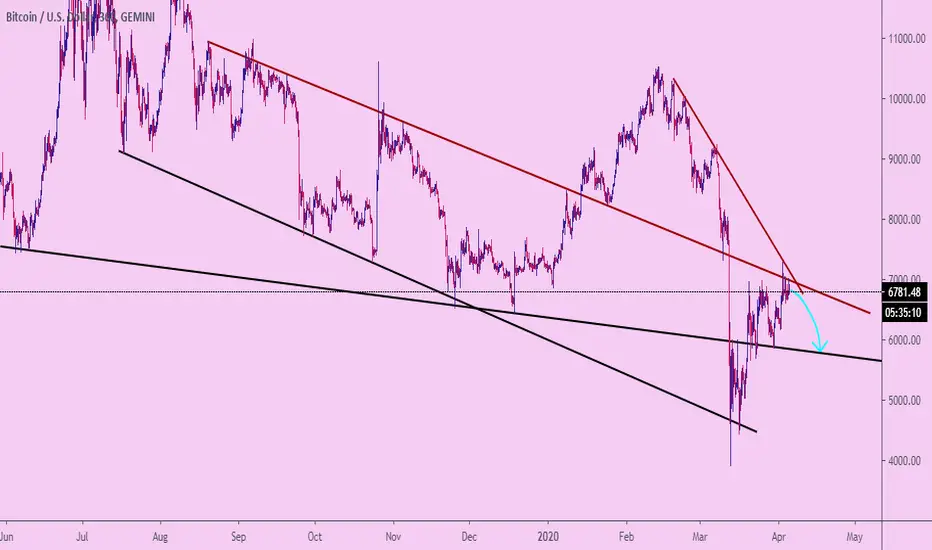
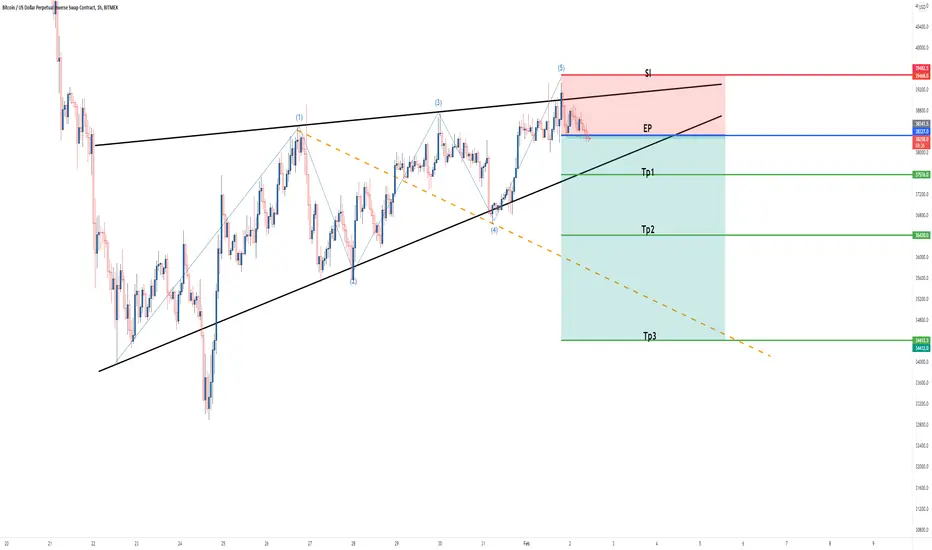
BTSUSD get to 5800 ???After analyzing BTCUSD, we see that a month ago the price reached the lower level of the channel, after which Bitcoin reached the upper line of the channel and made a false breakdown to the upper resistance line. Now the price is at the intersection of two resistance lines, one of which is strong. In addition, analyzing the chart for a long time, we see that the trend is falling. Therefore, at the moment I expect the BTCUSD to fall to the support line ≈5800.