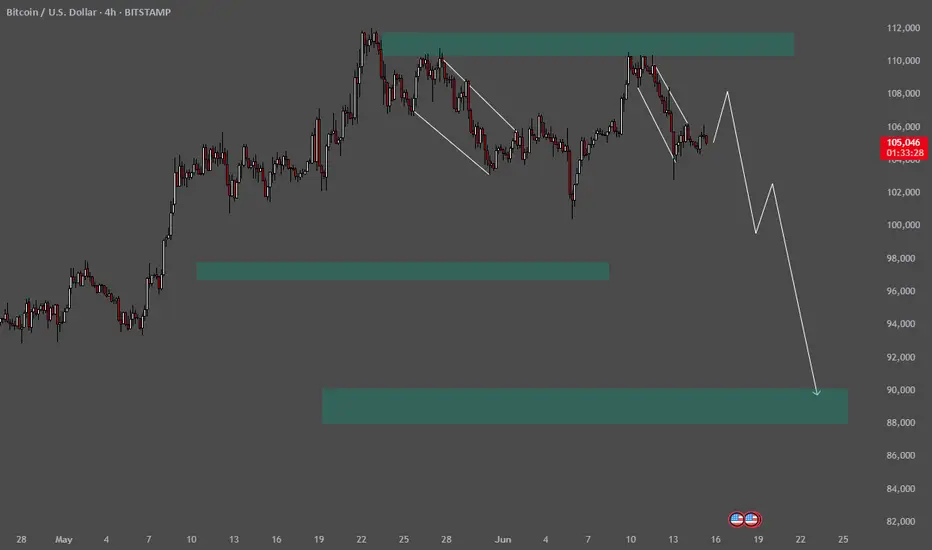
Support (Demand Zone): Around $90,000 — the projected downside .✅ Current Market Structure:
We’re seeing lower highs and lower lows, which typically signals a downtrend.
The price recently fell from a resistance zone (marked in green) near $110,000.
Currently, we’re bouncing upward (forming a small correction) before a potential further drop.
✅ Key Levels:
Resistance (Supply Zone): Around $108,000–$111,000 — strong selling pressure here.
Support (Demand Zone): Around $90,000 — the projected downside target.
The price might break down toward that $90,000 range after a small upward correction.
✅ Expected Scenario:
The price may rebound toward $106,000 or even up toward $108,000 (forming a lower high), then reverse and continue its descent toward $100,000, and ultimately toward $90,000.
This forms a zig-zag down — a classical downtrend structure with lower tops and lower bottoms.
✨ If you’d like, I can:
Provide entry, stop-loss, and take-profit for a short trade.
Perform a more granular technical analysis with indicators (RSI, MACD, or Fibonacci).
Btsusdtrade
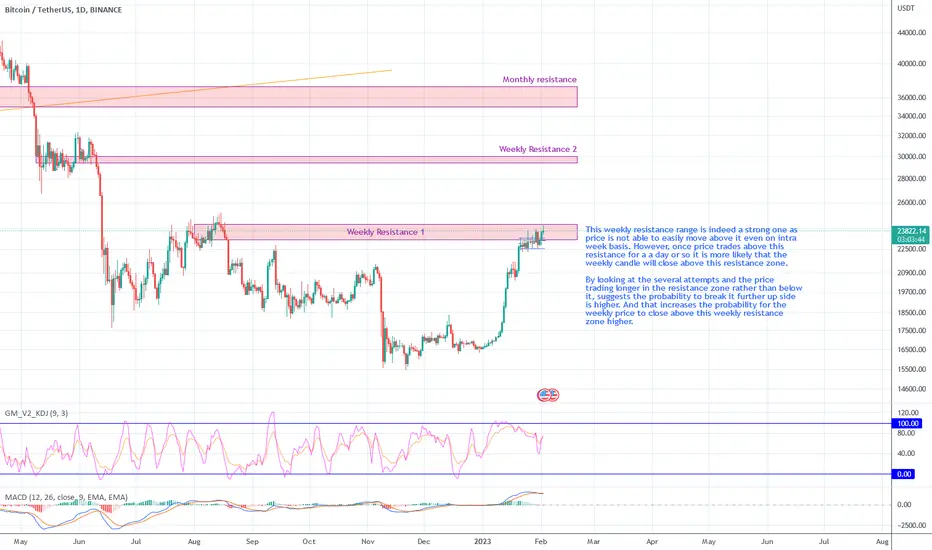
BTCUSDT trading inside weekly resistance zoneThis weekly resistance range is indeed a strong one as price is not able to easily move above it even on intra week basis. However, once price trades above this resistance for a a day or so it is more likely that the weekly candle will close above this resistance zone.
By looking at the several attempts and the price trading longer in the resistance zone rather than below it, suggests the probability to break it further up side is higher. And that increases the probability for the weekly price to close above this weekly resistance zone higher.