XAUUSD – Mid-Channel Rejection Near Key Supply ZoneGold has made an impressive recovery off the $3,250 zone, pushing back into the $3,380–$3,390 region — a key supply area which previously led to strong sell-offs.
We’re now sitting at the upper boundary of a 1H ascending channel and just under a significant resistance area seen on the 4H and daily timeframes.
Although bullish momentum is still present, price is showing early signs of exhaustion at this level — with small rejections forming and volume beginning to taper off.
The key zone to watch is $3,384 – $3,390. If price fails to break and close above this zone cleanly on the 4H, we may see a corrective pullback back toward the midline of the channel — or even a full retest of the lower boundary near $3,305 or $3,268 depending on momentum.
Bias: Short-term bearish / corrective – waiting for confirmation of rejection or bearish candle formation below $3,384.
Builtnotbegged

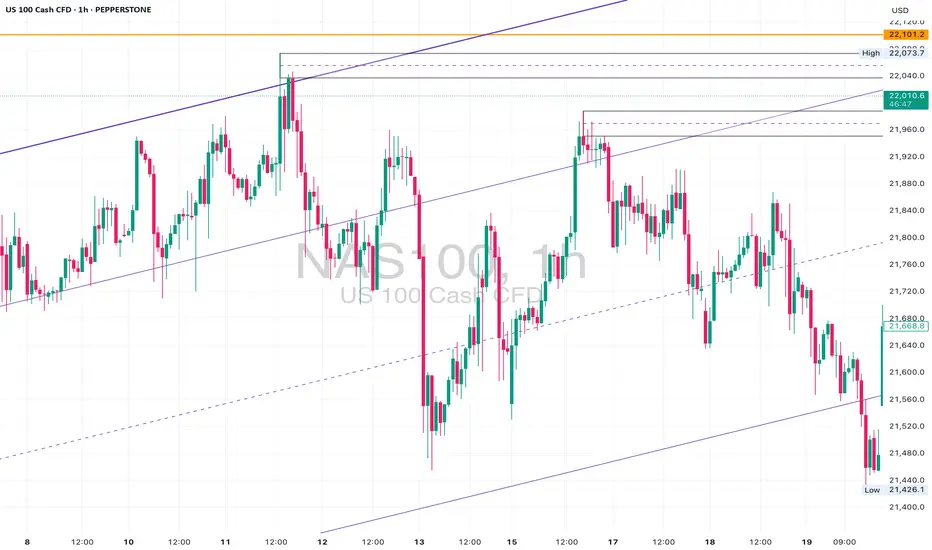
NAS100 Analysis – Structure Breakout or Trap?📍 Levels Marked: 22,101 Resistance | 21,880 Mid-Level | 21,375 Channel Support
⸻
📊 Technical Breakdown:
The NAS100 has surged into the 22,000+ range, breaking above the mid-level channel boundary after consolidating beneath it for days. This breakout takes us right back into an untested supply zone from March.
On the lower timeframes (1H & 23min), price cleanly cleared multiple lower highs with aggressive bullish momentum, printing a new intraday high at 22,015. However, structure is still trapped inside a long-term ascending channel on the 4H and D1 — and this move could be setting up a liquidity grab before reversal.
Key zone to watch:
• 22,101 – 22,200 (daily resistance + equal highs)
• 21,880 – 21,920 (possible retest zone)
• 21,375 (channel base support)
⸻
📉 Trade Ideas:
• Short Bias if price rejects the 22,100–22,200 area with bearish confirmation on lower timeframes. Target: 21,800 – 21,600.
• Long Bias only if price gives a bullish retest of the 21,880–21,920 zone with clean structure. Target: 22,222+ with tight risk.
⸻
💡 Final Thoughts:
A textbook case of a channel edge breakout — but breakout or fakeout? Always wait for confirmation and let structure guide the setup. We’re either about to print new highs or see a sharp correction.
📌 Mark your levels. Watch the retest. Execute with confidence.
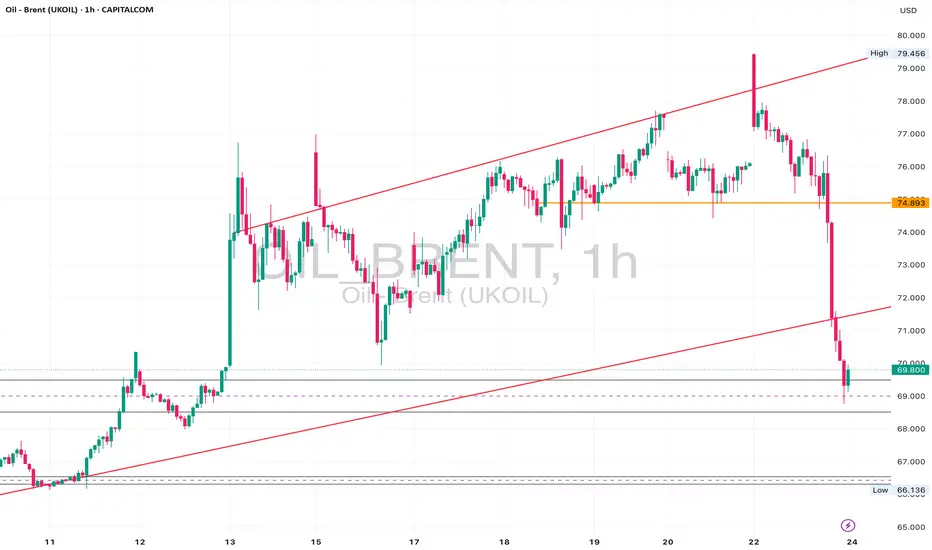
Brent Oil Breakdown – Rejection & Freefall From Channel HighsBrent Oil delivered a textbook reversal last week.
After weeks of climbing within a rising channel, price printed a strong rejection wick at the upper boundary (~$79.45), then followed through with a violent sell-off, slicing through structure and breaking the channel cleanly.
🔍 Key Levels:
• Rejection High: $79.45
• Structure Break: $74.89 (former support, now resistance)
• 4H Demand Zone: $66.00–$69.00
• Daily Demand Confluence: Aligned with 4H zone
On the 1H and 23min, we’re now seeing price trying to stabilise above $69.80 — right on top of the 4H and daily zone confluence.
📉 Bias:
Currently bearish below $74.89.
A clean retest of that level could offer continuation entries.
However, price is now in a high-probability reaction zone, so intraday longs are possible if price shows strength above $70.
⛽ Watch For:
• Bullish price action around $68.50–$70.00
• Weak retracements into $72–$73 for potential short entries
• Break below $66.00 could open floodgates back toward $63 and $60.00
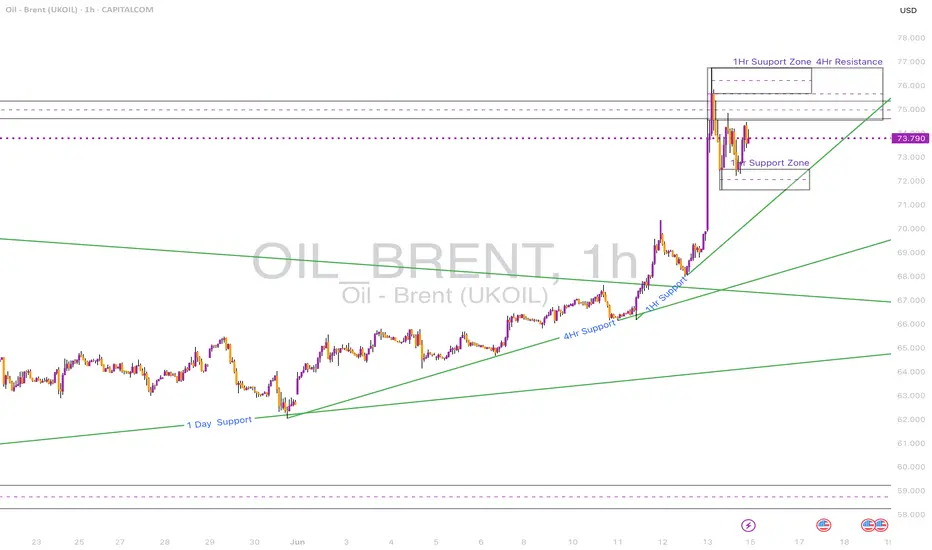
Brent Crude Hits Key Supply Zone After BreakoutPrice has aggressively broken out from the descending wedge and reached a strong 4H & 1D resistance zone between 74.50–76.00.
• 1D Chart: Sharp breakout from long-term descending trendline. Approaching resistance from Feb-April supply area.
• 4H Chart: Bullish structure confirmed by higher lows and breakout of ascending channel.
• 1H & 23m Chart: Consolidating beneath resistance, forming a triangle structure.
Key Zones:
• Support: 71.50–72.00
• Resistance: 74.50–76.00
Bias: Neutral short-term (range). Bullish if 76 is broken and held.
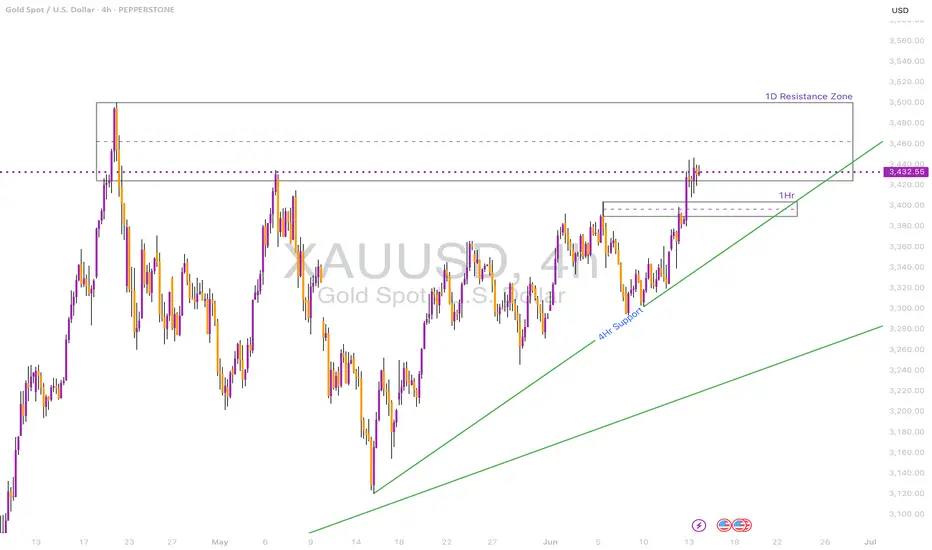
Gold Testing Daily Resistance – Will the Breakout Hold?Gold is currently testing a major 1D resistance zone at 3432–3450 after a strong bullish move.
• 1D Chart: Price has rallied back into the resistance zone after bouncing from ascending trendline support.
• 4H Chart: Strong momentum candle broke through the prior 4H resistance zone at ~3360, confirming bullish pressure.
• 1H & 23m Chart: Price is holding within a bullish channel, but showing signs of consolidation under key resistance.
Key Zones:
• Support: 3380 / 3360
• Resistance: 3432–3450
Bias: Bullish above 3360. Needs daily close above 3450 for continuation.
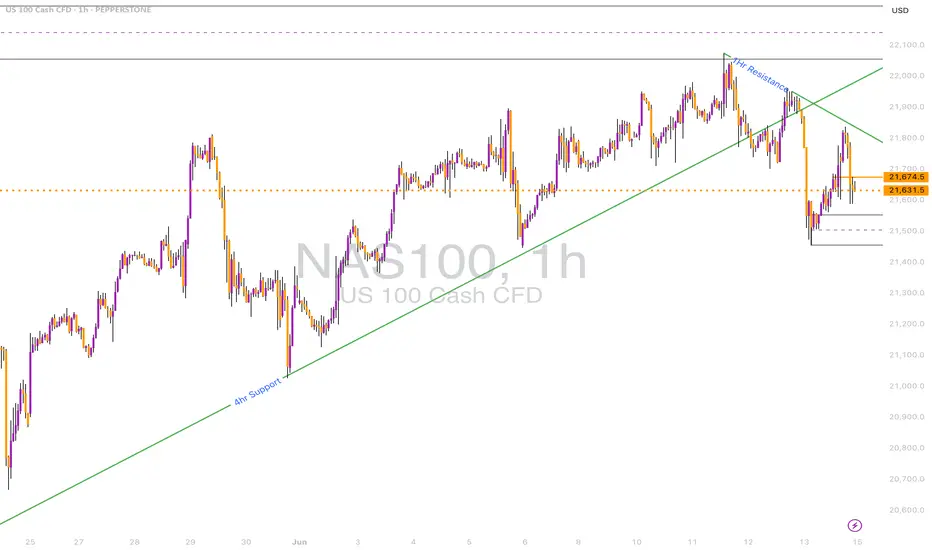
NASDAQ Pullback or Reversal? Watching 4H Support ZonePrice is reacting from the 1D resistance zone around 21,950 and now hovering near a 4H support zone at ~21,520.
• 1D Chart: Long wick rejection from resistance.
• 4H Chart: Break of rising wedge and rejection from 1H trendline.
• 1H & 23m Chart: Clear bearish order block formed. Price consolidating under broken structure.
Key Zones:
• Support: 21,500 / 21,325
• Resistance: 21,900 / 22,000
Bias: Bearish below 21,750. Retest of support expected.