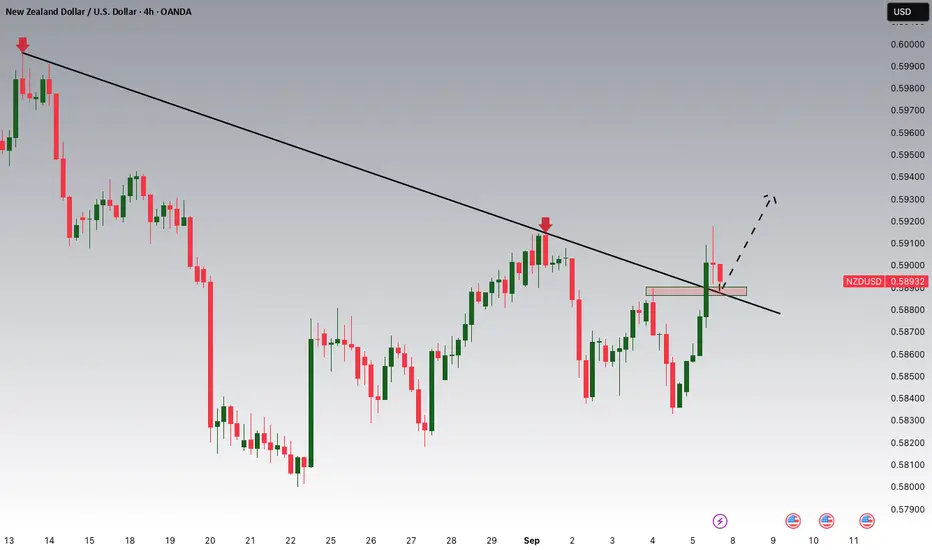
NZDUSD Breakout and Potential RetraceHey Traders, in tomorrow's trading session we are monitoring NZDUSD for a buying opportunity around 0.58900 zone, NZDUSD was trading in a downtrend and successfully managed to break it out. Currently is in a correction phase in which it is approaching the retrace area at 0.58900 support and resistance zone.
Trade safe, Joe.
Bullish Patterns
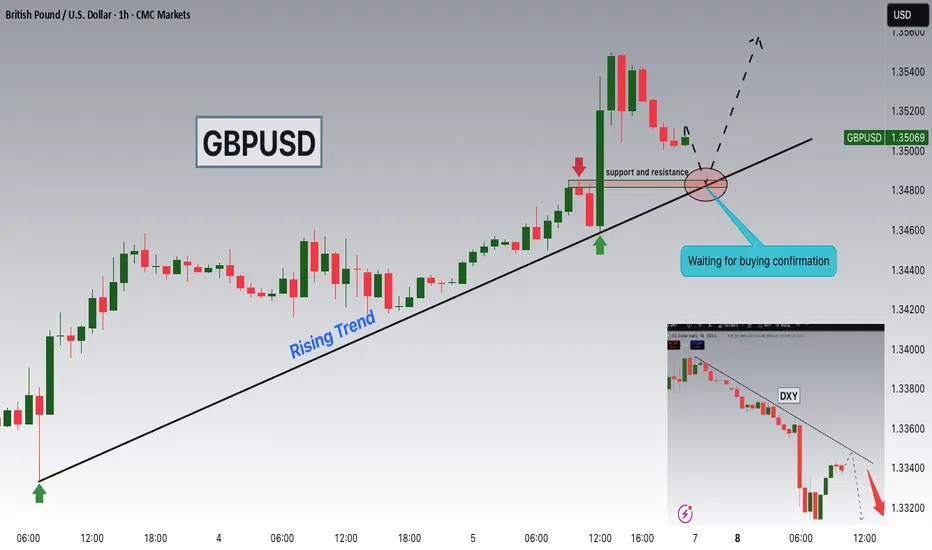
GBPUSD Pullback Toward 1.34800 as Dollar Struggles on Soft DataHey Traders, in today's trading session we are monitoring GBPUSD for a buying opportunity around the 1.34800 zone. The pair is trading in an uptrend, with price currently in a correction phase as it approaches this key support/resistance level.
Structure: The broader bias remains bullish, though price is retracing after recent highs.
Key level in focus: 1.34800 — a significant area where buyers may look to re-enter in line with the trend.
Fundamentals: The U.S. Dollar Index (DXY) is approaching 97.850 resistance while struggling to push higher following a series of softer data releases. Most notably, the recent soft CPI print has increased expectations for potential rate cuts, keeping pressure on the dollar and supporting GBPUSD’s upside outlook.
Trade safe,
Joe.
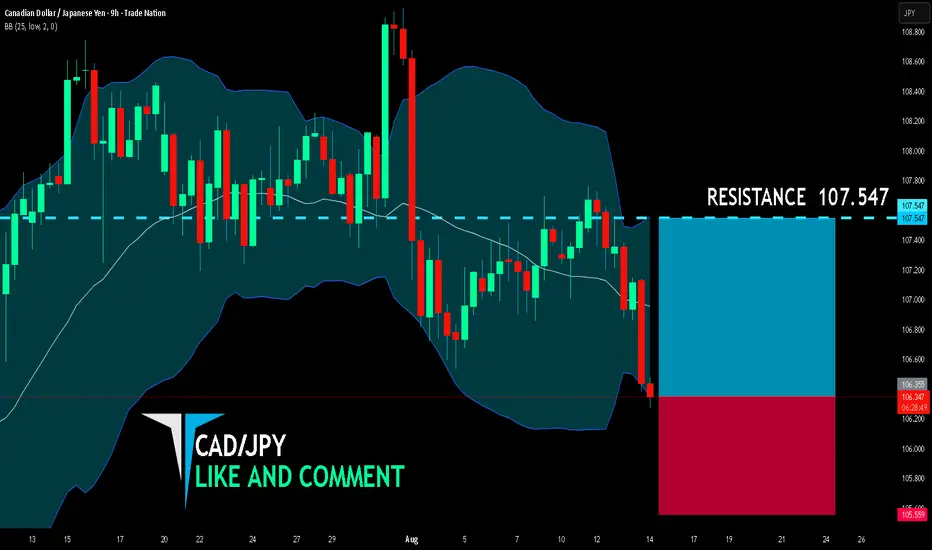
CAD/JPY BULLISH BIAS RIGHT NOW| LONG
CAD/JPY SIGNAL
Trade Direction: short
Entry Level: 106.355
Target Level: 107.547
Stop Loss: 105.559
RISK PROFILE
Risk level: medium
Suggested risk: 1%
Timeframe: 9h
Disclosure: I am part of Trade Nation's Influencer program and receive a monthly fee for using their TradingView charts in my analysis.
✅LIKE AND COMMENT MY IDEAS✅
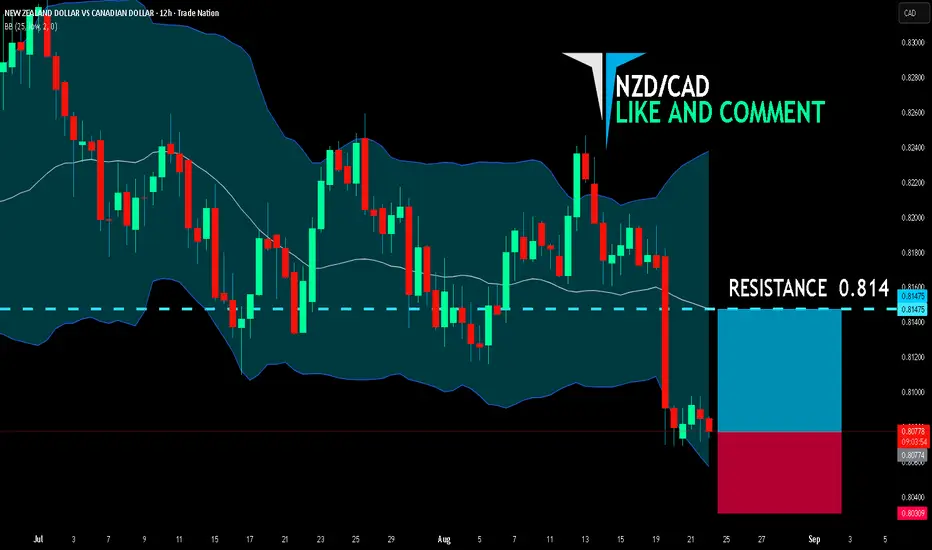
NZD/CAD LONG FROM SUPPORT
NZD/CAD SIGNAL
Trade Direction: long
Entry Level: 0.807
Target Level: 0.814
Stop Loss: 0.803
RISK PROFILE
Risk level: medium
Suggested risk: 1%
Timeframe: 12h
Disclosure: I am part of Trade Nation's Influencer program and receive a monthly fee for using their TradingView charts in my analysis.
✅LIKE AND COMMENT MY IDEAS✅
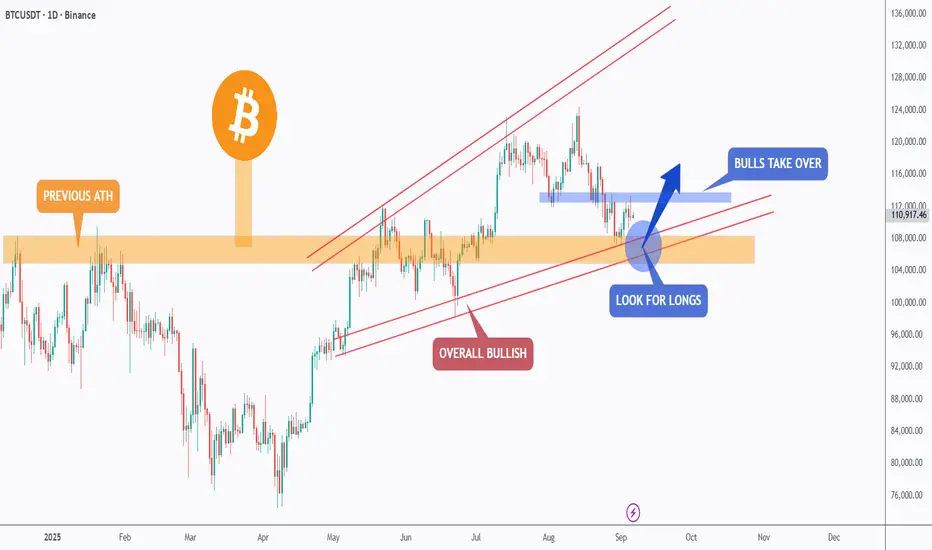
BTC – Bulls Guarding the Key Zone!Bitcoin is retesting a major support zone 🛡️ that overlaps with the previous ATH breakout level.
This area has been acting as a strong demand zone, keeping the overall structure bullish despite recent corrections.
As long as this zone holds, we will keep looking for long opportunities 📈, with the next wave of momentum likely pushing BTC higher. If the bulls manage to reclaim the minor resistance ahead, we could see them fully take over and drive price back into an upward rally.
For now, this zone remains a crucial pivot — watch closely for bullish confirmation signals.
⚠️ Disclaimer: This is not financial advice. Always do your own research and manage risk properly.
📚 Stick to your trading plan regarding entries, risk management, and trade execution.
Good luck!
All Strategies Are Good; If Managed Properly!
~Richard Nasr
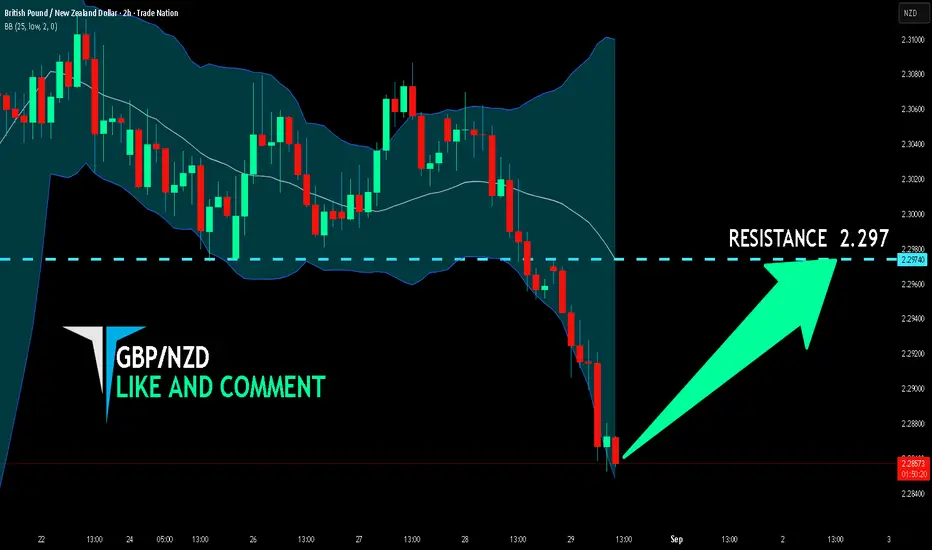
GBP/NZD BULLS WILL DOMINATE THE MARKET|LONG
Hello, Friends!
GBP/NZD pair is trading in a local uptrend which know by looking at the previous 1W candle which is green. On the 2H timeframe the pair is going down. The pair is oversold because the price is close to the lower band of the BB indicator. So we are looking to buy the pair with the lower BB line acting as support. The next target is 2.297 area.
Disclosure: I am part of Trade Nation's Influencer program and receive a monthly fee for using their TradingView charts in my analysis.
✅LIKE AND COMMENT MY IDEAS✅
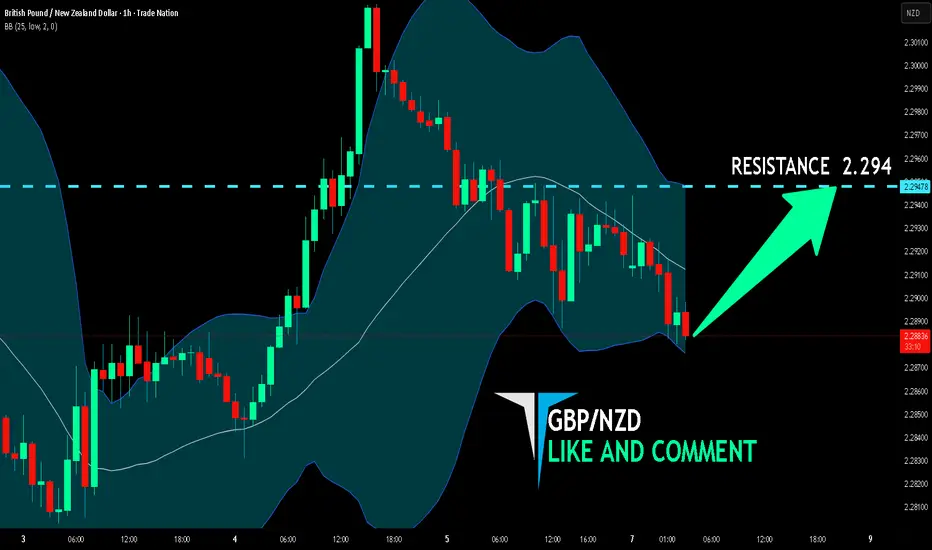
GBP/NZD BULLS ARE STRONG HERE|LONG
Hello, Friends!
It makes sense for us to go long on GBP/NZD right now from the support line below with the target of 2.294 because of the confluence of the two strong factors which are the general uptrend on the previous 1W candle and the oversold situation on the lower TF determined by it’s proximity to the lower BB band.
Disclosure: I am part of Trade Nation's Influencer program and receive a monthly fee for using their TradingView charts in my analysis.
✅LIKE AND COMMENT MY IDEAS✅
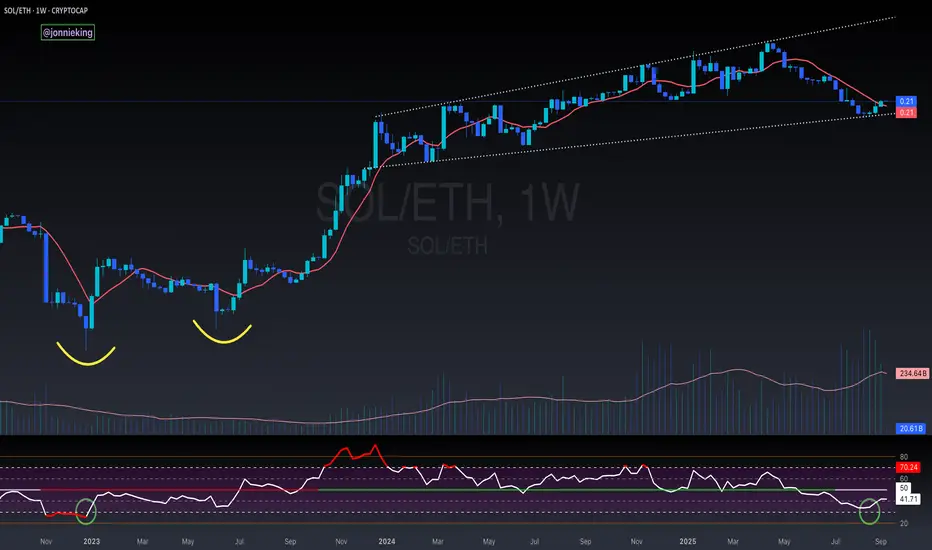
$SOL / $ETH REVERSAL * ALT SEASON *🚨 The CRYPTOCAP:SOL / CRYPTOCAP:ETH REVERSAL has officially been confirmed.
✅ 3 White Solders
✅ Weekly close above 9WMA
✅ Broadening Wedge
Money is moving down risk, which brings outsized returns.
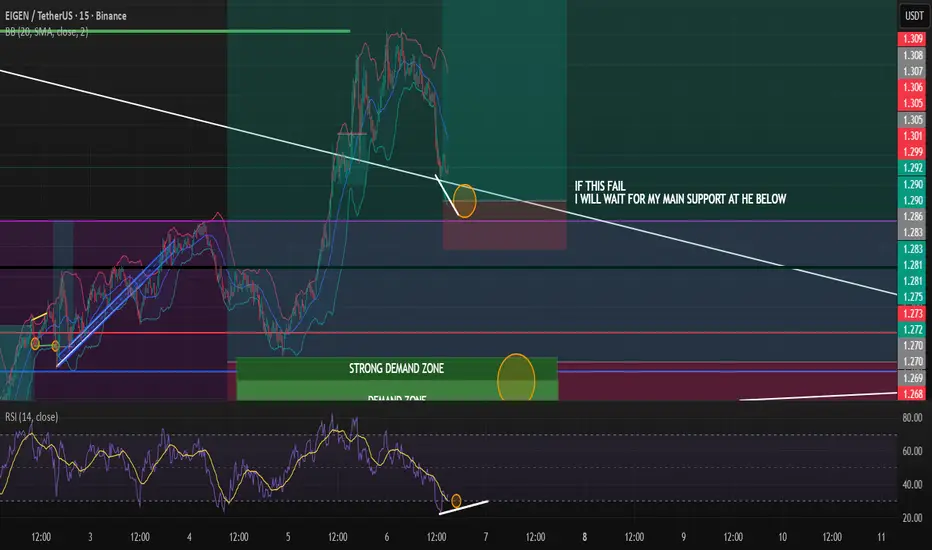
Possible Second Entry For Those Who TP Or MissI hope you didnt miss the %16 profit, I warned you.ıf this entry fail I will wait my main support which is labelled as green.White line at the below is a strong support if eigen stay below it, rally is cancelled.
Always manage your own risks this is not a investment advise I am not responsible neither your loss nor profit.
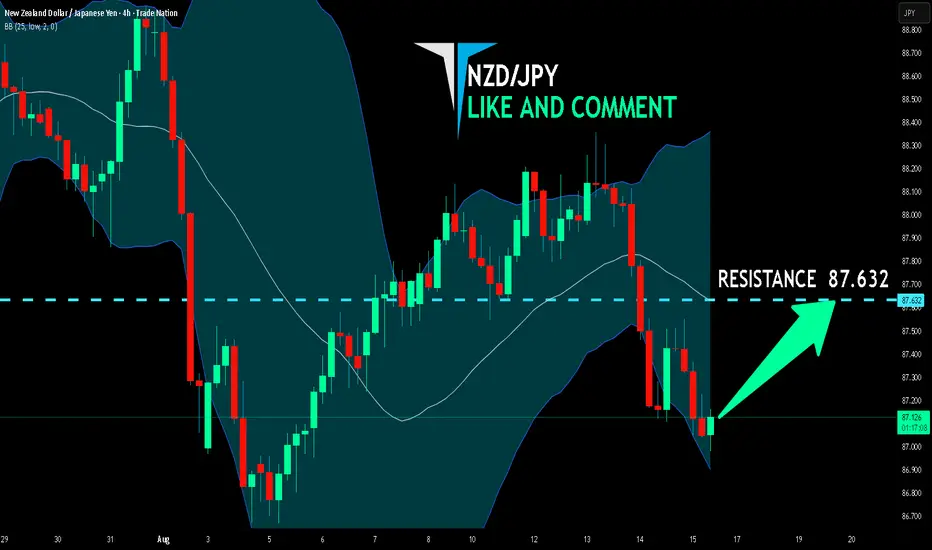
NZD/JPY BULLS ARE GAINING STRENGTH|LONG
Hello, Friends!
NZD-JPY downtrend evident from the last 1W red candle makes longs trades more risky, but the current set-up targeting 87.632 area still presents a good opportunity for us to buy the pair because the support line is nearby and the BB lower band is close which indicates the oversold state of the NZD/JPY pair.
Disclosure: I am part of Trade Nation's Influencer program and receive a monthly fee for using their TradingView charts in my analysis.
✅LIKE AND COMMENT MY IDEAS✅
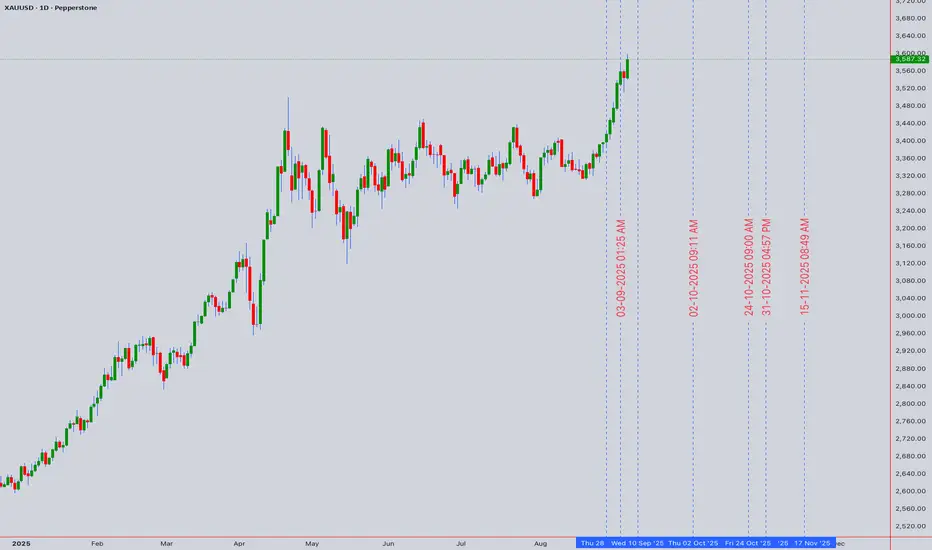
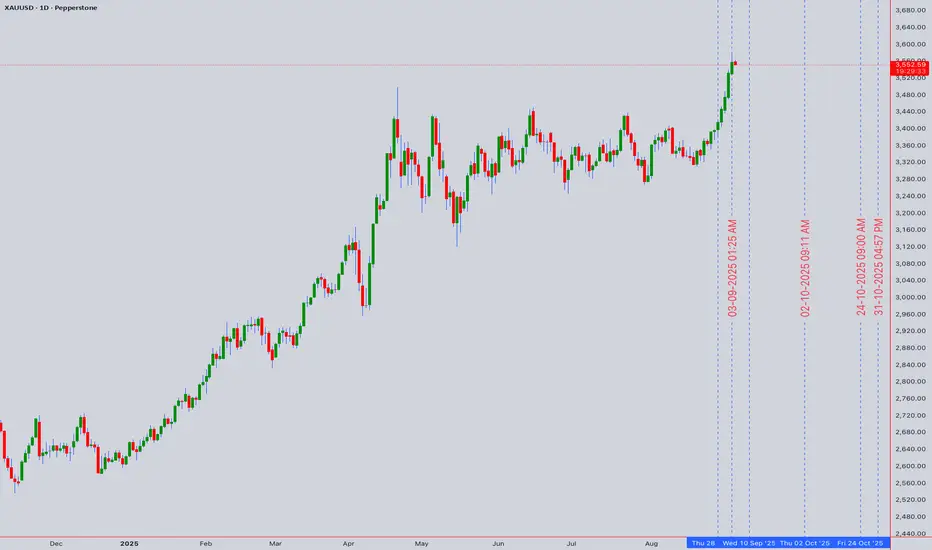
Gold at the Crossroads: Decisive Battle at $3,600 After BreakoutAsset: XAUUSD ( Gold Spot / US Dollar )
Analysis Date: September 5, 2025
Current Closing Price: $3,586.54 (as of 12:59 AM UTC+4)
Timeframes Analyzed: 1H, 4H, D, W
Market Context: Record High Territory - Bullish Momentum Sustained
Executive Summary & Market Outlook
Gold (XAUUSD) has executed a critical technical breakout, pushing above the $3,580 resistance and challenging the monumental $3,600 psychological and technical barrier. The asset is in a firm bullish trend but is now testing a zone where profit-taking and fresh selling pressure historically emerge. The price action in the coming sessions will be decisive. A sustained break above $3,600 could trigger a momentum-fueled rally towards $3,650, while a rejection here may form a short-term top, leading to a retracement towards $3,550 support. This analysis integrates multi-timeframe signals for intraday and swing traders.
Multi-Timeframe Technical Analysis
1. Trend Analysis (Daily & 4-Hour Chart):
Primary Trend: Bullish. The sequence of Higher Highs (HH) and Higher Lows (HL) is unequivocal on the daily chart.
Momentum: The breakout above the previous resistance near $3,580 is a significant bullish victory. However, the rapid ascent has left the price extended, increasing the probability of a consolidation or pullback.
2. Key Chart Patterns & Theories:
Breakout & Re-test Pattern: The move above $3,580 has broken the structure of the previous consolidation. The ideal bullish scenario now involves a successful re-test of the $3,580 level as new support. This would confirm the breakout's validity and offer a high-probability long entry.
Elliott Wave Theory: The rally from the last significant low is impulsive in nature. We are likely in a later stage of a Wave 3 or a Wave 5 extension. This suggests that while the trend is up, the cycle is maturing. Wave 4 corrections typically retrace to the 38.2% Fibonacci level of Wave 3, which would be near $3,520.
Gann Theory: The $3,600 level represents a key psychological and mathematical resistance. A decisive break and close above it could open the path to the next Gann angle/resistance level, projected near $3,620-$3,630.
Ichimoku Cloud (H4/D1): Price is trading well above the Senkou Span (Cloud) on both timeframes, confirming the strong bullish trend. The Cloud itself is thick and rising, providing strong dynamic support far below current levels.
3. Critical Support & Resistance Levels:
Resistance (R1): $3,600 - $3,610 (Key Psychological & Technical Barrier)
Resistance (R2): $3,630 (Next Projected Target)
Resistance (R3): $3,650 (Measured Move Target)
Current Closing Price: ~$3,586.54
Support (S1): $3,580 (Previous Resistance - New Potential Support)
Support (S2): $3,550 - $3,555 (Bullish Trend Line & 21-period EMA confluence)
Support (S3): $3,520 (Major Swing Low & 38.2% Fib Retracement)
4. Indicator Consensus:
RSI (14-period on 4H): Reading is in the 68-72 range, touching on overbought territory. This does not signal an immediate reversal but warns that buying momentum may be overextended in the short term. Watch for bearish divergence on the 1H chart for early signs of a pullback.
Bollinger Bands (4H): Price is peeking outside the upper band, a classic sign of a strong trending move. A move back inside the bands will signal a pause in the trend.
Moving Averages: The bullish alignment (EMA8 > EMA21 > EMA50) is perfect on all timeframes. The EMA 21 on the 4H chart (~$3,555) has acted as dynamic support and is a key level for the bullish thesis.
Volume & VWAP: Volume spiked on the initial breakout. The Anchored VWAP (from the recent swing low) shows price is extended above the mean. A pullback to the VWAP would be a healthy development.
Trading Strategy & Forecast
A. Intraday Trading Strategy (5M - 1H Charts):
Bullish Scenario (Breakout Hold): A pullback to the $3,580 - $3,582 area that finds support (e.g., bullish pin bar, engulfing pattern) presents a low-risk long opportunity. Entry: On bullish confirmation at support. Stop Loss: Below $3,575. Target: $3,600 (TP1), $3,610 (TP2).
Bearish Scenario (Rejection at Highs): If price fails to break $3,600 and shows rejection (long upper wicks, RSI divergence), a short trade for a pullback to $3,570 - $3,575 is viable. Entry: On rejection signals. Stop Loss: Tight, above $3,605. Target: $3,565 (S1).
Momentum Breakout: A strong 1H close above $3,605 could be faded with a small long position, targeting $3,620.
B. Swing Trading Strategy (4H - D Charts):
Bullish Bias: The strategy remains "buy the dip." The most attractive zones for adding long positions are a successful re-test of $3,580 or a deeper pullback to the stronger support confluence at $3,550 - $3,555.
Bearish Risk: A daily close back below $3,560 would be a warning sign that the breakout may have failed (a potential bull trap), opening the door for a deeper correction to $3,520. This would invalidate the immediate upside breakout scenario.
Risk Management & Conclusion
Key Risk Events: Monitor for any surprise geopolitical developments or unexpectedly hawkish comments from Fed officials, which could trigger a "flight-to-safety" rally or a dollar-strength selloff in gold, respectively.
Position Sizing: The increased volatility at key levels demands conservative position sizing. Risk no more than 1% of capital per trade.
Conclusion: XAUUSD is at a critical technical and psychological juncture. The breakout is bullish, but the battle for $3,600 is the key to the next directional move. Swing traders should be patient for a better risk/reward entry on a pullback. Intraday traders can play the range between $3,580 and $3,600 until a decisive break occurs. The overall structure favors the bulls, but a period of consolidation is the most likely immediate outcome.
Overall Bias: 🟢 Bullish above $3,555 | 🟡 Neutral/Bearish below $3,560
For individuals seeking to enhance their trading abilities based on the analyses provided, I recommend exploring the mentoring program offered by Shunya Trade. (Website: shunya dot trade)
I would appreciate your feedback on this analysis, as it will serve as a valuable resource for future endeavors.
Sincerely,
Shunya.Trade
Website: shunya dot trade
Disclaimer: This post is intended solely for educational purposes and does not constitute investment advice, financial advice, or trading recommendations. The views expressed herein are derived from technical analysis and are shared for informational purposes only. The stock market inherently carries risks, including the potential for capital loss. Therefore, readers are strongly advised to exercise prudent judgment before making any investment decisions. We assume no liability for any actions taken based on this content. For personalized guidance, it is recommended to consult a certified financial advisor.
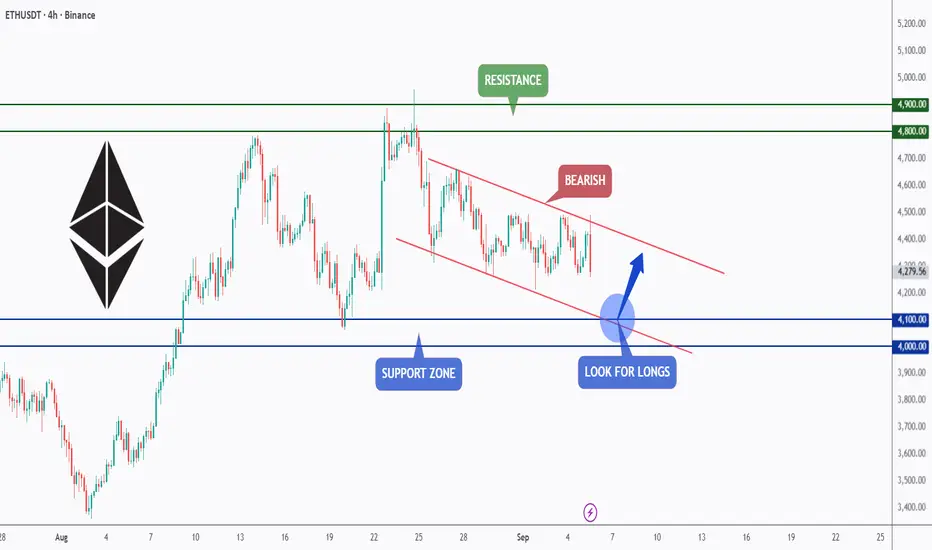
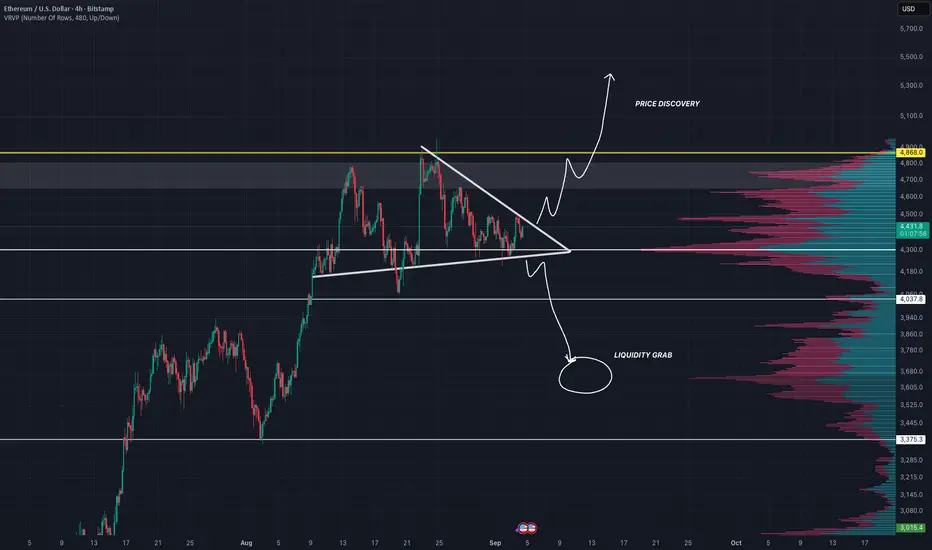
ETH – Watching the Falling Channel!Ethereum is currently trading within a falling channel on the 4H timeframe, showing short-term bearish pressure.
Price is approaching the support zone around the $4,000–$4,100 area, which also aligns with the lower boundary of the channel.
As long as this zone holds, it could act as a springboard for bullish momentum, offering a potential long setup.
A breakout from the channel would further confirm buyer strength and open the way toward the resistance zone near $4,800–$4,900.
⚠️ Disclaimer: This is not financial advice. Always do your own research and manage risk properly.
📚 Always follow your trading plan regarding entry, risk management, and trade management.
Good luck!
All Strategies Are Good; If Managed Properly!
~Richard Nasr
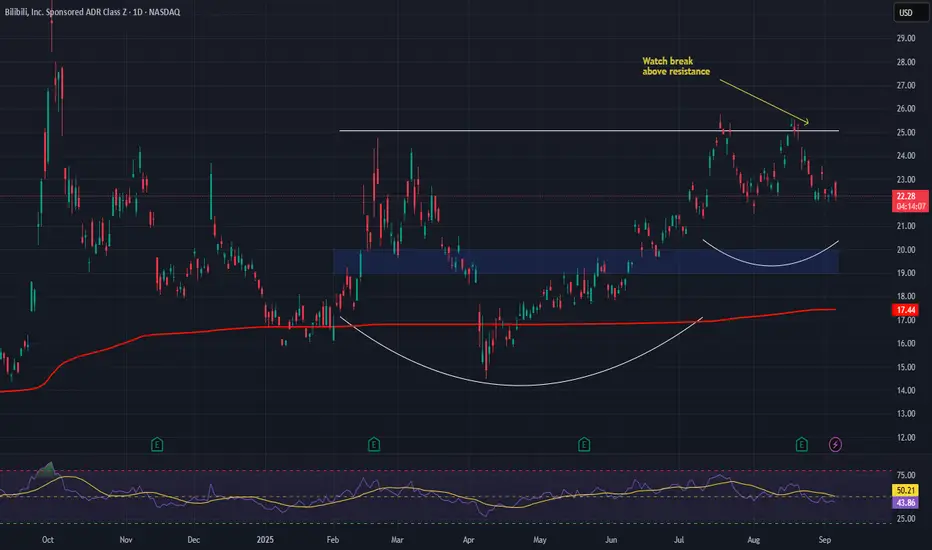
Bilibili Inc. (BILI) — Gaming Growth & Shareholder ValueBilibili Inc. NASDAQ:BILI , a leading Chinese online entertainment platform, continues to capture younger audiences through video, live streaming, and gaming while actively expanding into Southeast Asia for international growth.
Key Catalysts:
Gaming momentum: Mobile gaming revenue jumped +60% YoY, solidifying its role as Bilibili’s primary growth driver.
Shareholder returns: A $116M share repurchase underscores management’s confidence and enhances EPS growth.
Global expansion: Southeast Asia entry taps into a demographic closely aligned with its core user base.
Investment Outlook:
Bullish above: $19.00–$20.00
Upside target: $45.00–$46.00, supported by gaming growth, buybacks, and international expansion.
#BILI #ChinaTech #Gaming #Streaming #Ecommerce #ShareBuyback #Investing
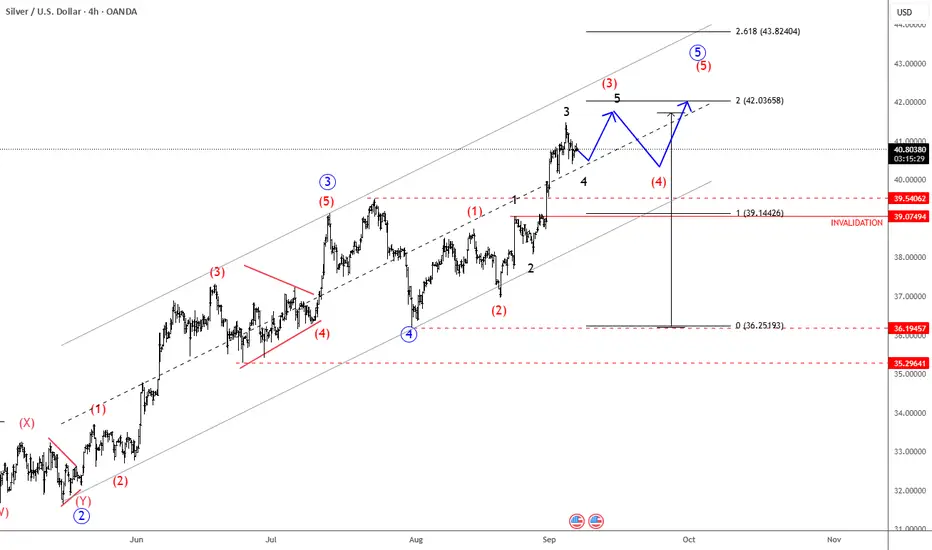
Silver Unfolds A New Impulse Within 5th WaveSilver is moving higher as expected, pushing even beyond 39, but since the market also broke to new highs, it’s clear that higher degree wave four is finished as a flat correction back at 36.20, so be aware of even further continuation higher into wave five while makret trades above 39. We need five subwaves now in this blue wave 5 cycle, so more gains can follow after some intraday setbacks. But keep in mind that we are in the final leg of the higher-degree fifth wave impulse that could come to an end around 42/43 this year.
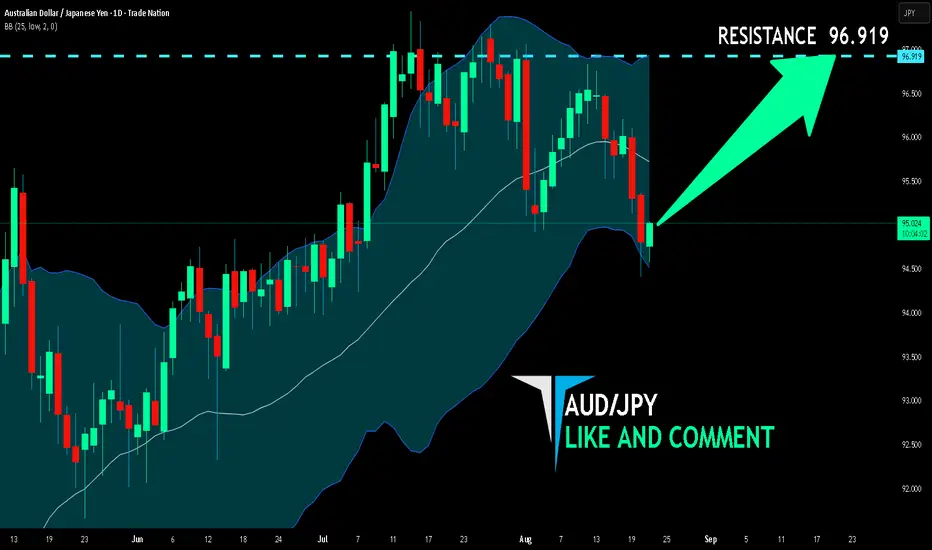
AUD/JPY BULLISH BIAS RIGHT NOW| LONG
Hello, Friends!
AUD/JPY pair is trading in a local uptrend which know by looking at the previous 1W candle which is green. On the 1D timeframe the pair is going down. The pair is oversold because the price is close to the lower band of the BB indicator. So we are looking to buy the pair with the lower BB line acting as support. The next target is 96.919 area.
Disclosure: I am part of Trade Nation's Influencer program and receive a monthly fee for using their TradingView charts in my analysis.
✅LIKE AND COMMENT MY IDEAS✅
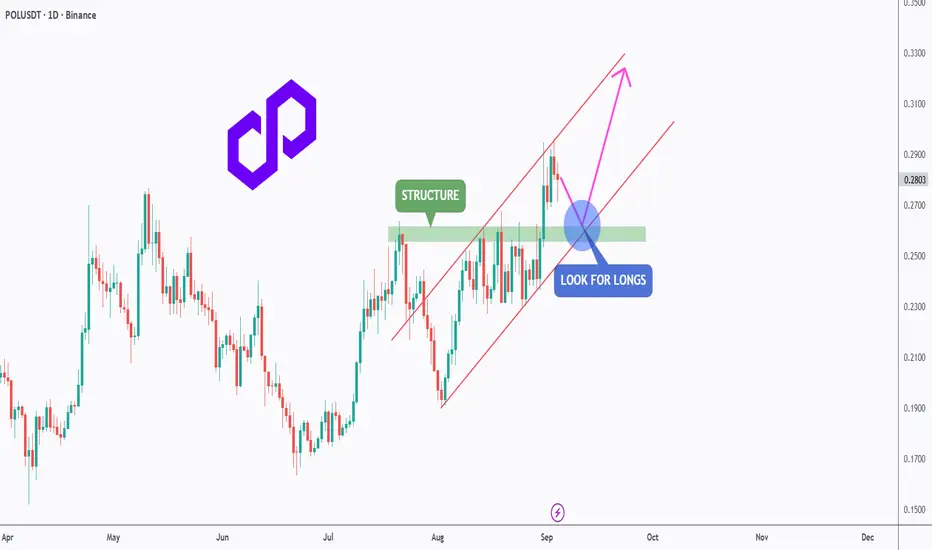
POL - Retest the Channel, Reload for the Next Leg!POLUSDT has been trading inside a clean ascending channel 📈, respecting both support and resistance levels.
After a strong push upward, price is now pulling back toward the previous structure zone around 0.26 – 0.27, which aligns perfectly with the lower bound of the channel.
This area forms a strong confluence (structure + channel support) 🔑, making it an ideal spot to look for long opportunities. As long as this zone holds, bulls 🐂 could regain control and push price toward the next resistance levels in the 0.32.
Patience here is key ⏳ — waiting for confirmation before entering can set up a high-probability continuation trade.
⚠️ Disclaimer: This is not financial advice. Always do your own research and manage risk properly.
📚 Always follow your trading plan regarding entry, risk management, and trade management.
Good luck!
All Strategies Are Good; If Managed Properly!
~Richard Nasr
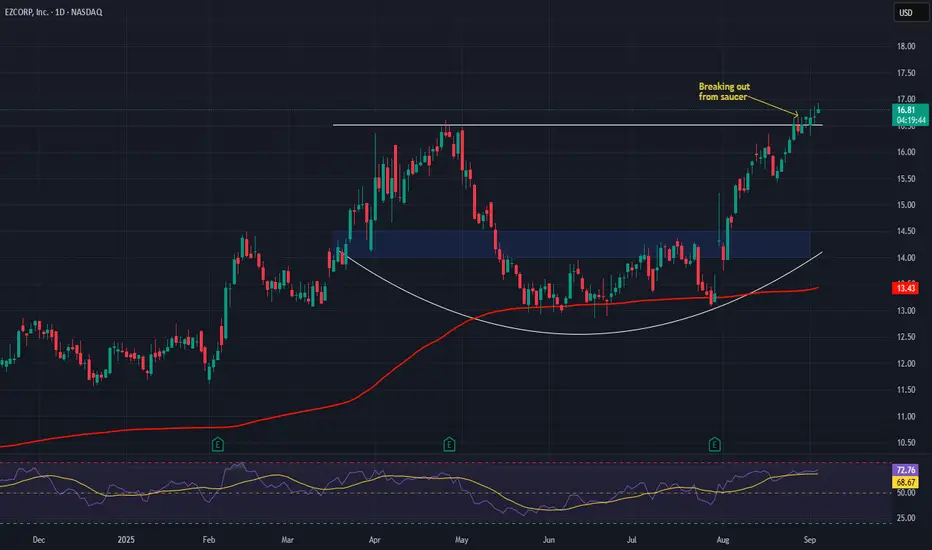
EZCORP (EZPW) AnalysisEZCORP, Inc. NASDAQ:EZPW , a leading pawn services and consumer lending provider, is scaling operations across the U.S. and Latin America—expanding its footprint, diversifying revenue streams, and enhancing resilience.
Key Catalysts:
Operational discipline: Focus on cost controls, inventory management, and service upgrades supports steady performance.
Growth expansion: Geographic diversification reduces reliance on any single market.
Valuation edge: Trading at a forward P/E of ~8.8, EZPW remains significantly undervalued vs. S&P 500 averages despite solid growth drivers.
Investment Outlook:
Bullish above: $14.00–$14.50
Upside target: $21.00–$22.00, backed by expansion momentum, cost efficiency, and attractive valuation.
📢 EZPW — a growth story trading at value multiples.
#EZPW #PawnServices #ConsumerLending #LatinAmerica #ValueStocks #Investing
$ETH - Close to a breakout.CRYPTOCAP:ETH - Close to a breakout.
Ethereum is about to breakout the triangle.
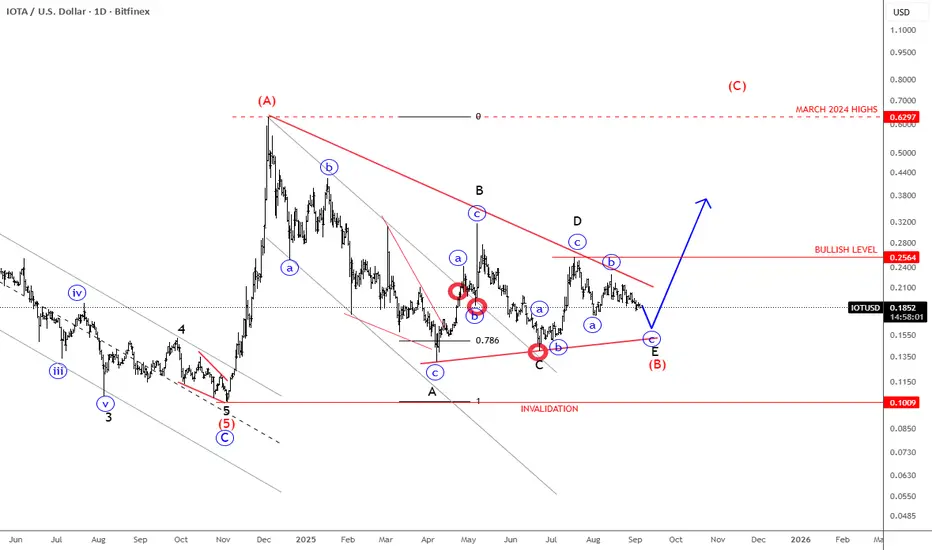
IOTA Finishing A Bullish Triangle?IOTA can be finishing a bullish triangle pattern that can send the price higher from technical point of view and by Elliott wave theory.
Cryptocurrency IOTA with ticker IOTUSD remains in sideways consolidation, and it more and more looks like a bullish ABCDE triangle pattern in wave (B) that can be coming to an end soon. We are actually tracking final subwave “c” of E of (B), so soon watch out for a strong bullish breakout into wave (C), which can send the price back to March 2024 highs. Keep in mind that bullish confirmation is only above upper triangle line and 0.25 level.
IOTA is a cryptocurrency designed for the Internet of Things (IoT). Unlike traditional blockchains, it uses a unique technology called the Tangle—a directed acyclic graph (DAG) that allows transactions to be feeless, scalable, and lightweight. This makes it well-suited for machine-to-machine payments, microtransactions, and secure data transfer. IOTA’s goal is to be the backbone of a machine economy, enabling devices to transact and share data autonomously.
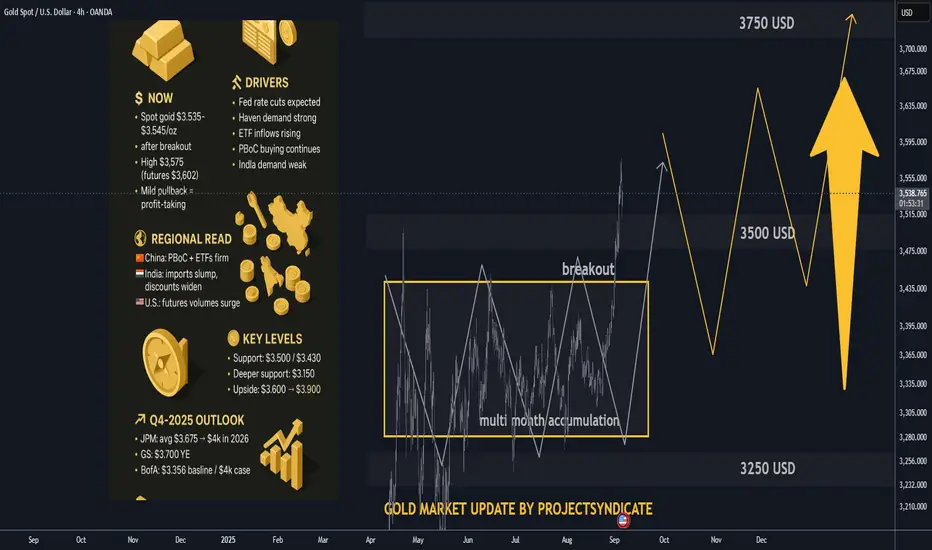
Gold Market Live Update Bulls Broke 3500 USD S/R💰 Gold Prices Live Update
• Spot gold consolidating $3,535–$3,545/oz, after a decisive breakout above the multi-month range ($3,300–$3,450).
• Fresh all-time highs were set this week, with spot hitting $3,575 and U.S. futures spiking to $3,602 intraday.
• Current pullback appears mild and orderly, suggesting profit-taking post-breakout rather than trend reversal.
________________________________________
📰 Fresh headlines
• Gold powers to record highs on safe-haven demand.
• Breakout above $3,500 confirms bullish momentum.
• Futures hit $3,600+ as central banks, ETFs add to positions.
• Weekly close strong despite pullback, as rate-cut bets intensify.
• ETF holdings surge to highest since 2022; central banks remain active buyers.
• Analysts eye $3,600–$3,900 near-term targets.
________________________________________
🔧 What’s driving the breakout
• Technical breakout: Months of range-bound trade ($3,300–$3,450) built a strong base; breach above $3,500 unleashed momentum buying.
• Macro tailwinds: Fed rate-cut expectations and falling real yields are lifting gold’s appeal.
• Haven demand: Political tensions and policy uncertainty amplify defensive flows.
• Institutional support: ETF inflows accelerating, GLD holdings climbing.
• Official sector: PBoC and other central banks continue steady accumulation.
• Physical drag: India demand subdued at elevated prices; local imports hit multi-year lows.
________________________________________
🌍 Regional quick read
• 🇨🇳 China: PBoC extends buying streak; local ETFs resilient.
• 🇮🇳 India: Imports at 2-year low, physical discounts widen as prices bite.
• 🇺🇸 U.S.: Futures volumes surge on breakout; non-farm payrolls eyed for near-term volatility.
________________________________________
🧭 Key levels
• Immediate support: $3,500 (psychological + breakout retest).
• Secondary support: $3,430 (prior range top).
• Deeper pullback zone: $3,150 (major base support if correction extends).
• Upside targets: $3,600 already tested; $3,750–$3,900 in play if flows persist.
• Positioning: Open interest + volumes confirm breakout conviction; current dip orderly.
________________________________________
🔭 Q4-2025 outlook
• JPMorgan: avg $3,675, path to $4,000 in 2026.
• Goldman Sachs: $3,700 by year-end.
• BofA: $3,356 baseline, $4,000 stretch case.
• Citi: Near-term $3,500+, but warns of risks if demand fades.
• Consensus: $3,500–$3,750 base case; bullish tail $3,900, bearish tail $3,250–$3,400.
________________________________________
🧱 Risks & swing factors
• U.S. payrolls + Fed meeting: Short-term catalysts for volatility.
• ETF flows + lease rates: Critical to sustaining momentum.
• Geopolitical noise: Keeps haven demand sticky.
• Physical demand weakness: Especially in India, could cap rallies.
________________________________________
⚡ Key takeaways
• 💥 Breakout confirmed: Gold shattered the $3,300–$3,450 range, powered through $3,500, and tagged $3,575 — clearing multi-month resistance.
• 📈 Pullback healthy: Current drift lower looks like mild profit-taking, not distribution.
• 🏦 Flows remain bullish: Central banks + ETFs underpinning the rally.
• 🧭 Q4 outlook intact: $3,500–$3,750 base case; $3,900 bullish tail / $3,300 bearish tail.
• 🇮🇳 Physical demand soft: Indian weakness may keep rallies from overheating.
Golden Ascent Faces Key Resistance at $3,600Golden Ascent Faces Key Resistance at $3,600
Asset: XAUUSD (Gold Spot vs. US Dollar)
Analysis Date: September 4, 2025
Open Price: $3,560 (as of 12:54 AM UTC+4)
Timeframes Analyzed: 5M, 15M, 1H, 4H, D, W
Executive Summary & Market Outlook
Gold (XAUUSD) is exhibiting a strong bullish structure on higher timeframes, currently challenging a critical resistance confluence zone near $3,600 . The price action suggests the asset is in a decisive uptrend, but short-term momentum shows signs of potential exhaustion. A clean break above $3,600 could catalyze the next leg up towards $3,650, while a rejection here may trigger a healthy pullback to gather liquidity before the next move. This analysis integrates multi-timeframe signals to provide a roadmap for both intraday traders and swing traders.
Multi-Timeframe Technical Analysis
Our methodology synthesizes classic chart patterns, harmonic price action, and a suite of momentum indicators to identify high-probability scenarios.
1. Trend Analysis (Daily & 4-Hour Chart):
Primary Trend: Bullish. Price is trading well above its key Daily Simple Moving Averages (e.g., SMA 50, SMA 200), which are fanned out and sloping upwards.
Intermediate Trend: Bullish. The series of higher highs (HH) and higher lows (HL) on the 4H chart remains intact. The most recent HL is near the $3,500 level, which now serves as crucial support.
2. Key Chart Patterns & Theories:
Bull Flag Formation (4H): The recent consolidation between ~$3,520 and $3,580 can be interpreted as a bull flag—a continuation pattern. A breakout above $3,580 with increasing volume would project a measured move target approximately $120 higher, aligning with the $3,700 area.
Elliott Wave Theory: Gold appears to be in a mature Wave 3 (or a powerful Wave C of an corrective structure) of a larger impulsive move. This suggests strong momentum but also warns of an eventual Wave 4 pullback. The typical retracement zone for a Wave 4 is between 38.2% and 50% of Wave 3, which would be in the $3,480 - $3,520 range.
Harmonic Patterns: The rally from the recent swing low is approaching a potential Bullish Cypher pattern’s Potential Reversal Zone or a 0.886 Fibonacci retracement of a prior leg, often a profit-taking zone. This reinforces the significance of the $3,590-$3,610 resistance cluster.
3. Critical Support & Resistance Levels:
Resistance (R3): $3,650 - $3,670 (Projected Target)
Resistance (R2): $3,620 (Psychological Level)
Resistance (R1): $3,590 - $3,610 (Key Confluence Zone) - Current hurdle. Contains Fibonacci extensions and previous swing highs.
Current Open Price: ~$3,560
Support (S1): $3,540 - $3,550 (Immediate Pullback Support)
Support (S2): $3,500 - $3,520 (Primary Support) - Must hold for bullish structure. Aligns with the 50-period EMA on 4H and previous resistance turned support.
Support (S3): $3,450 (Major Swing Low)
4. Indicator Consensus:
RSI (14-period on 4H): Reading is near 65 . It is in bullish territory but has not yet reached overbought (>70), suggesting there is room for further upside, though a minor divergence could signal a brief pause.
Bollinger Bands (4H) : Price is riding the upper band, a sign of strong momentum. A move back inside the bands would indicate a slowdown in the pace of the advance.
Moving Averages: The order of the EMAs (8 > 21 > 50 > 200) on the 4H and 1H charts confirms a strong bullish trend alignment. Any pullback is likely to find dynamic support at the 21-period EMA.
Volume & VWAP: Volume has been steady on up moves. The Anchored VWAP (likely from a recent significant low) shows price trading well above the mean, indicating strong buyer control. A break below the VWAP could signal a deeper retracement.
Trading Strategy & Forecast
A. Intraday Trading Strategy (5M - 1H Charts):
Bullish Scenario (Breakout Play): Wait for a strong 1H or 4H close above $3,590 with supporting volume. Entry: On a retest of $3,590 as support or a small pullback. Stop Loss: Below $3,575. Target : $3,620 (TP1), $3,650 (TP2).
Bearish Scenario (Rejection Play): If price shows clear rejection at $3,590 (e.g., long upper wicks, bearish engulfing patterns on 1H), consider a short for a pullback to S1. Entry: On confirmation of rejection. Stop Loss: Tight, above $3,610. Target: $3,540 - $3,550.
Range Trade: If price remains contained between $3,540 and $3,590, traders can fade the extremes with tight stop losses.
B. Swing Trading Strategy (4H - D Charts):
Bullish Bias: The overall strategy should be to buy the dips within the bullish trend. The most attractive long entries for swing traders are near the key support confluence at $3,500 - $3,520. A break and hold above $3,610 opens the path to $3,650+.
Bearish Risk: A daily close below $3,500 would violate the higher low structure and suggest a deeper correction is underway, potentially towards $3,450. This would invalidate the immediate bullish outlook.
Risk Management & Conclusion
Key Risk Events: Monitor upcoming US economic data (NFP, CPI) and any shifts in geopolitical tensions or Federal Reserve rhetoric, as these are primary drivers for gold volatility.
Position Sizing: Always risk no more than 1-2% of your capital on a single trade. The volatile nature of gold necessitates disciplined risk management.
Conclusion: The technical picture for XAUUSD is bullish but at an inflection point. The battle between bulls and bears is concentrated at the $3,590-$3,610 resistance wall. A successful breakout paves the way for a continued rally, while a rejection could see a short-term correction to gather energy for the next attempt. Traders should be agile, respect key levels, and align their strategies with the higher-timeframe trend.
Overall Bias: 🟢 Bullish above $3,520 | Bearish below $3,500
Disclaimer: This analysis is for informational purposes only and does not constitute financial advice. Trading financial instruments carries a high level of risk and may not be suitable for all investors. Always conduct your own research and consider seeking advice from an independent financial advisor before making any trading decisions.
$SOL Rotation IncomingNow that the CRYPTOCAP:ETH hype has calmed,
it’s almost time for CRYPTOCAP:SOL
to rip the haters face off...
once again🎃
Gold Futures – Momentum Strong but Eyes on Jobs DataPrice pushed extremely bullish yesterday, with little chance for pullbacks. I admittedly got stopped out a few times from reacting too quickly to impulses, so today I’m focused on patience and waiting for confirmation.
Currently, Gold is holding above recent levels after breaking higher. There’s still a clean 4H/8H FVG below that price could revisit, but as long as momentum stays intact, buyers remain in control.
⚠️ Important: Tomorrow brings ADP Non-Farm Employment, Jobless Claims, and ISM Services PMI — all of which could drive volatility. Friday is the heavyweight NFP release. Until then, we may see liquidity hunts or choppy price action.
Scenarios I’m watching:
✅ Bullish continuation toward new highs if support holds.
🔄 Deeper pullback into the FVG if momentum stalls.
Staying patient, letting the market show its hand, and keeping risk tight ahead of news.
