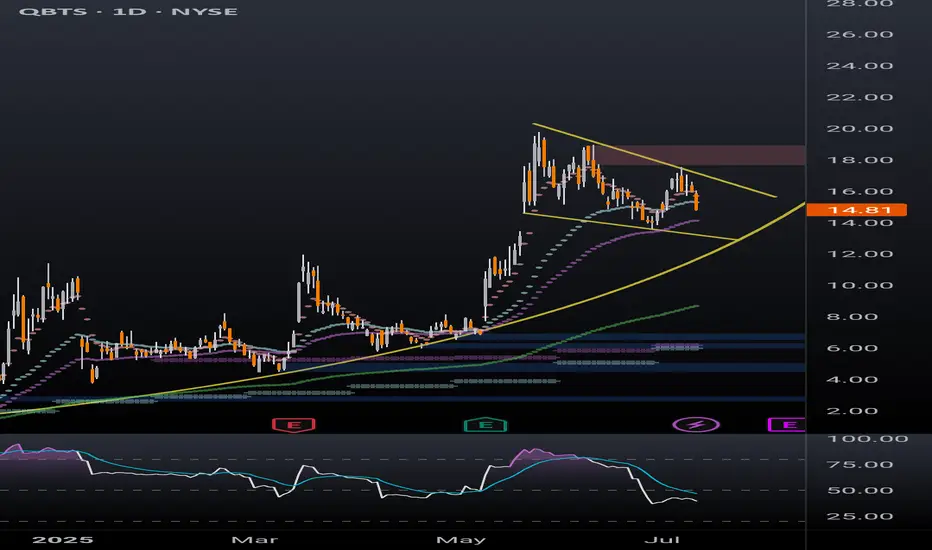
QBTS bull flag dailyBetter look at quantum computing ticker QBTS bull flag on the daily timeframe. Previous post looked at the weekly timeframe to highlight the bullish momentum. Lots of retail money piled into this one in the last few months, a breakout of this bull flag will likely be followed by a parabolic move.
Bullflagpattern
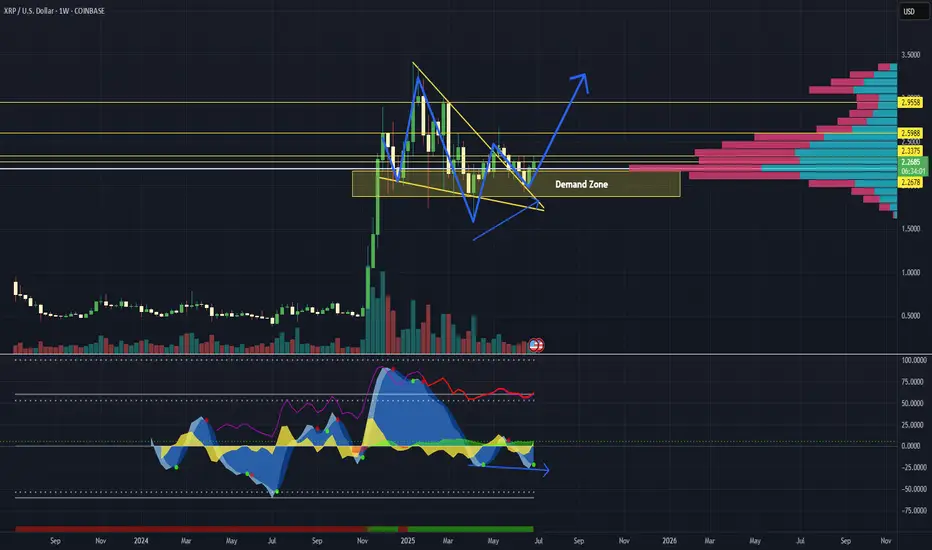
XRP: Ripple Ready to Unleash a Tsunami?Ripple (XRP) is coiling like a spring—ready to explode. After five clean re-tests of a powerful demand zone, buyers have repeatedly stepped in to defend key levels, launching 40–75% swings each time. Is this the moment it unleashes the wave?
🔍 Technical Breakdown:
✅ Demand Zone Strength
XRP is bouncing from a long-tested demand zone (5+ re-tests). Each bounce led to substantial upside momentum.
✅ Bull Flag Retest
XRP previously broke out of a large bull flag and has been holding the flag’s top trendline for over 40 days—acting as strong support.
✅ Higher Low Structure
Price formed a higher low (H/L) and has climbed steadily for two weeks—building bullish structure.
✅ Volume Profile
Price reclaimed ground above the high-volume node, signaling accumulation strength.
✅ Market Cipher B Divergence
A weekly hidden bullish divergence is present—not massive, but notable—hinting at momentum shift.
⚠️ What to Watch:
Volume is key: Current consolidation shows a decline in volume—a surge could ignite the breakout.
Confirmation for conservative traders: Wait for a break and hold above $2.33 with volume, or a retest of that level.
If past demand zone reactions repeat, a breakout could be imminent.
What do you think?
📈 As always—this is not financial advice. Do your own research.
🧭 Happy Hunting!
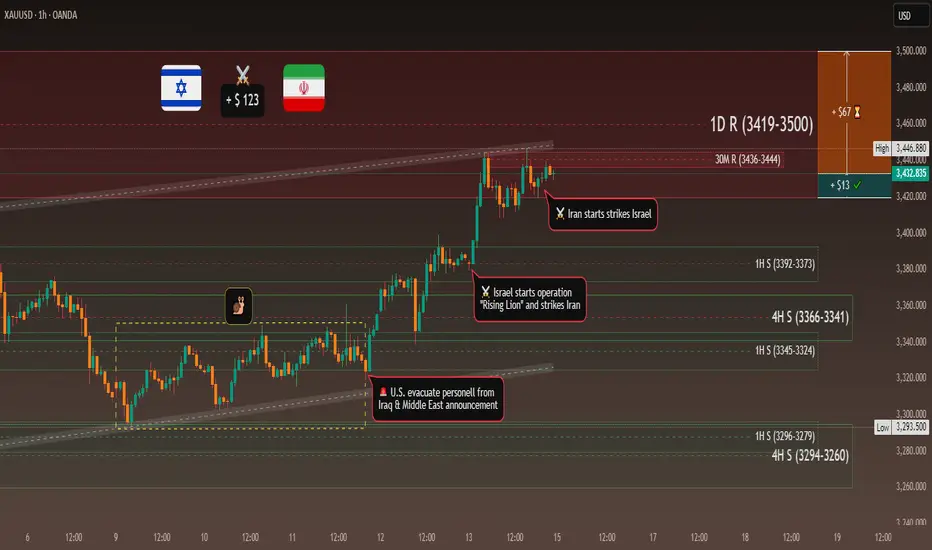
Beyond the Headlines - Gold Outlook June 16-20, 2025Beyond the Headlines: Gold's Ascent Amidst Global Shifts & Key Technicals 🌐🚀
Everything about the last week can be found here:
OANDA:XAUUSD 💰📈
We all know what's going on, I believe. Israel struck Iran 💥, and this conflict will likely take a bit before things cool down. 🥶
---
## Geopolitical News Landscape 🌍📰
### Israel / Iran
Since June 12, Israel launched "Operation Rising Lion," targeting Iranian nuclear sites like Natanz and Esfahan – over 128 killed, Iran claims. 🇮🇷 retaliated with missile and drone strikes on Haifa and Tel Aviv, killing at least 10. 🚀
**Outlook:** 🔥 Tensions are spiraling. Without urgent mediation, full-scale regional war remains a real risk. 💣
### India / Pakistan
Since the May ceasefire, few clashes have occurred. However, both navies increased readiness, signaling potential escalation at sea. 🚢
**Outlook:** ⚖️ Peace is fragile. A strategic dialogue is key to avoiding a renewed border or maritime conflict. 🙏
### Gaza Conflict
Between June 7–15, Israeli strikes killed at least 41 Palestinians, including 8 near an aid center in Rafah. Over 55,000 total deaths, and famine is looming. 💔
**Outlook:** 🆘 Gaza remains a humanitarian catastrophe. Global pressure for access and a ceasefire must intensify. 🕊️
### Russia / Ukraine
June 13–15: Russia returned the bodies of 1,200 Ukrainian soldiers in a rare POW swap gesture. 🤝 Fighting remains intense in Sumy and Toretsk; Russia hit a major oil refinery. 🏭
**Outlook:** 🕊️ While symbolic moves continue, no peace is in sight – battlefield outcomes will shape diplomacy. ⚔️
### U.S. - China Trade War
The U.S. hiked tariffs to 55% on key Chinese goods. 🇺🇸🇨🇳 responded with 10% on U.S. imports. Talks yielded a partial truce, but military-use rare earths remain unresolved. 💻
**Outlook:** 🔧 Tech remains the battleground. Without progress on critical materials, the trade war may deepen. 📉
### Global Trade War
The OECD revised global growth downward due to rising tariffs from the U.S. targeting 🇨🇳, 🇲🇽, 🇨🇦. Global trade volume is expected to shrink by 0.2–1.5%. 📉
**Outlook:** ⛓️ Supply chain disruption is spreading. Global trade will stay under pressure without coordinated policy. 🌍➡️🌍
### Trump vs. Powell
Trump labeled Powell a "numbskull" for not cutting rates, suggesting he might "force something" if re-elected. 🗳️ The Fed maintains policy independence ahead of a critical June decision. 🏛️
**Outlook:** ⚔️ Political pressure on the Fed is mounting. Expect more friction as the election cycle heats up. 🔥
### U.S. Inflation
CPI rose 2.4% YoY in May (from 2.3%); Core CPI held steady at 2.8%. Monthly growth was modest at 0.1%. Key rises were seen in healthcare and vehicle prices. 🚗🏥
**Outlook:** Inflation is stable but sticky. 🚦 The Fed will likely hold rates steady until clearer disinflation signals appear. 📊
---
## Technical View 📐📈
### Market Structure:
Gold shows a clear **bullish market structure** with higher highs and higher lows. ⬆️ Recent price action suggests we're in a strong uptrend with institutional buying pressure. 🏦
### Key Levels:
* The chart shows a significant low around the **$3,245 area** (marked as "Low") which could act as a key institutional support level. 💪
* The current high near **$3,446** represents a potential institutional resistance zone. 🛑
* Look for potential **order blocks** around the **$3,380-$3,400 range** where price consolidated before the recent breakout. 🧱
### Fair Value Gaps (FVG):
There appear to be several gaps in the price action during volatile moves, particularly during strong rally phases. These could act as future support/resistance areas. 📉📈
### Gann Analysis:
The price movement shows strong adherence to Gann principles:
* The rally from the low follows a steep angle, suggesting strong momentum. 🚀
* Key Gann angles would place support around the **$3,300-$3,320 zone**. 📐
* The current price near **$3,436** is testing natural resistance levels based on Gann square calculations. 📏
### Fibonacci Levels:
From the significant swing low to the current high:
* 23.6% retracement: ~$3,395 📉
* 38.2% retracement: ~$3,370 📉
* 50% retracement: ~$3,345 📉
* 61.8% retracement: ~$3,320 📉
The golden ratio levels suggest key support on any pullback would be around the **$3,370-$3,345 zone**. ✨
### Institutional Levels:
* **Weekly/Monthly Levels:** The **$3,400** and **$3,450** areas appear to be significant institutional levels based on round numbers and previous price action. 🏦💰
* **Smart Money:** The accumulation pattern before the breakout suggests institutional participation. 🧠💡
### Cycle Timing:
Based on the timeframe (appears to be 30-minute bars from May 26-June 15):
* We're seeing approximately **3-week cycles** in the major moves. 🗓️
* The current rally phase appears to be in its mature stage. 🌳
* The next potential cycle turn could be approaching, suggesting caution for new longs at current levels. ⚠️
---
### Trading Considerations:
* Watch for rejection at current levels near **$3,446**. 📉
* Key support confluence around **$3,370-$3,345** for potential re-entry. 🎯
* Volume and momentum divergences would be critical for timing any reversal. 📊🔄
Other indicators tend to show bullish scenario enhancements. 🚀
Gold has formed a ** Standard Bullish Flag pattern ** over a time from early April till today. 🚩🐂
Also, the structure of a ** reverse Head & Shoulders ** is existing and has broken the neckline! 🔄🗣️
Another indicator is an existing "** Ascending Bull Flag **." ⬆️🚩
Please take the time to let me know what you think about this. 💬
-------------------------------------------------------------------------
This is just my personal market idea and not financial advice! 📢 Trading gold and other financial instruments carries risks – only invest what you can afford to lose. Always do your own analysis, use solid risk management, and trade responsibly.
Good luck and safe trading! 🚀📊
Turbulent Week Ahead? Gold Outlook June 9-13, 2025Hey fellow traders,
Let's dive into the OANDA:XAUUSD outlook for the upcoming week, June 9-13, 2025. The recent price action has been a rollercoaster 🎢, and the next few days promise even more fireworks 🎇.
Looking back at the 30-minute chart from May 22 to June 6, gold saw an initial consolidation, then a strong rally to multi-week highs near 3,420. However, this was followed by a sharp, dramatic reversal, pushing prices back below 3,300. This "bull trap" 🐂 pattern suggests underlying weakness and potential preemptive market positioning.
Another view on this could be the possibility that a gap on the chart at 3300-3295 of around $5 could get closed. Since strong support is right below this, it could serve as a good launchpad 🚀 for an upward rally. Let's see if the upcoming Asia session on Monday triggers this because its only - $14 from $3309.
Key Drivers for the Week Ahead:
📅 June 9, 2025 (Monday)
US-China High-Level Trade Talks Commence in London
High-level delegations from the United States and China began trade discussions in London. This meeting followed an announcement by President Donald Trump on Friday, June 6, 2025, who described a preceding 90-minute phone call with Chinese President Xi Jinping as "very positive".
The US delegation included Treasury Secretary Scott Bessent, Commerce Secretary Howard
Lutnick, and US Trade Representative Jamieson Greer, reflecting a coordinated approach to addressing complex trade issues. The talks were primarily aimed at resolving the ongoing bilateral trade war, with a particular focus on tariffs and the global supply of critical rare earth minerals.5 While no specific time for the commencement of talks was provided, it is understood they began during London's daytime, approximately (10:12 CEST / 04:12 EDT).
These discussions occurred in the context of a temporary 90-day agreement reached on May 12, 2025, which had seen the US reduce its tariffs on Chinese imports from 145% to 30%, and China reciprocate by lowering its tariffs on US goods from 125% to 10%.9 However, this temporary truce is set to expire in early August, and President Trump had recently accused China of violating the agreement, specifically regarding critical mineral exports. The broader bilateral relationship remains strained by issues extending beyond tariffs, including restrictions on advanced chips, student visas, and concerns over China's state-dominated economic model.
The prompt scheduling of these high-level talks immediately after a leader-to-leader call suggests a tactical move towards de-escalation of immediate trade tensions, aiming to prevent a full-blown trade war. The objective appears to be managing current conflicts rather than achieving a fundamental resolution, especially with the May 12 agreement nearing its expiration. The core disputes, such as control over rare earths and technology, are deeply entrenched and reflect a broader geopolitical competition rather than mere economic disagreements. This pattern of temporary de-escalation followed by persistent underlying tensions indicates a long-term,structural competition. It suggests that trade policy is increasingly intertwined with national security and geopolitical strategy, implying that businesses should anticipate continued volatility and strategic decoupling in certain sectors, rather than a return to pre-trade war normalcy.
Other big movers for gold will be the US inflation reports. 💥
📅 Wednesday, June 11 (14:30 CEST / 08:30 EDT):
We get the crucial US Consumer Price Index (CPI) data.
Watch for Core CPI (YoY) with a forecast of 2.9% and headline CPI (YoY) at 2.5%.
📅 Thursday, June 12 (14:30 CEST / 08:30 EDT):
The US Producer Price Index (PPI) follows.
Forecasts are for Core PPI (YoY) at 3.0% and headline PPI (YoY) at 2.6%.
📊 These numbers are critical. If inflation comes in hotter 🔥 than expected, it will likely strengthen the US Dollar 💵 and push real interest rates higher 📈, making gold less attractive. This could trigger further declines 📉, especially given the current market structure. Conversely, cooler 🧊 inflation could spark a significant rebound 🔄.
Beyond US data, keep an eye 👁️ on speeches from various European Central Bank (ECB) officials throughout the week, including President Lagarde on Tuesday (23:15 CEST / 17:15 EDT). Their collective tone 🎤 could influence EUR/USD dynamics and indirectly impact the US Dollar Index, offering a counterbalance ⚖️ or amplification to gold's movements.
Key Numbers and Technical Levels to Watch:
Gold is currently sitting on a substantial speculative net long position of 187.9K contracts. This is a massive amount of bullish bets 📊🐂, making gold highly vulnerable to rapid liquidation 💣 if the fundamental picture turns sour. A "long squeeze" could amplify any downside move.
Immediate Support: The 3,300 level is paramount. A decisive break below it would signal further weakness. Below that, 3,250 is strong technical support where we saw a bounce previously.
Overhead Resistance: Look for resistance at 3,350-3,360, and then the recent peak of 3,420. Reclaiming these levels would require a significant shift in sentiment.
Expect high volatility ⚡, especially around the US inflation releases. Trade smart 🧠, manage your risk ⚖️, and stay nimble! 🏃
Geopolitical News Landscape 🌍
India / Pakistan
The ceasefire from May 10 is holding, but diplomatic relations remain frosty. India has launched a global image campaign to gain support, while Pakistan insists on dialogue and accountability.
Outlook: Without substantial agreements on border terrorism and water issues, tensions will stay latently high, with potential for new escalation risks. ⚠️
Gaza Conflict
Violence escalated again in early June. Israel intensified attacks, killing civilians seeking aid in Gaza City, and at least six people were killed at a distribution point.
Outlook: The humanitarian situation continues to worsen 🚨, and international mediation efforts are urgently needed. However, an immediate ceasefire seems unrealistic. ❌
Russia / Ukraine
In the first week of June, Russia launched one of its largest series of attacks: hundreds of drones and missiles hit Kharkiv and Kyiv, resulting in civilian casualties. Simultaneously, a planned prisoner exchange has stalled.
Outlook: Strategic air attacks will likely continue 💥, and the prisoner exchange remains deadlocked. Without a diplomatic initiative, the conflict will stay entrenched. 🕳️
U.S.–China Trade War
Following talks between Trump and Xi, new negotiation rounds are expected in London. China has opened up rare earth exports, a sign of cautious de-escalation.
Outlook: If dialogue channels open 🗣️, systemic trust could grow, but genuine reforms remain uncertain. 🤔
🌐 Global Trade War
The OECD has lowered its growth outlook to 2.9%, warning of protectionism 🧱 and delayed investments. The ECB is also maintaining synchronization with the FED.
Outlook: Without de-escalation, the world faces a global economic slowdown 🐌 and permanent fragmentation of supply chains. 🔗
🏛 Trump vs. Powell
Trump has again complained about the FOMC's hesitancy, nicknaming Powell “Too Late,” and demanding a full 1% interest rate cut.
Outlook: Pressure is mounting 📣. Whether the Fed yields depends on if inflation and labor data allow for a loose policy. 🎯
💵 U.S. Inflation – May 2025
Forward-looking data shows a weakening services sector and consumer prices rising again as tariffs pass through. Official CPI data for May 2025 will be released on June 11.
Outlook: Higher inflation could halt the Fed's "dereflexion" course — a dilemma ⚖️ between growth 📈 and price stability. 🛑
Technical View 📐
Regarding the major Head and Shoulders (H&S) reversal pattern on the 4H chart I shared previously, I'd like to explain some new developments that are altering its potential outcome.
Since the price has re-entered and fallen below the neckline, I activated my "second brain cell" 🧠 to guess what could be next. This led me to revise the larger 4-hour chart structure with the adjustments shown in the accompanying image.
As you can also see in the updated version below, a reversed H&S pattern remains a possibility, as the proportions still appear valid. 🔄
Potential Scenarios for Gold 🧩
Under this revised idea, Gold could potentially reach the neckline entry at 3397 (+88) from the current price. This is one plausible scenario. ✅
Alternatively, the price could drop further to the "Head" at 3120 (-191 from the current 3309), which would, of course, invalidate this H&S pattern. ❗
While this is speculative 🔮, given that trading often involves psychological movements and their resulting impacts, I believe this is a favorable approach to forecasting.
Another reason to see it as bullish is the formed standard bull flag 🚩🐂.
Please take the time to let me know what you think about this. 💬
-------------------------------------------------------------------------
This is just my personal market idea and not financial advice! 📢 Trading gold and other financial instruments carries risks – only invest what you can afford to lose. Always do your own analysis, use solid risk management, and trade responsibly.
Good luck and safe trading! 🚀📊

Looks like a Bull Flag forming on Gold againDespite the RSI on the Monthly indicating gold being in over-bought territory, the daily chart on Gold is forming a bull flag pattern. The measured move up and target price for Gold if it breaks out of the $3400 area is $3900/oz.

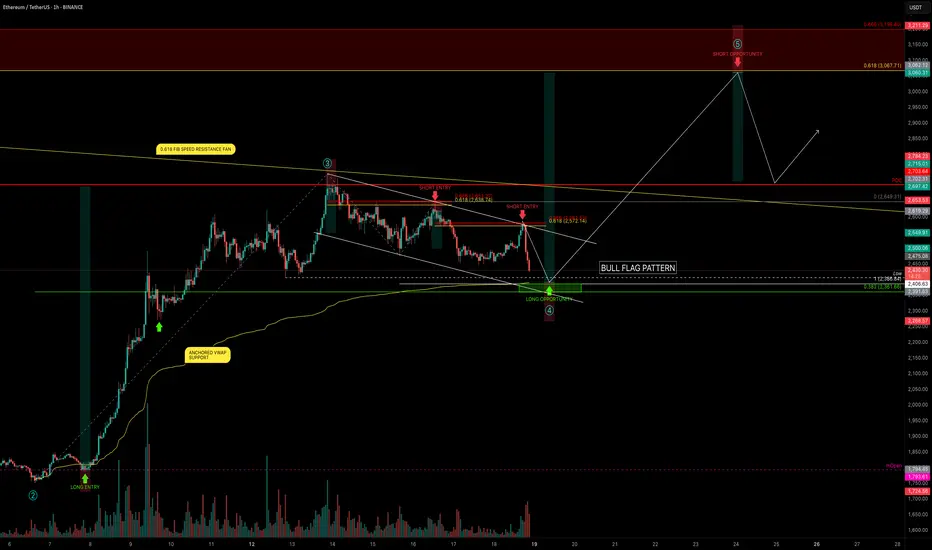
ETH — Bull Flag or Trap? Trade Plan with TargetsETH is setting the stage for its next major move — and the chart is packed with clues.
After completing Wave 3 at $2738.50, ETH has entered a corrective phase, forming what looks like a bullish flag. But beneath the surface, smart money levels are aligning: VWAP, Fibs, key levels, and liquidity traps are all converging around one high-probability zone.
This analysis breaks down both the long and short setups, backed by real confluence and clean R:R opportunities. Whether you’re planning to snipe the reversal near support or fade the rally at resistance, you’ll walk away with a clear trade plan and deeper insight into how price reacts at precision levels.
Let’s get into it.
🟢 Bullish Scenario: Long Setup with Deep Confluence
After a fakeout pump into the golden pocket of this minor downtrend (typical for a Sunday), ETH rejected cleanly at the upper resistance of the bull flag channel.
We're now watching for the swing low at $2406.63 to be swept, setting up a potential SFP (Swing Failure Pattern) at a highly confluent support zone:
🔍 Confluence at the $2390–$2360 Zone:
Anchored VWAP from the Wave 3 origin at $1752 is sitting at $2390
Trend-Based Fib Extension 1:1 of the correction lands at $2386.84
Liquidity pool just under the recent swing low
0.382 Fib retracement of the entire Wave 3 at $2361.66
0.618 Fib Speed Resistance Fan intersects this zone
Lower bull flag support line also aligns
This makes the $2390–$2362 zone a high-probability bounce area.
📌 Plan:
Laddered long entries between $2390–$2362, watching closely for a clean SFP or reversal signal.
Target 1: $3000 psychological level
Target 2: 0.618 Fib retracement at $3067.71 (potential Wave 5 top)
Stop-loss: Below previous yearly open (can be tightened after confirmation)
R:R: 1:5 or better after SL adjustment
🔴 Bearish Scenario: Short Setup at Key Rejection Zone
If ETH makes a move up to complete the 5th wave, we monitor $3067.71 — the 0.618 retracement of the entire corrective leg — as a key resistance.
If price rejects here with momentum loss or bearish structure:
📌 Plan:
Short on confirmed rejection of $3067.71
Stop-loss: Above $3211 (above 0.666 Fib)
Target: Previous high near $2700 or lower
R:R: 1:2 or better depending on entry and structure
🧠 Educational Insight: Why Confluence Increases Probability
Many traders chase setups based on single indicators. Real edge comes from stacking independent tools: VWAPs, Fibs, FVGs etc... When they align, the setup isn’t random — it’s high conviction.
This strategy gives you a framework to anticipate where price is likely to move and why, rather than reacting emotionally.
Patience and preparation will always outperform panic and reaction. Trade the plan — not the impulse.
___________________________________
If you found this helpful, leave a like and comment below! Got requests for the next technical analysis? Let me know.
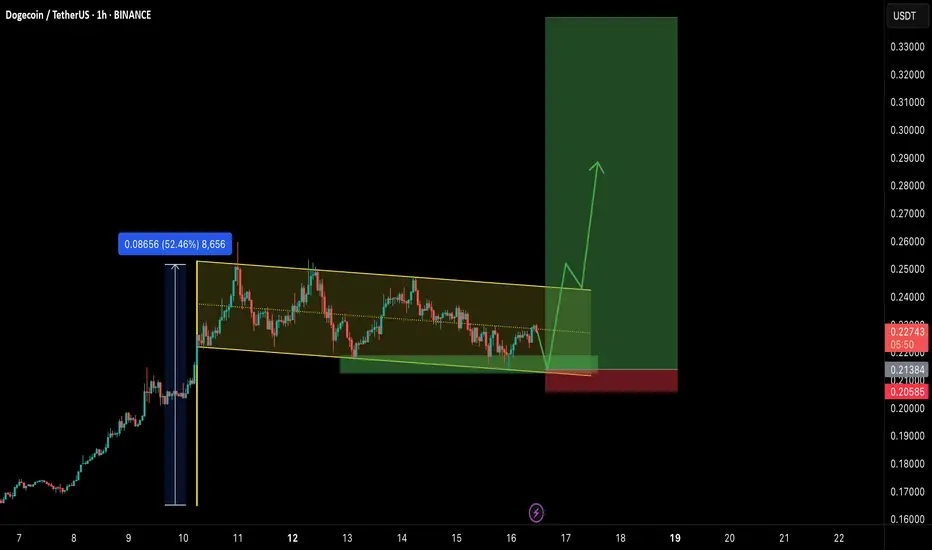
DOGE/USDT: BULLISH FLAG FORMATION!!🚀 DOGE Bull Flag Formation – 60% Potential Incoming?! 👀🔥
Hey Traders! If you're all about high-conviction plays and real alpha, smash that 👍 and tap Follow for more setups that actually deliver! 💹💯
Dogecoin is setting up beautifully inside a falling channel – a classic bull flag pattern after a strong 52% rally last week. 📉📈
Price is now consolidating near the lower support of the flag structure, with a bounce zone clearly visible. If this support holds, we could see a strong impulsive breakout in the coming sessions.
🔹 Potential Play:
Entry Zone: Current levels to slight dips ($0.213–$0.218)
Targets: $0.26 / $0.29 / $0.31+
Invalidation: Daily close below $0.205
💥 Breakout confirmation with volume could trigger a fresh leg up. Keep this on your radar — it’s gearing up for a move!
📊 Let me know your thoughts in the comments — bullish or bearish?
$HBAR Near Key Resistance: Will the Bull Flag Explode?CRYPTOCAP:HBAR is trading within a bull flag on the 2-day chart, holding just below a key resistance zone that was previously support. The 100 EMA is also acting as a dynamic barrier here.
A breakout above $0.188 with strong volume could trigger the next bullish leg.
But if resistance holds, a short-term pullback might follow.
DYOR, NFA

BNB/USDT: BREAKOUT SETUP!!🚀 Hey Traders! Ready to Ride the BNB Breakout? 👋
If you’re hyped for this setup, smash that 👍 and hit Follow for elite trade ideas that actually deliver! 💹🔥
🔥 BNB Breakout Alert – Big Move Incoming! 🔥
BNB is looking strong and bullish, breaking out from a bull flag formation on the 4H timeframe. If it holds above the flag, we could see a massive 40% surge! 📈
💰 Trade Setup:
📍 Entry Range: $588 - $600
🎯 Targets: $628 / $688 / $746 / $794 / $844
🛑 Stop-Loss: $566
⚡ Leverage: Low (Max 5x)
🔎 Strategy: Enter with low leverage now, add more on dips, and ride the momentum to higher levels!
💬 What’s Your Take?
Are you bullish on BNB’s breakout potential? Share your analysis, predictions, or strategies in the comments! Let’s secure those gains and ride this wave together! 💰🚀🔥

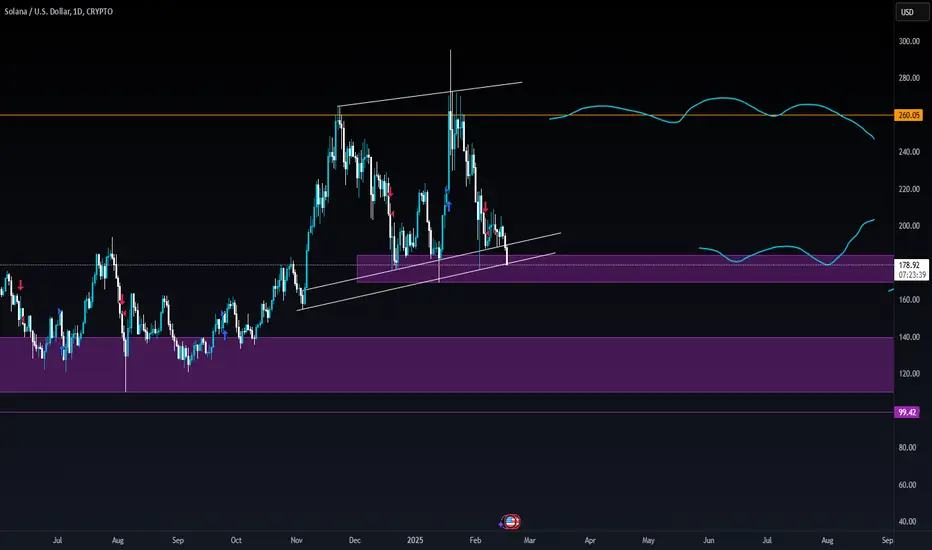
Sol short/Bearish!Here is another idea for the sol, it is falling from the pattern with double top on 1D time frame. Let's see how it goes.
Bounce zones are marked on previous idea!
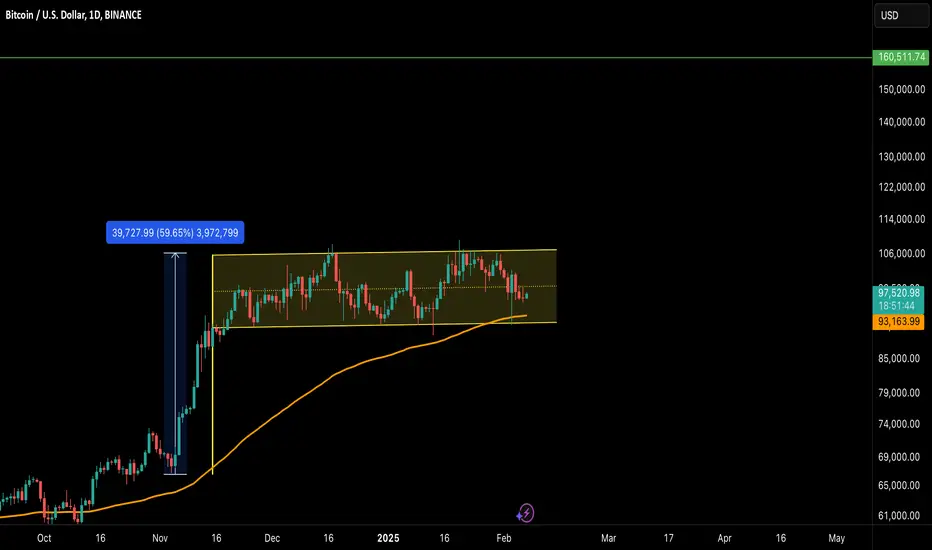
#BTC: FORMING BULL FLAG IN DAILY TF!!🚀 Hey Traders! Ready for BTC’s Next Big Move? 👋
If you’re finding value in this analysis, smash that 👍 and hit Follow for more high-accuracy trade setups! 💹🔥
🔷 BTC: The Only Strong Performer in Crypto Right Now!
Bitcoin has been range-bound between $90K-$108K for the past few weeks, but something big is brewing! 📊
📌 Key Insights:
🔹 Bull Flag Formation spotted on the daily timeframe, with 100MA support holding strong.
🔹 A breakout from this flag could send BTC soaring 50-60% toward $150K-$160K! 🚀
🔹 Invalidation: A daily close below $90K could trigger a deeper correction toward $70K-$75K.
💬 What’s Your Take? Will BTC break out or dip below $90K first? Drop your analysis in the comments! Let’s crush this market together! 🔥💰
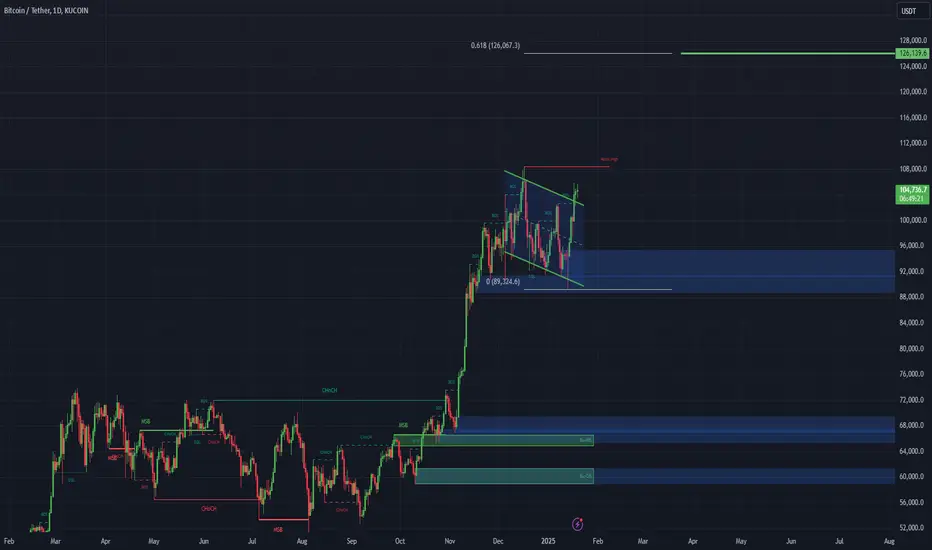
Bull Flag on BTC Daily!!!The cryptocurrency market is once again at the edge of a seismic shift. Following the recent uptrend, Bitcoin (BTC) has established a formidable Bull Flag on the daily chart. By utilizing a trend-based Fibonacci extension on top of the current Bull Flag, we can identify the coveted 'golden pocket' positioned at $126,000, with the subsequent target level at an impressive $185,000.
If historical patterns hold true, this year is set to be another record-breaking period for Bitcoin and the broader crypto market. Investors and enthusiasts alike should prepare for a potentially parabolic movement. Fasten your seat belts, an exciting journey awaits.
ETH, the pathway to a new ATHHallo everyone,
in the last weeks Ethereum was underperforming Bitcoin, but actually the chart looks quiet interesting again. The price broke out of a huge bull flag, but with the large correction in Bitcoin it fell under the breakout level again. Now it's approaching the breakout for the second attempt. The most important levels to watch is the 2021 yearly close at 3677 . Should we see a sustained move above, which aligns with the bull flag retest, ETH is set to reach new all time high prices within the new two month.
Looking at the seasonality of cryptocurrencies the first quarter of the year is a good moment to be bullish.

ICP/USDT Bull Flag Breakout is Loading....The chart highlights a classic Bull Flag pattern, which signifies a potential continuation of the upward trend. At present, the price is consolidating within the confines of the flag, indicating a phase of market indecision as it builds momentum for a breakout.
Key Observations
1. The Bull Flag structure remains well-defined, with the price oscillating inside a descending channel.
2. Support is evident along the lower boundary around the $11.5 mark, offering a logical entry point for buyers.
3. A decisive breakout above the upper boundary of the flag would confirm the bullish outlook and could trigger a strong upward surge.
4. The projected target for this move lies above $14, aligning with significant resistance levels observed previously.
Strategic Implications
Patience and vigilance are crucial. Focus on identifying a breakout above the upper boundary, ideally accompanied by increased trading volume to affirm the move. In the event of a retest near the $11-$11.5 support zone, it could provide a favorable opportunity for initiating long positions. Be mindful of potential false breakouts and use risk management strategies, such as setting appropriate stop-loss levels, to protect your capital.

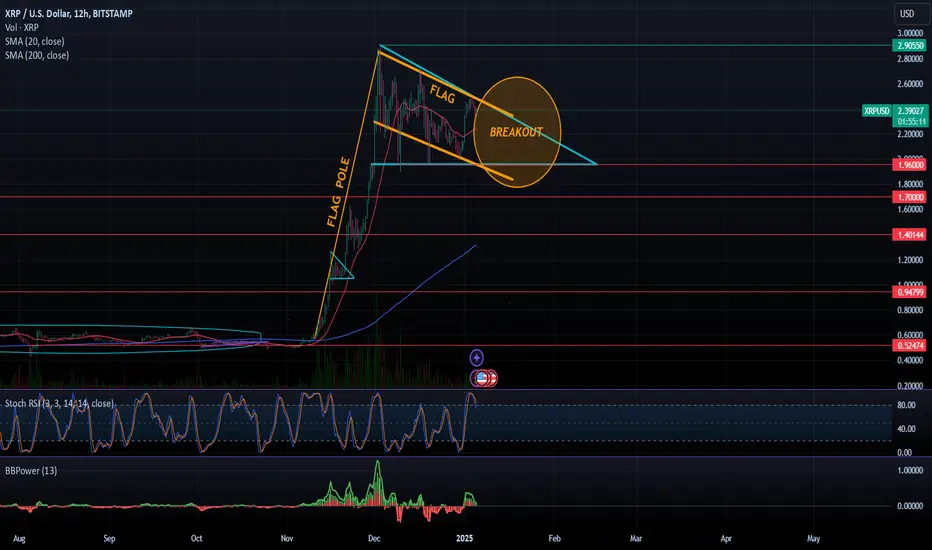
XRP - Bull FlagXRP looks to break out soon. A channel (flag) formed after XRP's uptrend (flag pole), signaling a rally to resistance levels. The Relative Strength Index (RSI) is overbought, signaling a dip before a possible breakout. A dip in the upcoming days will follow the bull flag signal, with market price striking key resistance levels.
Chart - 12hr
Resistance - $2.90
Support - $1.96
F & G Index - 61 Greed
Comprehensive Guide to Bull and Bear Flag PatternsBull and bear flag patterns are some of the most reliable and widely used chart patterns in technical analysis.
These patterns are particularly effective for traders who prefer trading with the trend, offering clear entry and exit points.
They appear frequently in trending markets and represent short consolidations before the trend resumes.
In this guide, we’ll cover the characteristics of bull and bear flags, trading strategies, and how to enhance your flag trading using multi-timeframe analysis.
What Are Bull and Bear Flag Patterns?
Bull and bear flags are continuation patterns, meaning they signal the potential for a price move to continue in the direction of the prior trend after a brief consolidation or retracement.
Bull Flag: This pattern occurs during an uptrend. After a sharp rise in price (the flagpole), the price begins to consolidate within a downward-sloping channel (the flag). A breakout to the upside typically follows, continuing the trend.
Bear Flag: In a downtrend, after a strong decline (the flagpole), the price consolidates in an upward-sloping channel (the flag). When the price breaks downward, it continues the downtrend.
These patterns are valuable for traders as they provide clear entry signals when the price breaks out of the flag's consolidation range.
Anatomy of a Flag Pattern
The flag pattern consists of two main components:
The Flagpole: This is the sharp price movement that occurs in the direction of the trend. It signifies strong momentum and establishes the direction in which the trend is moving.
The Flag: The flag is a period of consolidation or retracement that follows the flagpole. The price moves within parallel or slightly converging trendlines and typically retraces about 30% to 50% of the flagpole. The flag represents a pause in the market before the trend resumes.
Key Characteristics:
Bullish Flag: Occurs in an uptrend, and the consolidation takes place in a downward-sloping channel.
Bearish Flag: Occurs in a downtrend, and the consolidation takes place in an upward-sloping channel.
Volume (if you trade Crypto or stocks) tends to decrease during the consolidation phase and increases significantly at the breakout point, confirming the continuation of the trend.
Trading Strategies for Bull and Bear Flags
While bull and bear flags are relatively simple to identify, using different strategies can help enhance the effectiveness of trades. Here’s a breakdown of the most effective approaches to trading these patterns:
1. Breakout Strategy
The breakout strategy is a straightforward approach that traders use to enter a position when the price breaks out of the flag's consolidation. This marks the continuation of the trend and offers a high-probability setup.
Entry: Enter the trade when the price breaks above the upper trendline of a bull flag or below the lower trendline of a bear flag.
Stop-Loss: Place the stop just outside the flag’s opposite boundary (below the flag for bull flags or above for bear flags).
Take-Profit: Measure the length of the flagpole and project it from the breakout point. This will give you a target for where the price could potentially move.
2. Multi-Timeframe Strategy
The multi-timeframe strategy involves using multiple timeframes to analyze the flag pattern. This strategy can provide a more robust confirmation for entering the trade, as it gives you a broader perspective on the overall trend.
Higher Timeframe Analysis: Begin by analyzing a higher timeframe (e.g., the daily chart). Look for a strong trend, either bullish or bearish, and identify if a flag pattern is forming within this trend.
Lower Timeframe Confirmation: Once the pattern is identified on the higher timeframe, zoom in on a lower timeframe (e.g., the 1-hour or 4-hour chart) for precise entry points. Look for the price to break out of the flag pattern on the lower timeframe, confirming the trend continuation.
Why Use This Strategy?
Multi-timeframe analysis reduces the risk of false breakouts by confirming the broader trend on a higher timeframe.
It allows you to refine your entries by using a lower timeframe for greater precision.
Note:
A critical benefit of this strategy is its ability to significantly enhance the risk-to-reward (R:R) ratio, with the example presented achieving an impressive 1:5 ratio. This means that for every unit of risk taken, the potential reward is five times greater—a highly efficient use of capital and risk management.
3. Pullback Entry Strategy
The pullback entry strategy offers a more conservative approach to trading flag patterns. Instead of entering at the initial breakout, this strategy waits for a pullback toward the breakout level to confirm the trend’s continuation.
Entry: Enter the trade after the breakout has occurred but wait for the price to pull back to the flag’s trendline. This pullback gives you a better risk-to-reward ratio.
Stop-Loss: Place the stop just below the flag’s trendline for a bull flag or above it for a bear flag.
Take-Profit: As with the breakout strategy, project the flagpole's length from the breakout point for your target.
When Not to Trade Flag Patterns
While flag patterns are reliable, they are not always guaranteed to work. There are specific conditions when you should avoid trading them:
Choppy or Sideways Markets: Flags perform best in trending markets. If the market is choppy or moving sideways, flag patterns are less likely to lead to a strong breakout.
Weak Flags: If the flag's consolidation is too broad or the market loses momentum during the consolidation, the breakout may be weak or fail altogether.
Conclusion
Bull and bear flag patterns are essential tools in any trader's toolkit, offering high-probability setups in trending markets.
By understanding how to spot them, applying different trading strategies, and incorporating multi-timeframe analysis, traders can enhance their chances of success.
Final Tip: Always combine flag patterns with good risk management techniques, such as proper stop-loss placement and positive risk:reward.

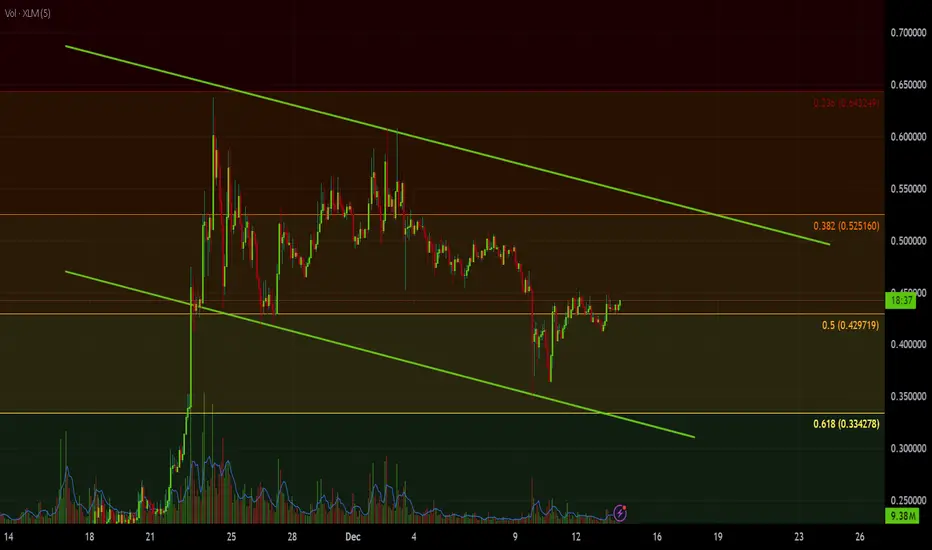
XLM/USDT BULL FLAG In this idea I show that XLM is about to pump out of a bull flag and really start taking off. Pretty basic chart here not too much frills or fluff. Hope you get in for the ride much love - ND
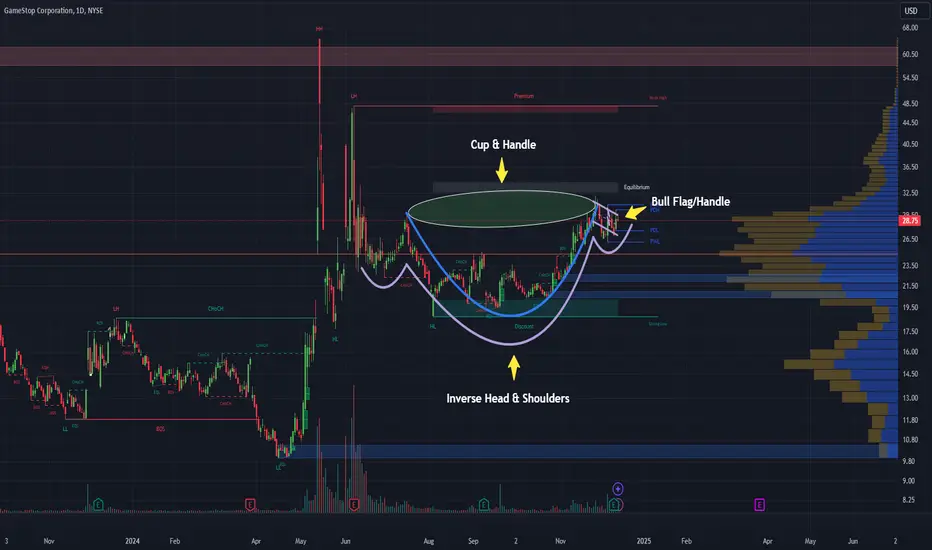
Inverted Head & Shoulders, Cup & Handle, Bull Flag GME DailyHey, everyone. It's that time again for the latest market update on GME. The charts are buzzing with activity, and we have some exciting developments to share.
Currently, we are trading within a substantial Bull Pennant on both the 15-minute and 1-hour charts. This indicates strong consolidation and potential for a significant move upwards. Additionally, we have a Bull Flag on the 4-hour chart, adding to the bullish sentiment.
On the daily timeframe, we've formed an impressive Cup & Handle, an Inverse Head & Shoulders, and a Bull Flag for the handle of the cup. These patterns are powerful indicators of potential upward momentum.
But that's not all! We are also in the midst of a significant Golden Cross on both the daily and weekly charts. This crossover of moving averages is a strong bullish signal, suggesting that we could be on the verge of a major uptrend.
Here’s a detailed technical breakdown:
15-minute chart: Bull Pennant
1-hour chart: Bull Pennant
4-hour chart: Bull Flag
Daily chart: Cup & Handle , Inverse Head & Shoulders , and Bull Flag
Weekly chart: Bull Flag & Golden Cross
For those who are new to these updates, it's worth noting the historical context: The last time GME had a Golden Cross on the weekly chart was back in January 2021. Following that, GME saw an incredible 12,000% run over just 183 trading days.
With the return of the Kitty and all systems go across all timeframes, the stage is set for a potentially explosive movement. Stay tuned and be ready for what promises to be an exhilarating ride.
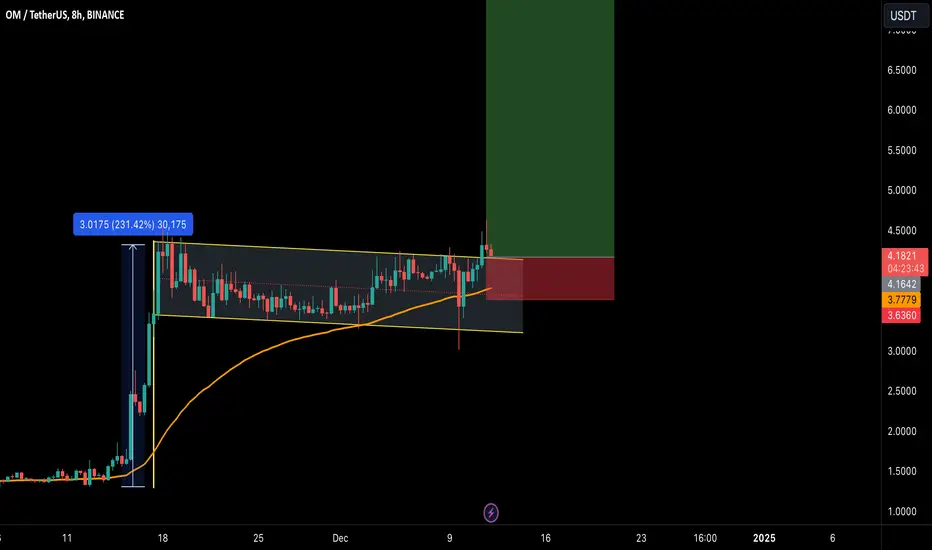
OM/USDT: BULL FLAG BREAKOUT! 200% PUMP INCOMING!!🌟 Hey Traders! 👋
If you're ready to capitalize on premium trade setups, hit that 👍 and follow us for more high-value insights that deliver results! 💹🚀
🔍 Technical Overview
🔥 OM is looking exceptionally bullish! It has broken out of a bull flag pattern on the 8-hour time frame and is currently retesting the flag—a prime accumulation zone. This setup hints at explosive upside potential.
Here’s the play:
📈 Entry Zone: $4.00–$4.20
🎯 Target: 150–200% gains
🛡️ Stop-Loss: $3.62
🌐 Fundamental Analysis:
What is OM?
OM is the native token of the MANTRA DAO ecosystem, a decentralized finance (DeFi) platform focused on staking, lending, and governance. It empowers users to actively participate in the project while earning rewards.
Key Growth Drivers
DeFi Adoption: OM is positioned as a key player in the growing DeFi space, with increasing traction.
Utility Expansion: The token is used for governance, staking, and liquidity mining, creating constant demand.
Strong Community Support: Backed by a loyal community, OM continues to innovate and grow its ecosystem.
🚀 The Opportunity
OM is not just a technical setup—it’s a fundamentally sound project with strong growth potential. This is your chance to accumulate before the market catches on.
💬 Your Take?
Do you see the same upside potential? Drop your analysis and strategies in the comments below—let’s collaborate and ride this wave together! 🌊🔥
👉 Follow us for more market-winning trade setups and real-time updates!
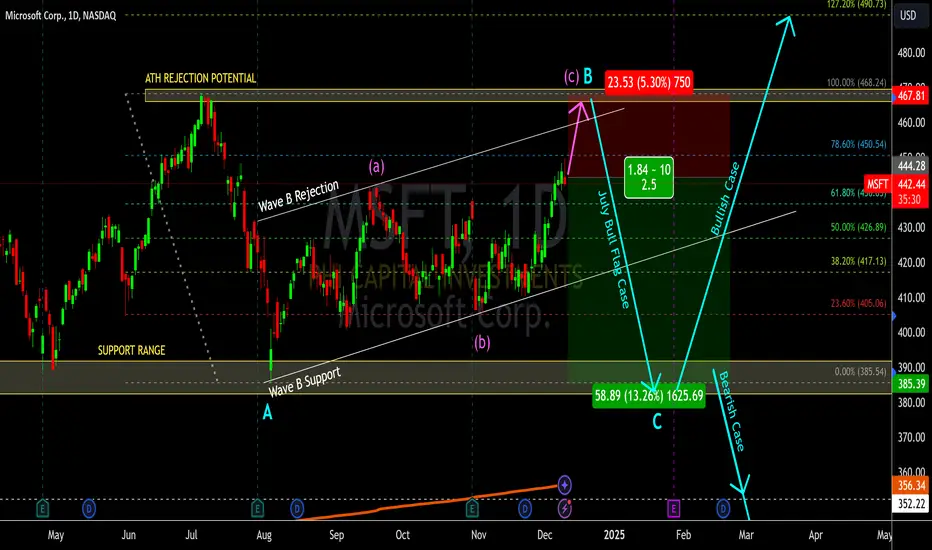
(1D) MICROSOFT ANALYSIS (MSFT)Inspired by today's failed Bitcoin shareholders' vote, I've put up my prognosis for Microsoft MSFT for the next few months. MSFT is down almost 1.5% on the day, rejecting at the 78.8% retracement of the down move from the ATH.
There are a couple possible scenarios going forward. Bullish case is that MSFT started a Bull Flag Correction (waves labeled in blue) with the pivot from the ATH in July. If so, we are completing Wave B of this flag (internal waves labelled in purple) , which may have completed already with this 78.6% rejection. However, we could still see it complete a 100% retracement instead and terminate as a Double Top, retesting and getting rejected at the ATH. This would signal the start of Wave C. We could expect this final wave to have a similar size to Wave A, giving us a short-term 17% Short play from the ATH before ultimately continuing the larger upside trend.
Bearish case would be that Wave B described above (labelled in purple) is instead actually a Bear Flag for downside. This would have to be confirmed with a break below the $385 Support Range.
**This analysis would be invalidated if we do indeed get a breakout above the current ATH, factoring in for some % overshoot (aka fake breakout).
XRP Christmas Rally Imminent! New All time high incoming!!BITSTAMP:XRPUSD Your last opportunity to get XRP at a discount before it goes parabolic is presenting itself. $1.52 -$ .1.50 is the target bottom....
If it doesn't get back down to $1.96, then that means $1.96 was the bottom, and we would backtest that level and break straight out of this bull flag pattern! 🚀
reversal of this downtrend, an ABC correction, could possibly be complete by the 11h of Dec.

TEL Symmetrical Triangle or Bull Flag ComparisonIs this a Symmetrical Triangle or Bull Flag?
Here is how we decide. The triangle is in white, the flag is in pink.
Symmetrical Triangle:
higher lows and lower highs, representing a period of consolidation and indecision.
The breakout direction typically depends on the preceding trend
Bull Flag:
A bull flag appears after a strong upward move (the “flagpole”) and consolidates downward in a parallel or slightly sloping trend.
It signifies a continuation pattern, with a breakout expected to align with the prior uptrend.
Analysis
The prior move has seen strong upward momentum (55%, 44%, 33%), which supports the idea of a bull flag if the triangle is sloping slightly downward.
However, if the triangle is symmetrical with equal pressure from buyers and sellers (not tilted), it’s likely a symmetrical triangle signaling indecision. I believe this is tilted upwards, signifying bullish. This is confirmed by the fact that net volume is $11 million above sell volume at time of writing.
If it’s breaking above the triangle now and aligns with my target of $0.009, the breakout could validate it as a bull flag continuation pattern.
2. Key Factors Supporting the Analysis:
Bounce off the 100-day Moving Average:
A bounce off a significant moving average like the 100-day MA is typically bullish, indicating that buyers stepped in at a key support level.
Breakout Above Triangle:
Early signs of breakout above the triangle suggest bullish momentum building up. If confirmed with volume, this supports the bull flag hypothesis.
Upcoming Catalyst (Public Hearing):
The public hearing for Telbank approval on December 5 could drive speculative buying, adding bullish momentum. There may be a small sell the news effect, but if the hearing is positive this won't last for long.
Short-Term Target ($0.009):
If this really is a bull flag, the measured move target can be estimated by the height of the flagpole (the previous upward move) added to the breakout point.
Risks to Watch:
False breakouts are common in symmetrical triangles. Watch volume closely to confirm the breakout.
If the price falls back below the 100-day MA, it could invalidate the bullish setup.
Summary:
Given the price action and catalyst, the pattern appears more like a bull flag continuation. Monitor the breakout level and volume for confirmation. If the pattern holds, the short-term target of $0.009 seems reasonable.

Lets start a RIOT! 150% Potential UpsideChart #3/ 40: NASDAQ:RIOT 🪖
-Need Bull Flag Breakout at$16
-H5 Indicator is Green
-Volume Shelf Launch
-Williams Consolidation Box Thriving
🎯 $21 📏 $32 ⏳ Before 2027
NFA
