NZDJPY Potential UpsidesHey Traders, in today's trading session we are monitoring NZDJPY for a buying opportunity around 87.350 zone, NZDJPY is trading in an uptrend and currently is in a correction phase in which it is approaching the trend at 87.350 support and resistance area.
Trade safe, Joe.
Bullish Patterns

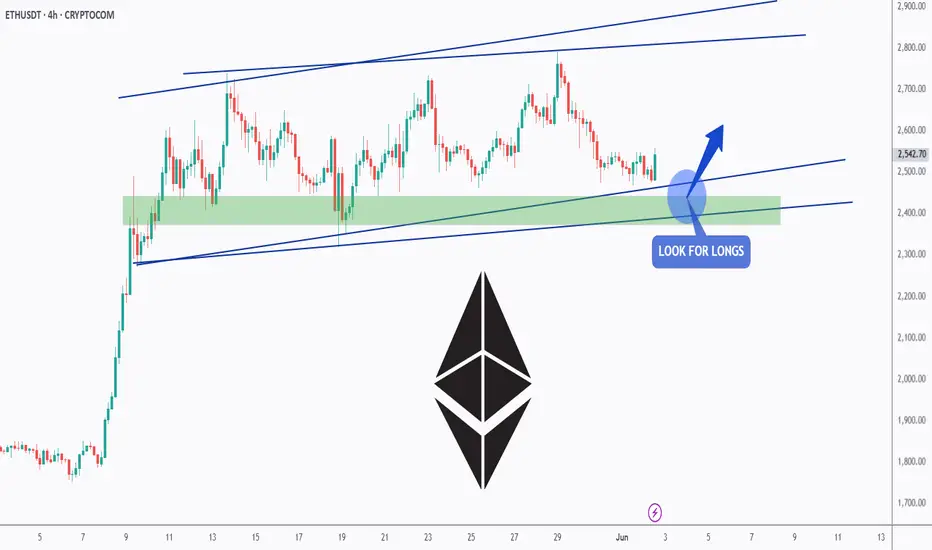
ETH - Finally Support!Hello TradingView Family / Fellow Traders. This is Richard, also known as theSignalyst.
📈ETH has been overall bullish trading within the flat rising channels marked in blue.
Moreover, the green zone is a strong support zone!
🏹 Thus, the highlighted blue circle is a strong area to look for buy setups as it is the intersection of support and lower blue trendlines acting as non-horizontal support.
📚 As per my trading style:
As #ETH approaches the blue circle zone, I will be looking for bullish reversal setups (like a double bottom pattern, trendline break , and so on...)
📚 Always follow your trading plan regarding entry, risk management, and trade management.
Good luck!
All Strategies Are Good; If Managed Properly!
~Rich
Get ready for the Breakout on GOLD!"you know how looong i been waiting for dis?!" *Gambit Voice*
Been waiting for this set up to happen and its slowly showing that its ready to break out and go for new Highs. just trying to be patient and ready for it.

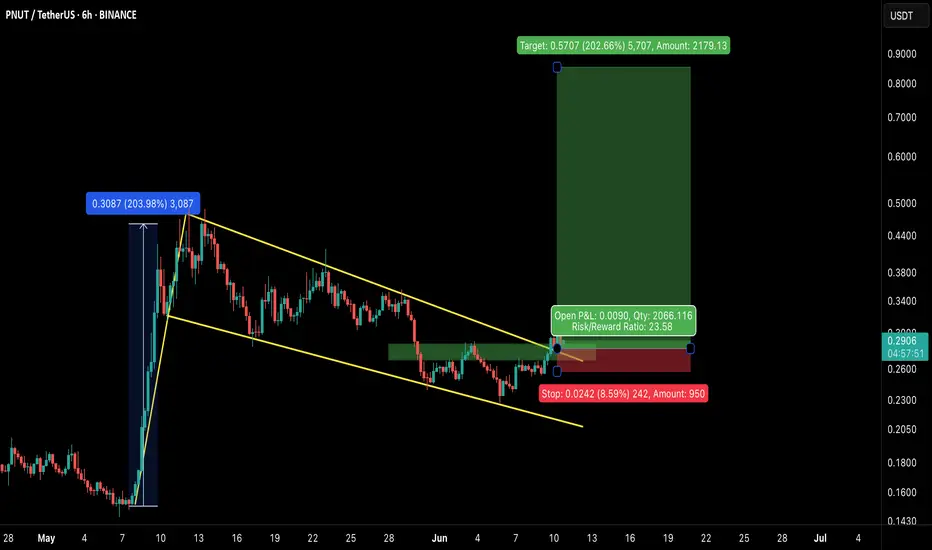
PNUT/USDT – Bullish Breakout from Falling Channel!PNUT Breakout Alert – 200% Potential on the Table
Hey Traders — if you're into high-conviction setups with real momentum, this one’s for you.
PNUT has officially broken out of a textbook falling channel after a healthy consolidation. This pattern often signals trend reversal and renewed bullish momentum — and PNUT looks ready to move.
🔹 Pattern: Falling Channel
🔹 Breakout Confirmation: Clear candle close above resistance
🔹 Previous Move: +204% before entering the channel
🔹 Current Setup: Long entry with defined risk-to-reward
🔹 Target: ~0.85
🔹 Stop: Just below the breakout zone
🧠 Technical Perspective:
Volume uptick during breakout confirms buyer strength
Strong support retest zone around 0.28–0.29
Holding above this range could fuel a significant leg higher
📌 This setup offers a clean structure with a high R:R potential. PNUT has proven it can move fast — now it’s about following the breakout with tight risk management.
📥 Add to your watchlist and let price action lead the way.
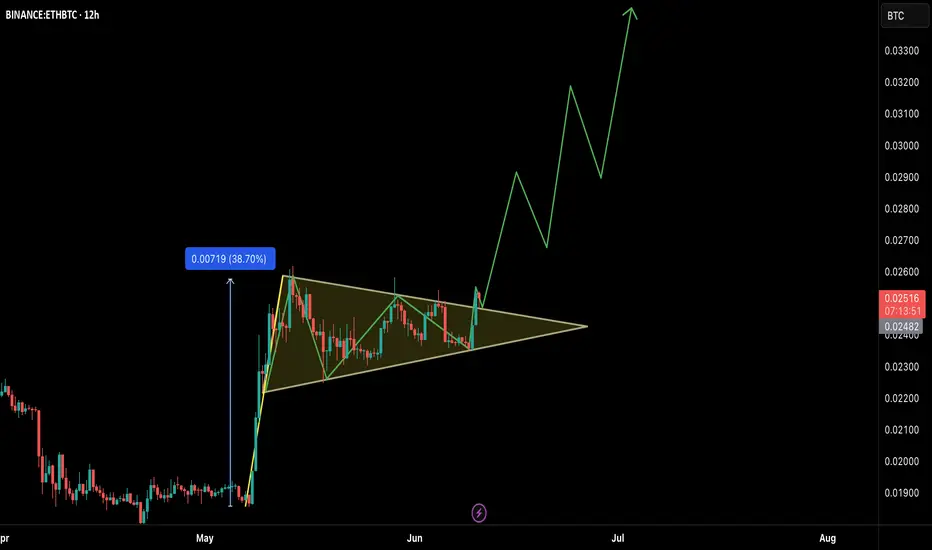
ETH/BTC : Ready to Lead the Altcoin Season?Hey Traders!
If you’re finding value in this analysis, smash that 👍 and hit Follow for high-accuracy trade setups that actually deliver!
Ethereum just broke out of a multi-week symmetrical triangle against Bitcoin — a classic continuation pattern! After consolidating for over a month, this breakout could signal a major shift in market dynamics.
Pattern: Symmetrical Triangle
Measured Move Target: +38.7% from the breakout
Timeframe: 12H
Current Ratio: 0.02517 BTC
🔍 Why ETH/BTC Matters for Altcoins:
When ETH/BTC rises, it often marks the beginning of an altcoin rally. Here's why:
✅ ETH leads altcoins — It’s the largest alt by market cap, and capital often rotates from BTC → ETH → mid/small caps.
✅ Rising ETH/BTC = Bitcoin dominance weakening, giving altcoins room to breathe.
✅ Confidence returns to the broader alt market when ETH outperforms BTC.
If this breakout sustains, we may be entering a strong altcoin season. Keep an eye on ETH strength and look for high-potential setups across the altcoin board!
What are your top altcoin picks for this potential rally? Drop them below 👇
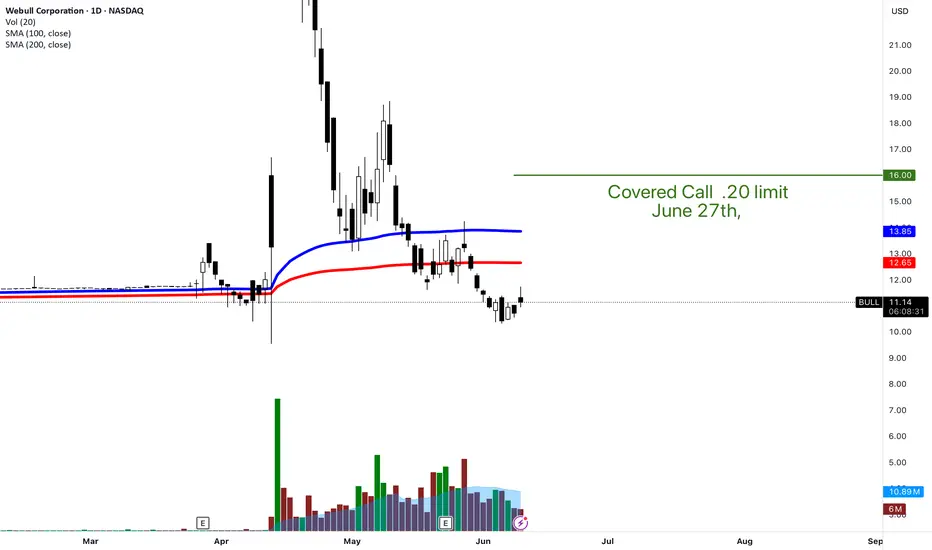
BULL COVERED CALLI'll be in this position for A WHILE. And thats okay. I am buying low and buying slow. Accumulating shares. Selling covered calls when I can and using that premium to buy more shares. Even if its 1-5 shares...
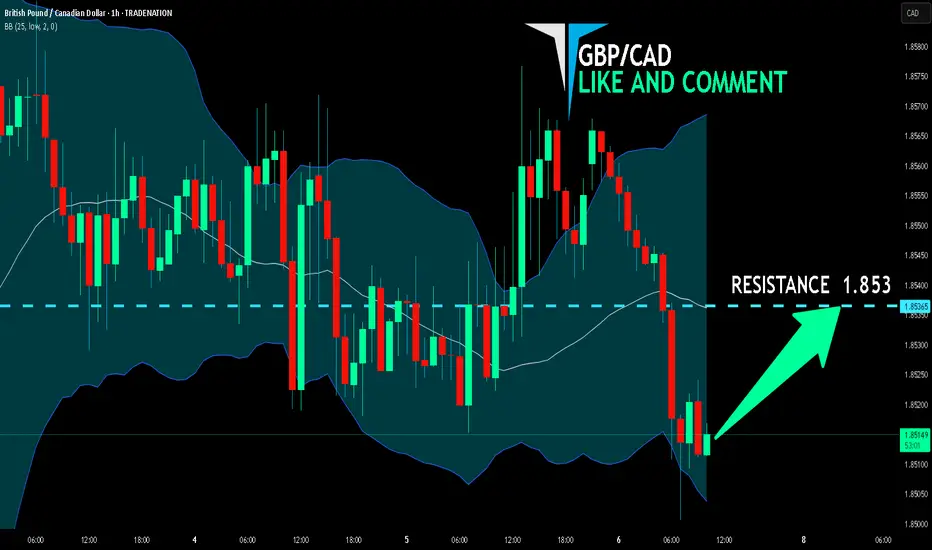
GBP/CAD BULLISH BIAS RIGHT NOW| LONG
Hello, Friends!
GBP/CAD pair is trading in a local uptrend which know by looking at the previous 1W candle which is green. On the 1H timeframe the pair is going down. The pair is oversold because the price is close to the lower band of the BB indicator. So we are looking to buy the pair with the lower BB line acting as support. The next target is 1.853 area.
Disclosure: I am part of Trade Nation's Influencer program and receive a monthly fee for using their TradingView charts in my analysis.
✅LIKE AND COMMENT MY IDEAS✅
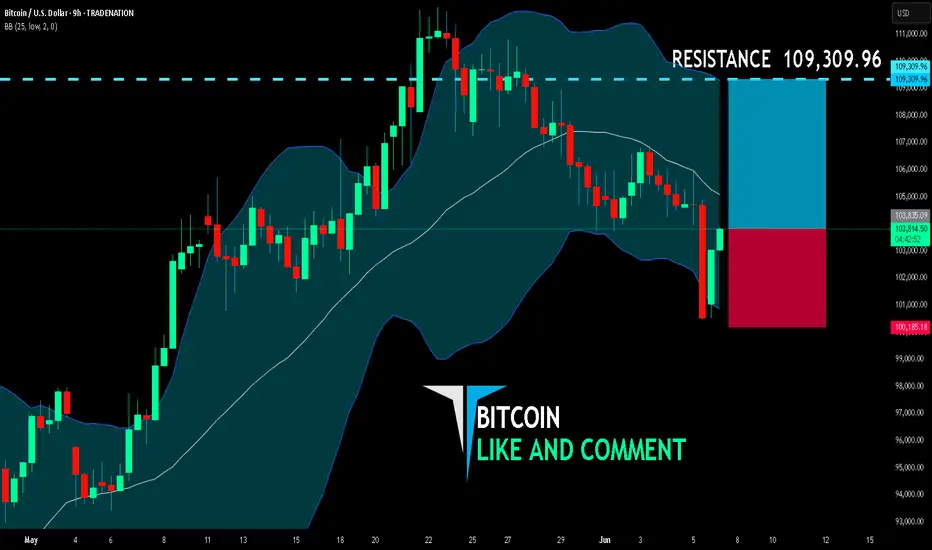
BITCOIN BULLS ARE GAINING STRENGTH|LONG
BITCOIN SIGNAL
Trade Direction: long
Entry Level: 103,835.09
Target Level: 109,309.96
Stop Loss: 100,185.18
RISK PROFILE
Risk level: medium
Suggested risk: 1%
Timeframe: 9h
Disclosure: I am part of Trade Nation's Influencer program and receive a monthly fee for using their TradingView charts in my analysis.
✅LIKE AND COMMENT MY IDEAS✅
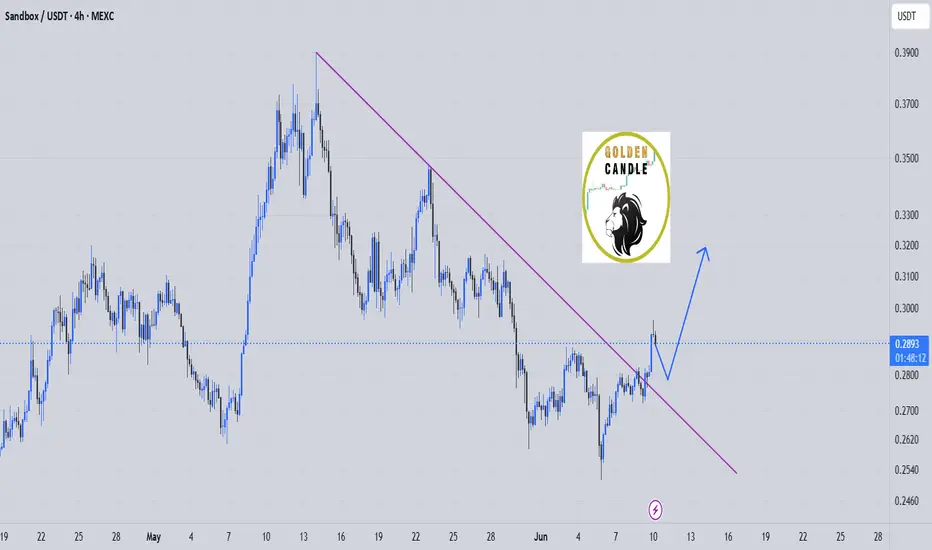
sand buy spot "🌟 Welcome to Golden Candle! 🌟
We're a team of 📈 passionate traders 📉 who love sharing our 🔍 technical analysis insights 🔎 with the TradingView community. 🌎
Our goal is to provide 💡 valuable perspectives 💡 on market trends and patterns, but 🚫 please note that our analyses are not intended as buy or sell recommendations. 🚫
Instead, they reflect our own 💭 personal attitudes and thoughts. 💭
Follow along and 📚 learn 📚 from our analyses! 📊💡"
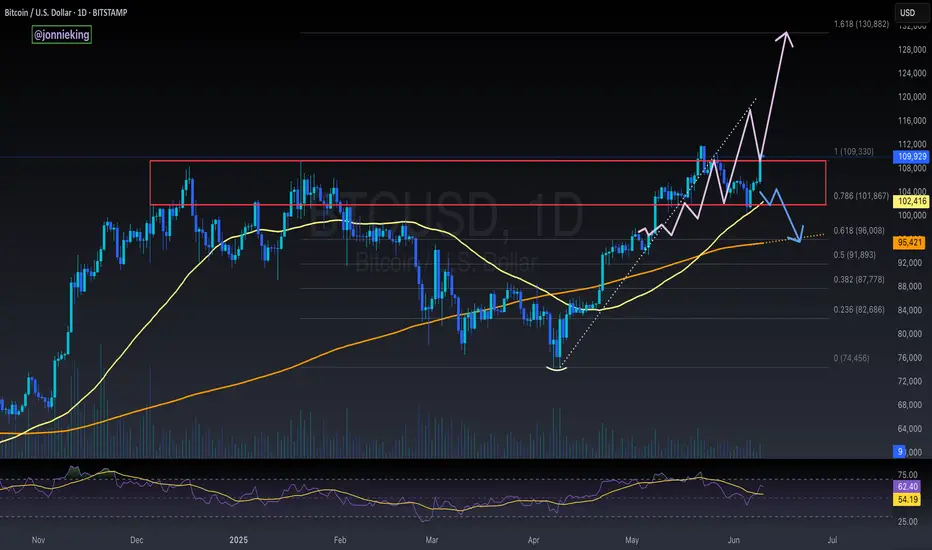
$BTC Extremely Bullish Daily Close - Parabola Underway?Hawt diggity dayumm 🥵
CRYPTOCAP:BTC really going for it following my original idea behind the parabola formation 🤯
Reclaiming ATH high at $112k will confirm the move 🤞
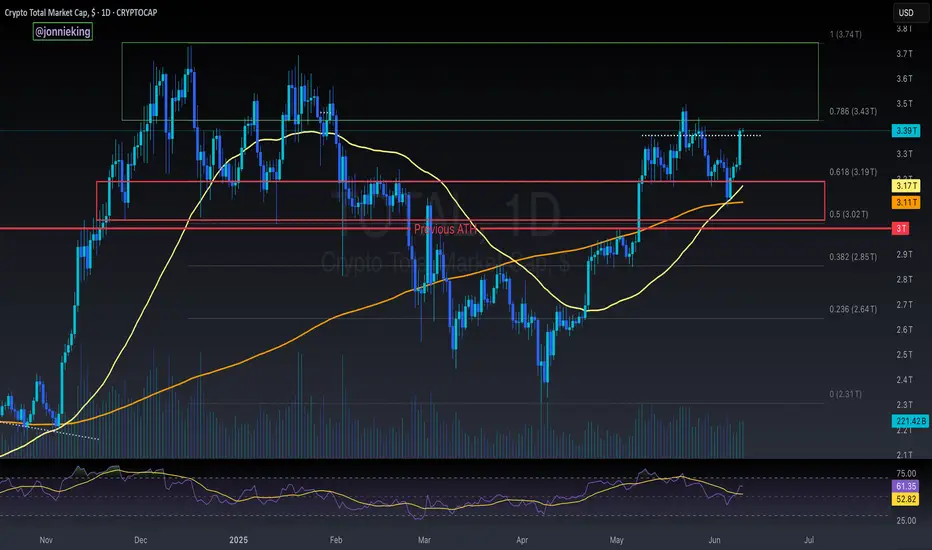
$TOTAL Crypto Market Cap Relief Rally Could be MassiveHUGE relief rally today for Crypto CRYPTOCAP:TOTAL Market Cap 🚨
Need to reclaim local high at $3.5T to confirm this reversal.
If so, we could push to reclaim this cycle's high ~$3.75T
Nonetheless, glad I got some bids filled on this recent correction 😎
I still have some set in case we go lower tho.
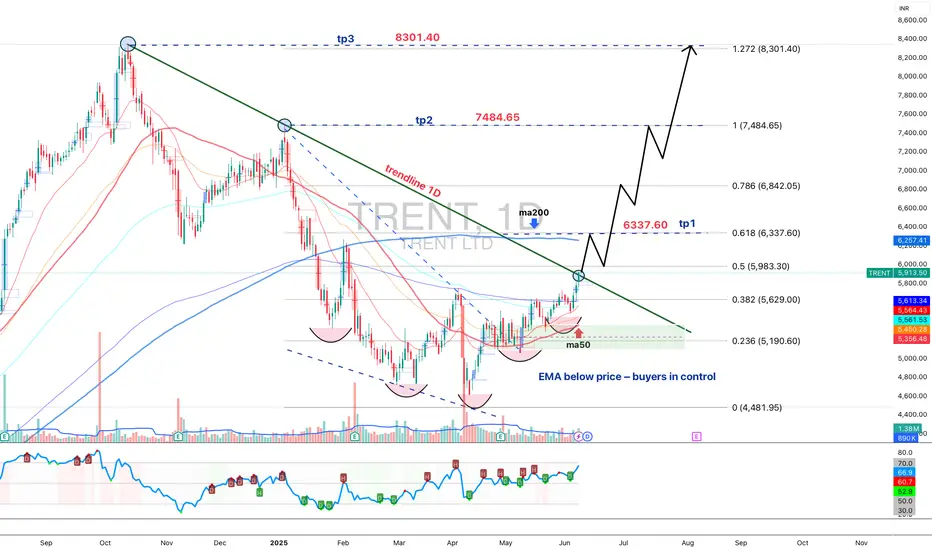
Trent Ltd: Breakout or Fakeout?Trent Ltd: Breakout or Fakeout? Someone’s positioning — the question is which side.
Trent Ltd remains one of the more resilient players in India’s retail landscape. While broader consumer sentiment remains mixed, the company continues expanding its footprint, especially through its Westside stores and fashion vertical. Recent earnings have been stable, and institutional interest appears to be creeping back in — confirmed by a steady rise in volume.
Technically, we’re at a decision point. Price is testing a major descending trendline drawn from the all-time highs. So far, no breakout — but signs of accumulation are building. All major EMAs (50/100/200) are below the price, putting buyers firmly in control. Volume is rising on bullish candles, with no signs of distribution. RSI is holding above 50, climbing steadily, and showing a healthy impulse without overheating — plenty of room left for upside.
The key setup: wait for a confirmed breakout above the trendline, then a retest, and only after that consider entering. Targets, based on Fibonacci levels, line up cleanly:
tp1: 6337.60 (0.618)
tp2: 7484.65 (1.0)
tp3: 8301.40 (1.272)
Until then — this is a watching game, not a trading one. Momentum is building, the structure is clean — but confirmation is king.
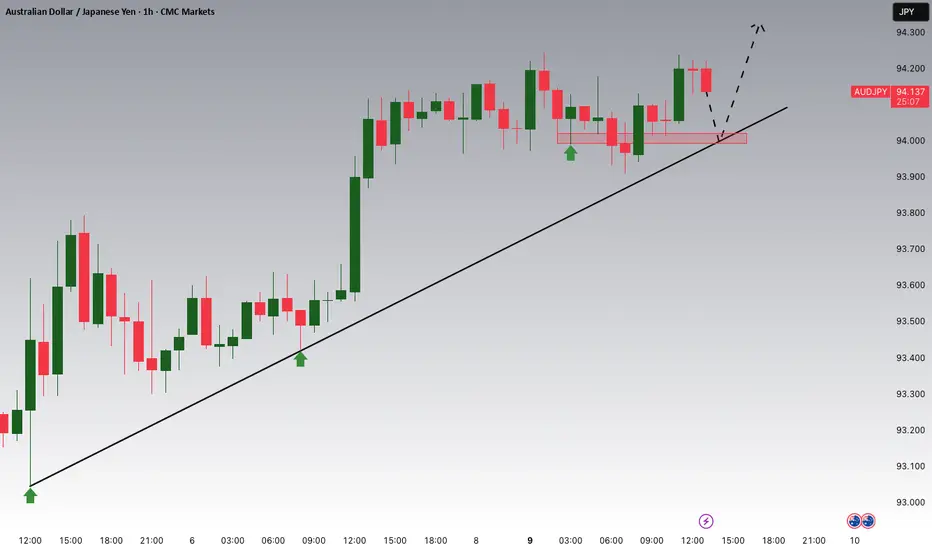
AUDJPY Potential UpsidesHey Traders, in today's trading session we are monitoring AUDJPY for a buying opportunity around 94.000 zone, AUDJPY is trading in an uptrend and currently is in a correction phase in which it is approaching the trend at 94.000 support and resistance area.
Trade safe, Joe.
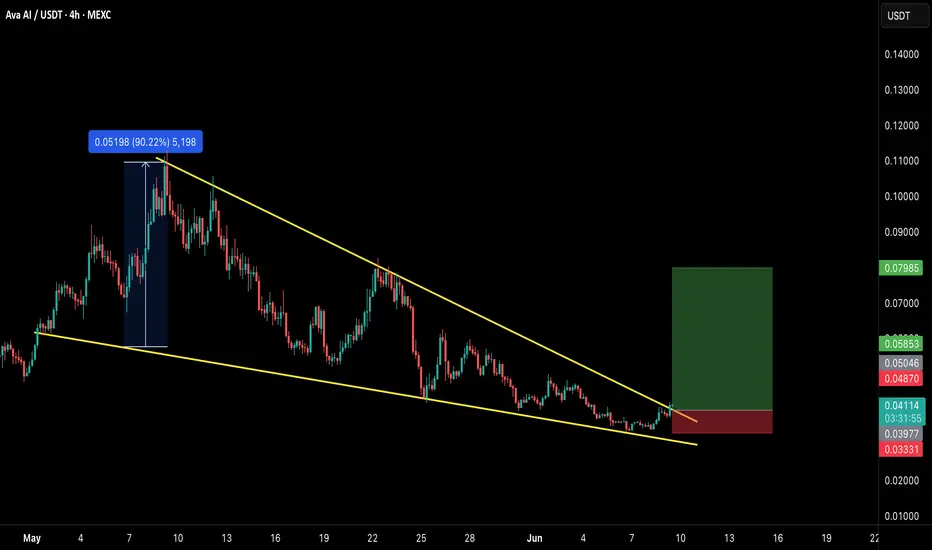
AVAAI/USDT: FALLING WEDGE BREAKOUT! 90%+ PROFIT POTENTIAL!!AVAAI Breakout Alert – 90%+ Potential on the Table
Hey Traders — if you're into high-conviction setups with real momentum, this one’s for you.
AVAAI has officially broken out of a falling wedge structure on the 4H timeframe — a classic bullish reversal pattern. After weeks of downtrend, price finally closed above resistance with volume.
📌 Entry: Current Market Price (CMP) and add more up to $0.0487
🎯 Targets: $0.0585 / $0.0670 / $0.0798
🛑 Stop Loss: $0.0412
📈 Leverage: 5x–10x (low to moderate)
We’ve already seen a 90% move last time from this zone — if momentum holds, a repeat isn’t off the table. Breakout confirmed. Now it's all about the follow-through.
What's your take on AVA AI here? Are you riding this breakout or staying cautious?
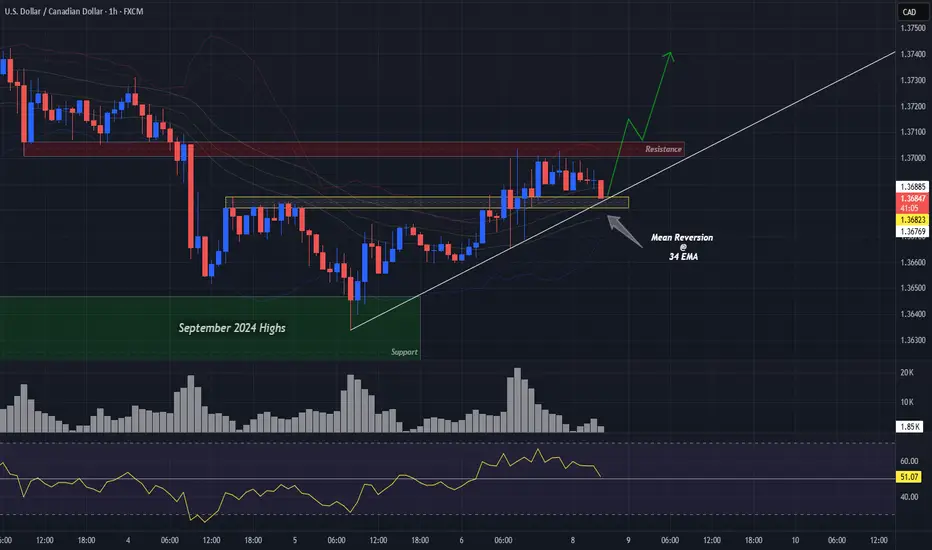
UCAD Bulls Look for 3rd Test After Sept. '24 Highs TouchOANDA:USDCAD Bulls were able to find support at the Sept. 2024 Highs after having traveled down a Falling Support for the past 2 months!
Now we see Bulls pushing price higher creating a Rising Support with 2 tests having been successful and currently coming down for a 3rd test!
Now Price has already broken a Previous Level of Structure which was a Past Resistance on June 4th. This level also lands right at the 34 EMA and based on the Bollinger Bands, this test will also be a Mean Reversion where Price after having traveled in one direction will revert back to the mean of the Bollinger Bands for Continuation, which in this case will be Bullish!
After the 2nd Test of the Rising Support, we can see a Massive amount of Volume enters.
Price also is trading Above the 50 on the RSI and is currently coming down to test that level.
I am looking for Price to test the 1.3683 area and if Price shows support for a 3rd Test, this will be a great opportunity for Long Positions!
Fundamentally, USD will be bombarded heavy news being CPI numbers with analysts forecasting a .2% Increase in Inflation! Also PPI, Unemployment Claims and Prelim UoM Consumer Sentiment & Inflation Expectations.
Gold has filled in value I have been waiting to see...Looking for price to reverse from this area. Need confirmation for it first then get in on a pullback to continue.

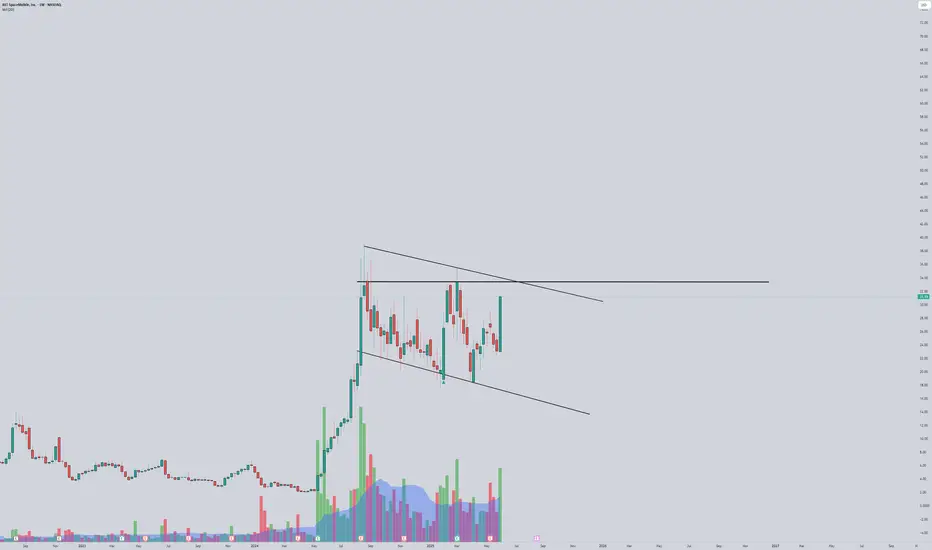
Monster Breakout brewing for ASTS🔍 NASDAQ:ASTS Weekly Chart Analysis (Accurate)
Pattern: Massive bull flag / consolidation wedge after a parabolic run.
Current Price: ~$31.20, sitting near the midpoint of the descending channel.
Structure:
Price is compressing between lower highs and higher lows.
Volume spikes on up moves, low volume on pullbacks = bullish accumulation.
Testing upper trendline of the flag — breakout could trigger a new wave.
✅ Favorable Path:
Break and weekly close above ~$34.00 (channel resistance) confirms breakout. That opens up a measured move targeting $50–55 short-term, and possibly $70+ if momentum accelerates.
🎯 Measured Move Target:
Pole base ~$6 → Flag peak ~$36 = ~$30 range
Breakout above $34 → Target = $34 + 30 = $64
⚠️ Invalidation:
A breakdown below $24–25 zone would invalidate the flag and suggest distribution instead of continuation.
🔑 Summary:
Setup: Weekly bull flag after a parabolic leg
Bias: Strongly bullish with breakout potential
Trigger: Weekly close above $34.00
Short-term target: $50–55
Full measured move target: ~$64
Invalidation zone: Below $24
Smart money appears to be loading the dips. Breakout traders should watch $34 like a hawk.
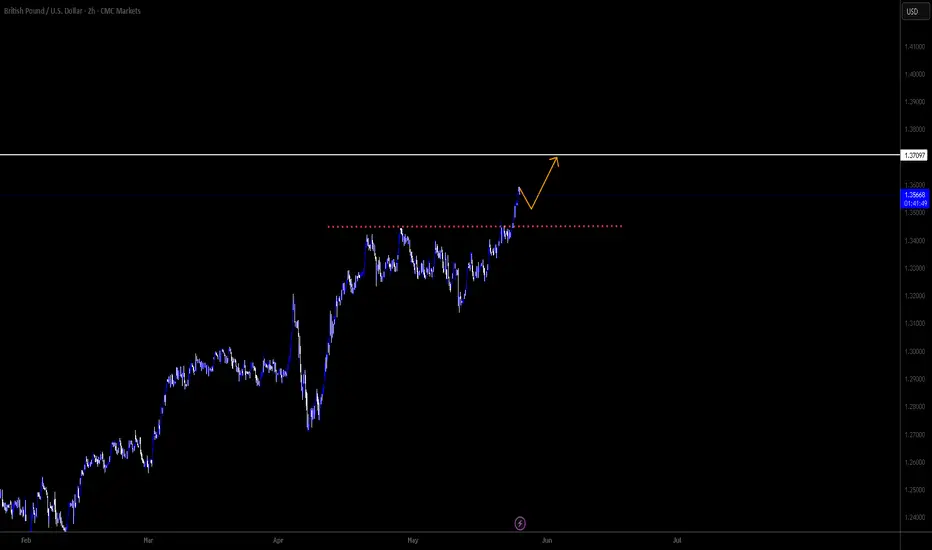
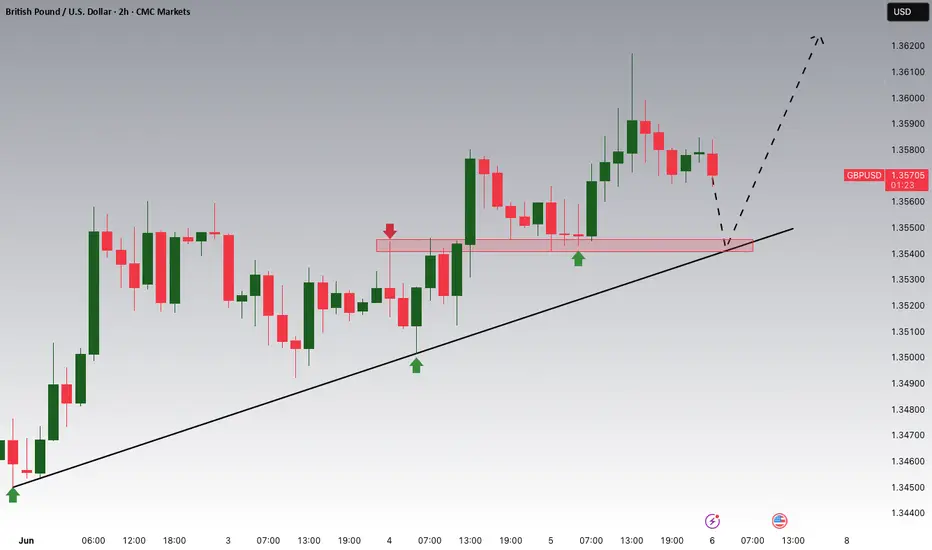
GBPUSD - Technical analysis 2HGood morning, traders, dear TradingView. It's Nika.
I want to share this trading idea, for a reason we have very important resistance level breakout!
I think the price of this pair will continue growing and will reach level 1.37097!
So some of you can just open long now, or wait and enter after a little correction.
Thank you.
Have a profitable day.
TESLA PRICE ACTION JUNE 5TH 2025Welcome to Tesla weekly &there is a news about Elon going against the bill from trump.
I will never buy their news as they are manipulating retailers.
I am buying & I have discussed all the important levels here,
If you have any doubts, feel free to leave your comments here.

GBPUSD Potential UpsidesHey Traders, in today's trading session we are monitoring GBPUSD for a buying opportunity around 1.35400 zone, GBPUSD is trading in an uptrend and currently is in a correction phase in which it is approaching the trend at 1.35400 support and resistance area.
Trade safe, Joe.
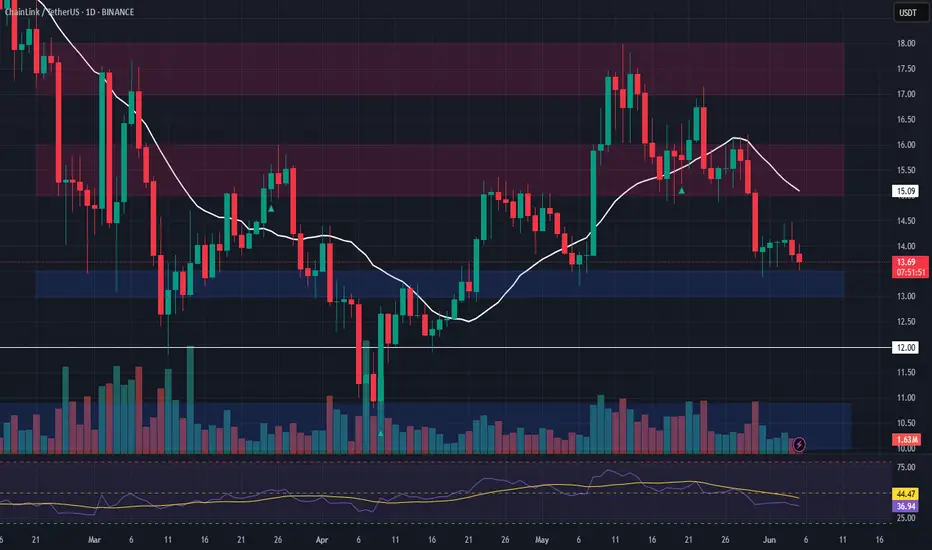
LINK Long Setup – Retrace to Key Support After Strong RallyLINK saw a strong rally from April to mid-May, and is now undergoing a healthy retracement. Price is approaching the $13.00–$13.50 support zone, offering a potential long spot entry as the market cools.
📌 Trade Setup:
• Entry Zone: $13.00 – $13.50
• Take Profit Targets:
o 🥇 $15.00 – $16.00
o 🥈 $17.00 – $18.00
• Stop Loss: Daily close below $12.00
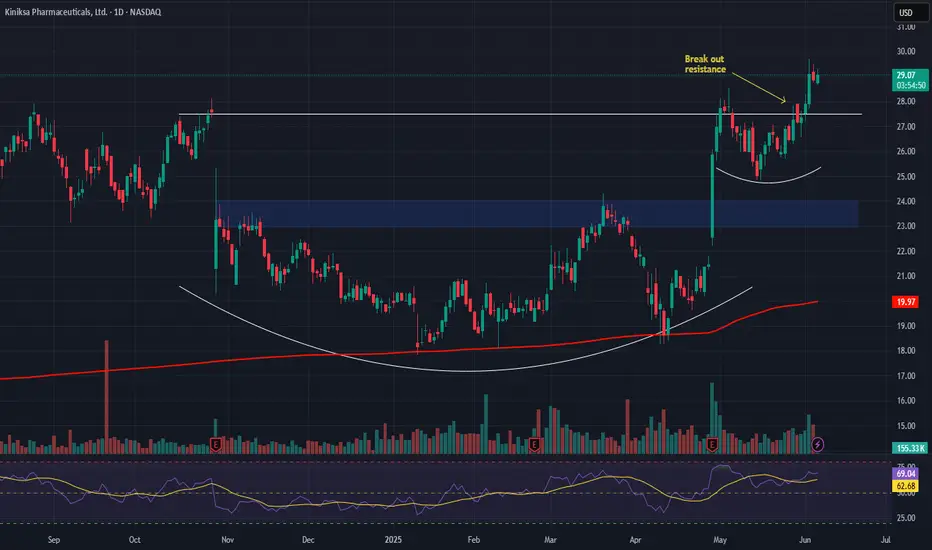
Kiniksa (KNSA) – Rare Disease Revenue & Pipeline Momentum Company Overview:
Kiniksa NASDAQ:KNSA is establishing itself as a high-growth biopharma player, with a sharp focus on autoimmune and inflammatory diseases. The company’s strategy is paying off through commercial execution and a robust, de-risked pipeline.
Key Catalysts:
🏆 Arcalyst Commercial Success
Core driver in recurrent pericarditis treatment
Delivering double-digit YoY revenue growth
Expanding potential in broader inflammatory indications
🧬 Deep Clinical Pipeline
KPL-404 (anti-CD40): Targets autoimmune diseases like lupus and rheumatoid arthritis
Mavrilimumab: Late-stage potential in rare inflammatory conditions
Orphan Drug & Breakthrough Therapy designations → accelerated approvals + exclusivity
📊 Strong Earnings Momentum
Recent beat on both revenue and EPS
Reinforces credibility in commercial & clinical execution
May attract institutional investors and technical breakout traders
Investment Outlook:
✅ Bullish Above: $23.00–$24.00
🎯 Target Price: $38.00–$40.00
📈 Thesis Drivers: Proven revenue engine (Arcalyst), high-potential pipeline, regulatory tailwinds, and institutional attention
🔬 Kiniksa is not just a clinical-stage story—it's a commercial growth engine with rare disease upside. #KNSA #BiotechStocks #RareDisease
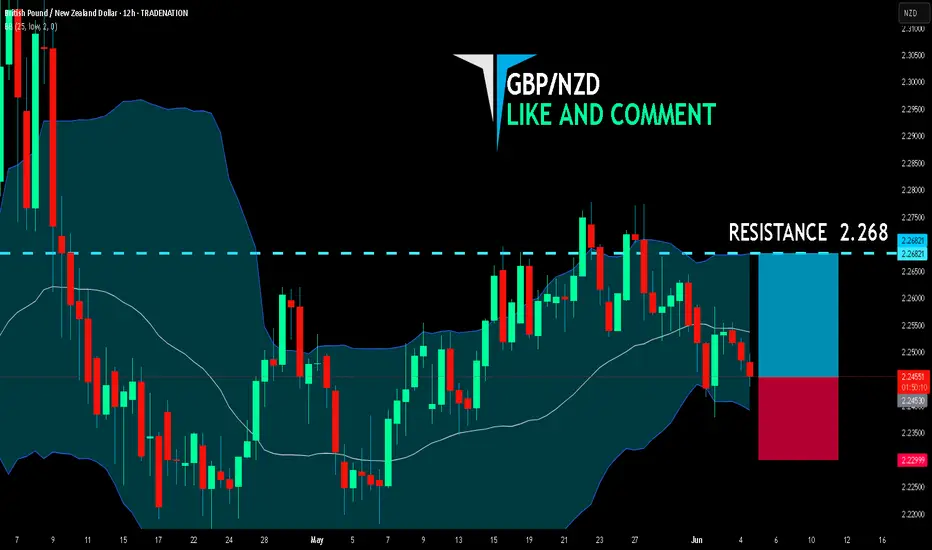
GBP/NZD LONG FROM SUPPORT
GBP/NZD SIGNAL
Trade Direction: long
Entry Level: 2.245
Target Level: 2.268
Stop Loss: 2.229
RISK PROFILE
Risk level: medium
Suggested risk: 1%
Timeframe: 12h
Disclosure: I am part of Trade Nation's Influencer program and receive a monthly fee for using their TradingView charts in my analysis.
✅LIKE AND COMMENT MY IDEAS✅