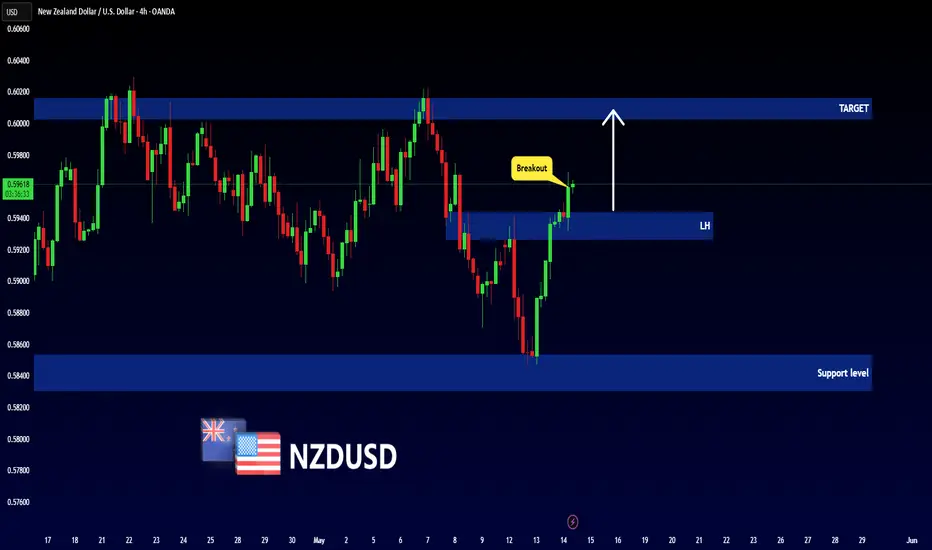
NZDUSD - NEW BREAKOUT !Hello Traders !
On Monday 12 May, The NZDUSD reached the support level (0.5853 - 0.5830).
The price broke the lower high (change of character).
So, I expect a bullish move🚀
_______________
TARGET: 0.60030🎯
Bullish Patterns
DOGE (Dogecoin)–Pullback Opportunity Amid Market-Wide ResistanceWith the total crypto market cap stalling at a major resistance zone, many altcoins — including DOGE — are due for a healthy retracement after recent strong moves. This sets up a potential buy-the-dip opportunity as DOGE returns to key support near $0.20.
🔹 Entry Zone:
$0.20 (next major support zone after recent rally)
🎯 Take Profit Targets:
🥇 $0.23 – $0.24
🥈 $0.30 – $0.31
🛑 Stop Loss:
Just below $0.18 (invalidates the support-based long idea)

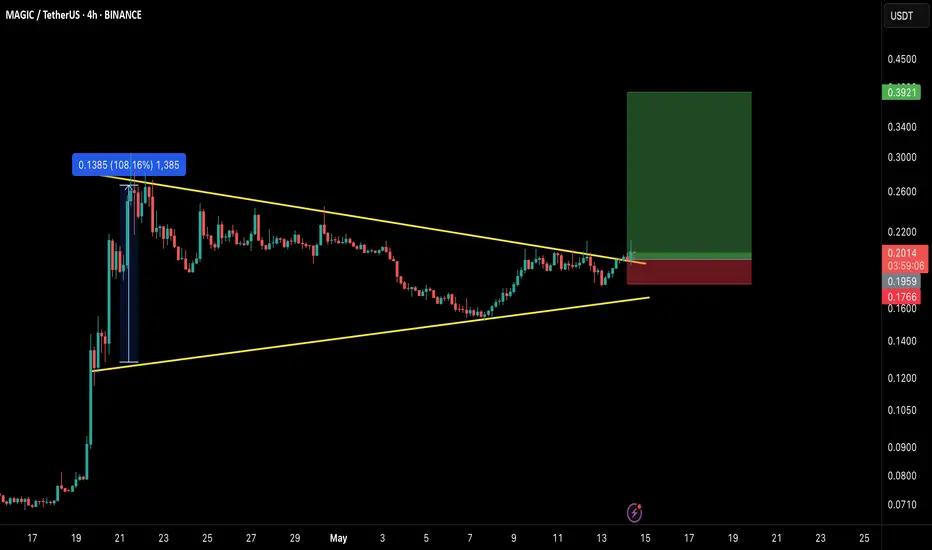
MAGIC Breaking Out – Next 100% Move on the Horizon?🚀 MAGIC Breakout Alert – 100% Potential Incoming?! 👀🔥
Hey Traders! If you're all about high-conviction plays and real alpha, smash that 👍 and tap Follow for more setups that actually deliver! 💹💯
MAGIC has finally broken out from a long-standing symmetrical triangle on the 4H chart — a classic bullish reversal pattern. After consolidating tightly, it's now flashing signs of a strong upward impulse! ⚡
📌 Entry: CMP ($0.200) and add more on dips up to $0.195
🎯 Targets: $0.25 / $0.29 / $0.33 / $0.39
🛑 Stoploss: Close below $0.176
⚙️ Leverage: 5x (Max)
✨ Previous breakout delivered over 100% gains — this one could be next!
Chart structure + volume looks perfect. If BTC stays calm, we might witness another explosive move in MAGIC.
💬 What are your thoughts on this setup? Drop your opinions below and don't forget to like & follow for more high-conviction trade setups! 💥
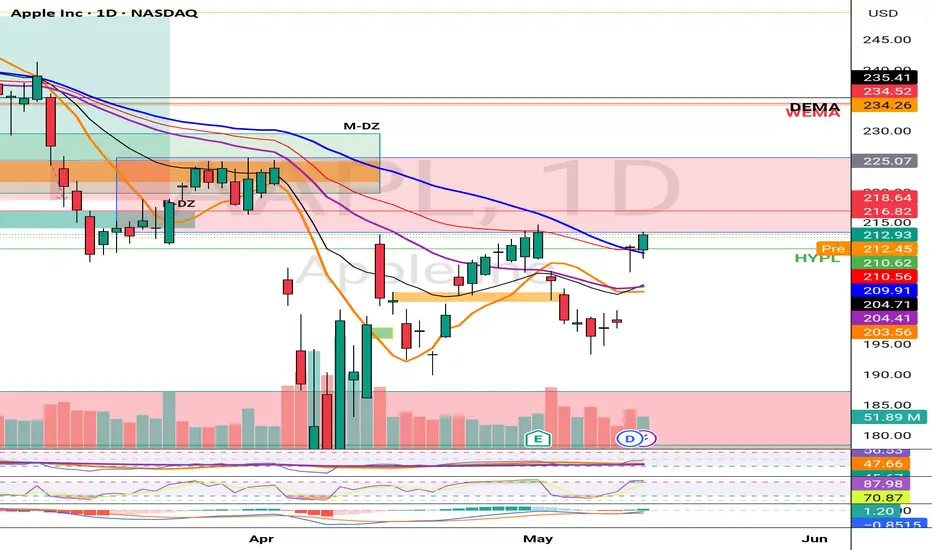
AAPL LOOKING BULLISH 14TH MAY 2025Aapl is looking good to go long at current price as every demand is being respected and price is looking to go deeper into tbe supply zone.
So I will be going long with STOCKS ONLY.
If you any doubts do let me know in the comments below
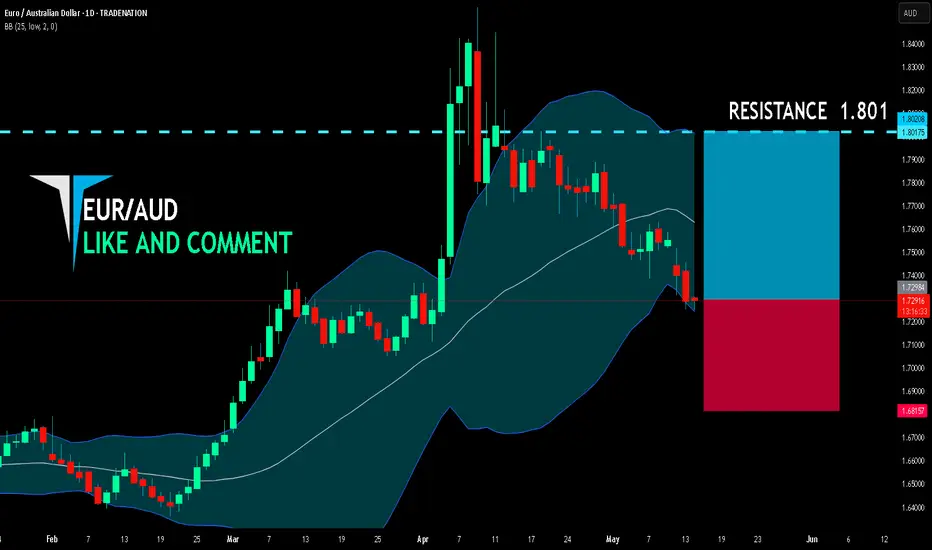
EUR/AUD BUYERS WILL DOMINATE THE MARKET|LONG
EUR/AUD SIGNAL
Trade Direction: long
Entry Level: 1.729
Target Level: 1.801
Stop Loss: 1.681
RISK PROFILE
Risk level: medium
Suggested risk: 1%
Timeframe: 1D
Disclosure: I am part of Trade Nation's Influencer program and receive a monthly fee for using their TradingView charts in my analysis.
✅LIKE AND COMMENT MY IDEAS✅
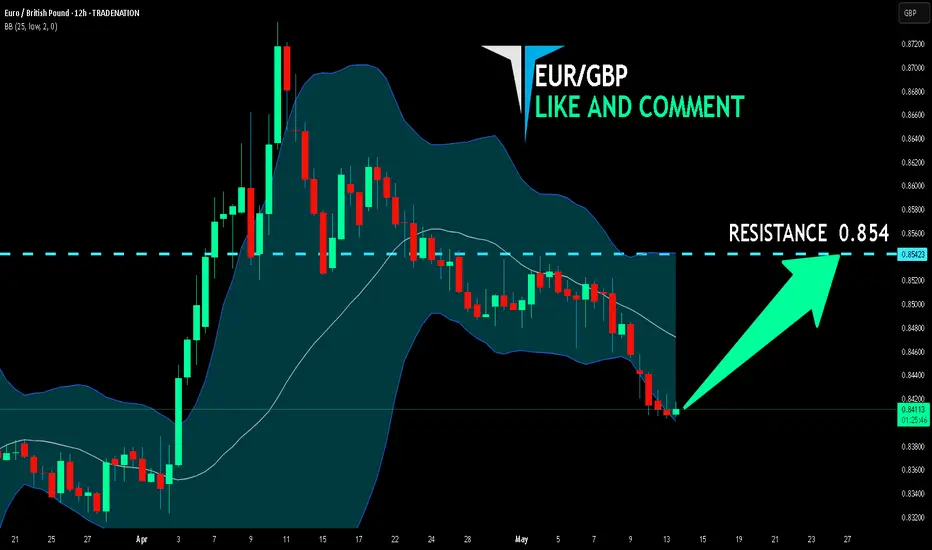
EUR/GBP BEST PLACE TO BUY FROM|LONG
Hello, Friends!
We are now examining the EUR/GBP pair and we can see that the pair is going down locally while also being in a downtrend on the 1W TF. But there is also a powerful signal from the BB lower band being nearby indicating that the pair is oversold so we can go long from the support line below and a target at 0.854 level.
Disclosure: I am part of Trade Nation's Influencer program and receive a monthly fee for using their TradingView charts in my analysis.
✅LIKE AND COMMENT MY IDEAS✅
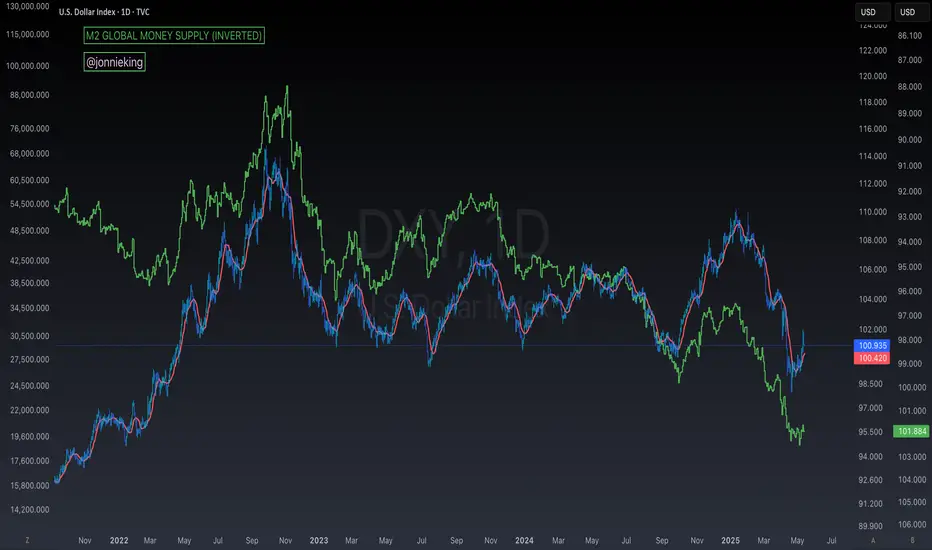
$DXY Up, M2 Money Supply DownWhen the DXY goes UP,
M2 Money Supply goes DOWN.
Remember the 12-Week Lead correlation with CRYPTOCAP:BTC
We need SWEEPS on Gold for a Bigger movePatiently waiting for gold to give us impulsive activity to indicate for a much bigger move. Need it to break outside of the current value first before I'm interested in a solid direction.

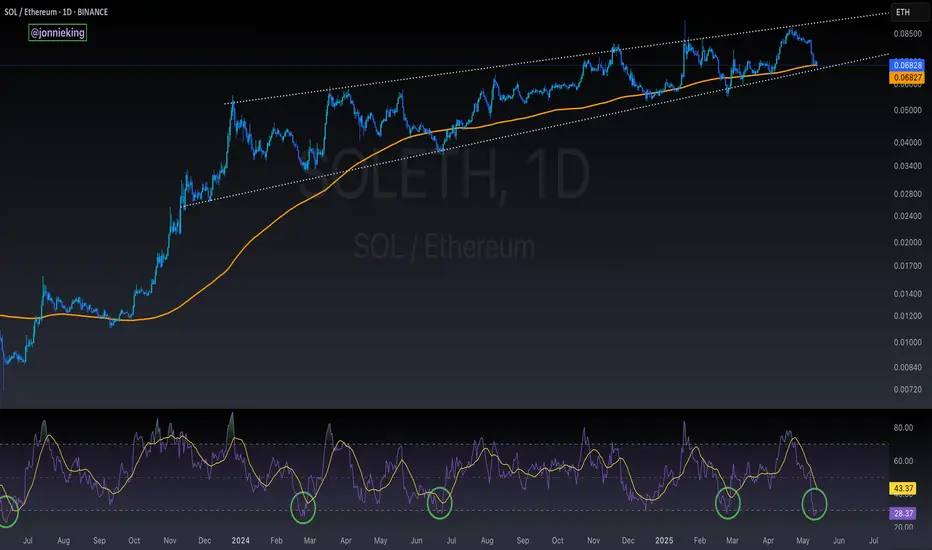
$SOL About to Outperform $ETHToday looks like a good day to flip your CRYPTOCAP:ETH for CRYPTOCAP:SOL 😎
Flirting with the 200DMA,
RSI has bottomed,
feels good man 🐸
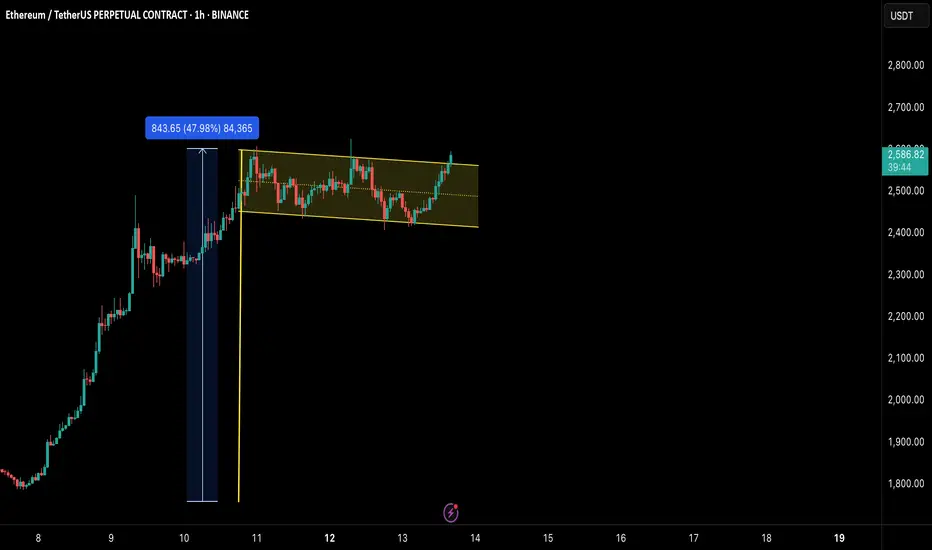
ETH/USDT: BULL FLAG BREAKOUT!!🚀 Hey Traders! 👋
If you’re finding value in this analysis, smash that 👍 and hit Follow for high-accuracy trade setups that actually deliver! 💹🔥
🔥 #ETHUSDT UPDATE – Ready for the Next Leg?
ETH surged nearly 48% recently and is now consolidating inside a clean parallel channel. After a healthy sideways move, price is starting to push the upper resistance again — a breakout from here could trigger the next rally phase! 🚀
🔸 Pattern: Bullish Flag/Parallel Channel
🔸 Current Structure: Post-pump consolidation
🔸 Watch for: Break above the upper yellow line for confirmation
🔸 Targets: $2,750 – $2,880+
🔸 Invalidation: Break below channel support and $2,430
📈 If bulls hold this zone, we could witness another explosive move! Keep it on your radar.
💬 What do you think? Is ETH gearing up for a breakout? Drop your thoughts below!
📌 Follow for more high-probability setups!
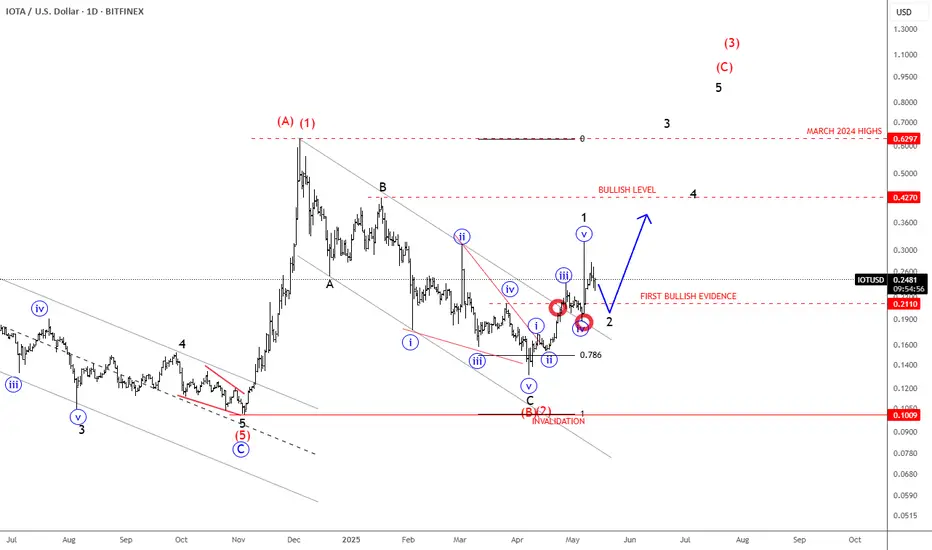
IOTA Could Be On The Way Back To December 2024 HighsIOTA with ticker IOTUSD made sharp and impulsive rally at the end of 2024, which we see it as a first leg (A)(1) of a bigger recovery in minimum three waves (A)(1)-(B)(2)-(C)(3). Since the beginning of 2025, Crypto market slowed down and IOTA made a deep retracement, but in three legs ABC with an ending diagonal/wedge pattern into wave C, which indicates for a correction in wave (B)(2).
Well, it nicely bounced recently, making a clean five-wave impulse away from projected 78,6% Fibonacci support and back above channel resistance line, so it can be wave 1 of a new five-wave bullish cycle within higher degree wave (C) or (3). That said, after current pullback in wave 2, be aware of more gains for wave 3 of a five-wave bullish cycle that can send the price back to December 2024 highs this year.
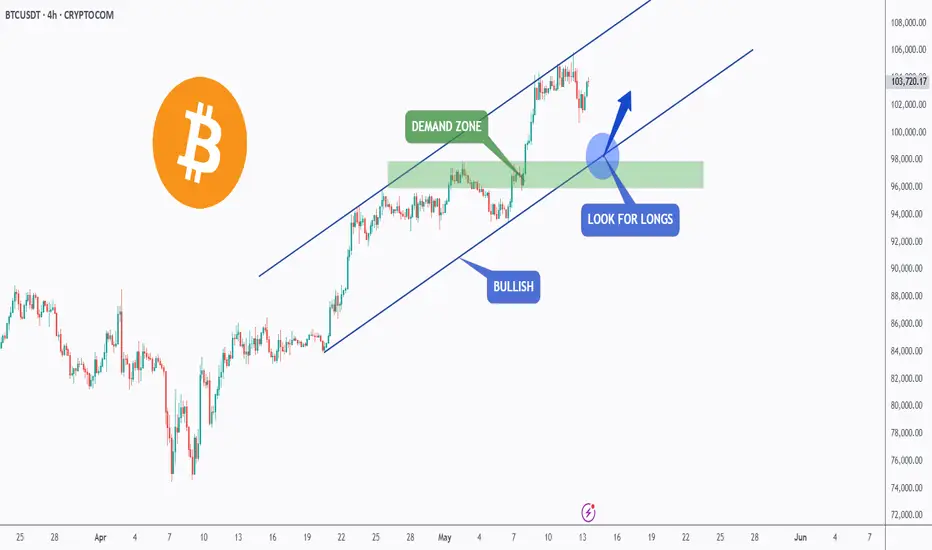
BTC - New Short-Term Long!Hello TradingView Family / Fellow Traders. This is Richard, also known as theSignalyst.
📈BTC has been overall bullish trading within the rising channel marked in blue.
Moreover, the green zone is a strong demand and structure.
🏹 Thus, the highlighted blue circle is a strong area to look for buy setups as it is the intersection of structure and lower blue trendline acting non-horizontal support.
📚 As per my trading style:
As #BTC retests the blue circle zone, I will be looking for bullish reversal setups (like a double bottom pattern, trendline break , and so on...)
📚 Always follow your trading plan regarding entry, risk management, and trade management.
Good luck!
All Strategies Are Good; If Managed Properly!
~Rich
Ripple is Nearing an Important Support!!! Hey Traders, in today's trading session we are monitoring XRPUSDT for a buying opportunity around 2.17 zone, Ripple is trading in an uptrend and currently is in a correction phase in which it is approaching the trend at 2.17 support and resistance area.
Trade safe, Joe.

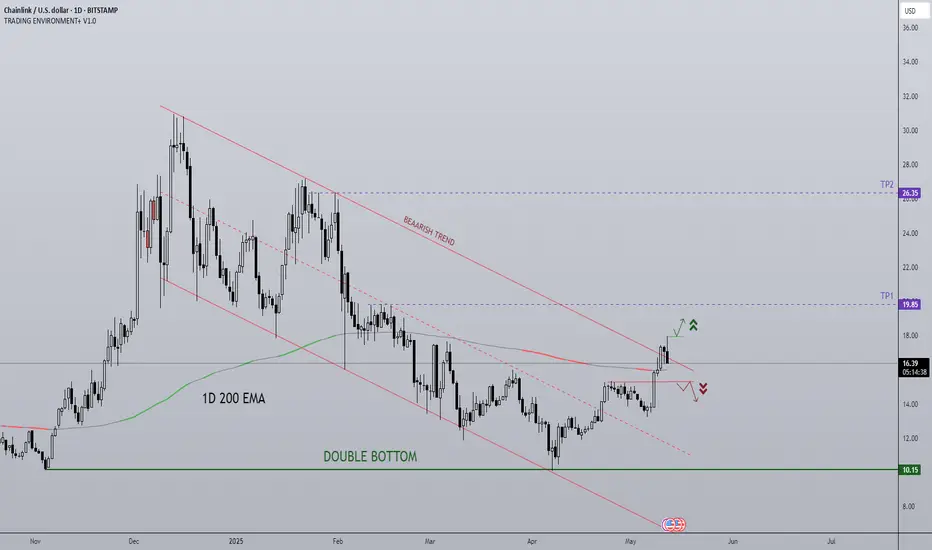
LINK Daily breakout?One of the most important crypto projects is undoubtedly Chainlink. Having been in a downtrend like must altcoins ever since President Trumps inauguration , LINK looks to finally be ready to exit the bearish trend channel for the first time this calendar year using the newly flipped 1D 200 EMA as a launchpad or is this a local top and the trend continues?
For the bulls a double bottom at $10.15 followed by a higher lows and now a higher high is a strong argument for a flip to bullish structure, however a breakout is needed to confirm this bullish flip in structure and with BTC + most majors at local resistance levels and looking in need of a cool off, this may be too much to ask of LINK at this time.
The bears would say this is business as usual and a rejection off the upper limit maintains the bearish trend, a loss of the 1D 200 EMA would definitely increase the likeliness this outcome.
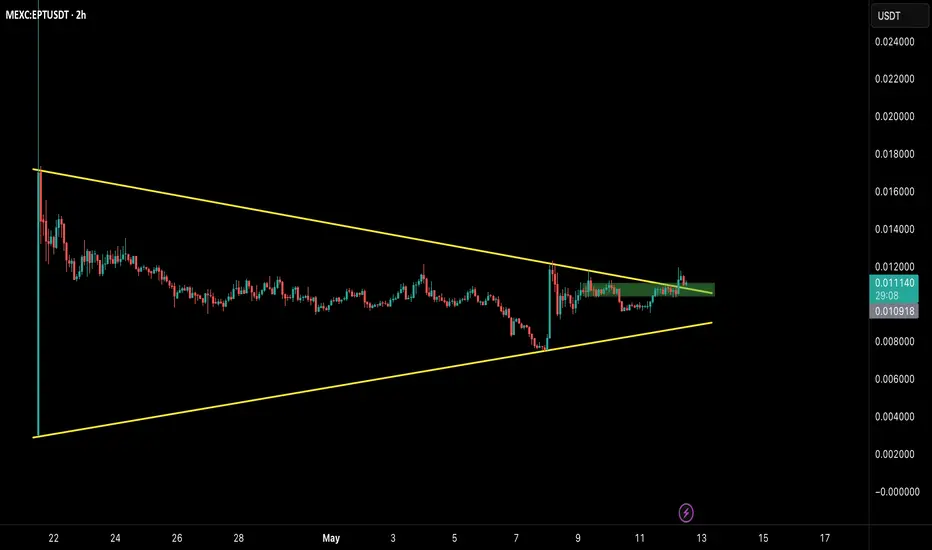
EPT/USDT Breakout Alert – Triangle Resolved, Targets Set!🚀 EPT Breakout Alert – 100% Potential Incoming?! 👀🔥
Hey Traders! If you're all about high-conviction plays and real alpha, smash that 👍 and tap Follow for more setups that actually deliver! 💹💯
EPT has just broken out from a symmetrical triangle on the 2H chart, indicating the start of a potential bullish wave. After weeks of consolidation, this breakout looks strong and is supported by increasing momentum.
📌 Entry: Current Market Price (CMP) – $0.0110
📉 Add More on Dip: Down to $0.0104
🎯 Targets:
TP1: $0.0138
TP2: $0.0165
TP3: $0.0194
TP4: $0.0223
🛑 Stop Loss: $0.0092
⚙️ Leverage (Optional): 3x–5x
A clean structure, breakout confirmation, and tight invalidation level make this setup attractive for short-to-mid-term swing traders.
💬 What do you think about this move? Are you in? Drop your thoughts below!
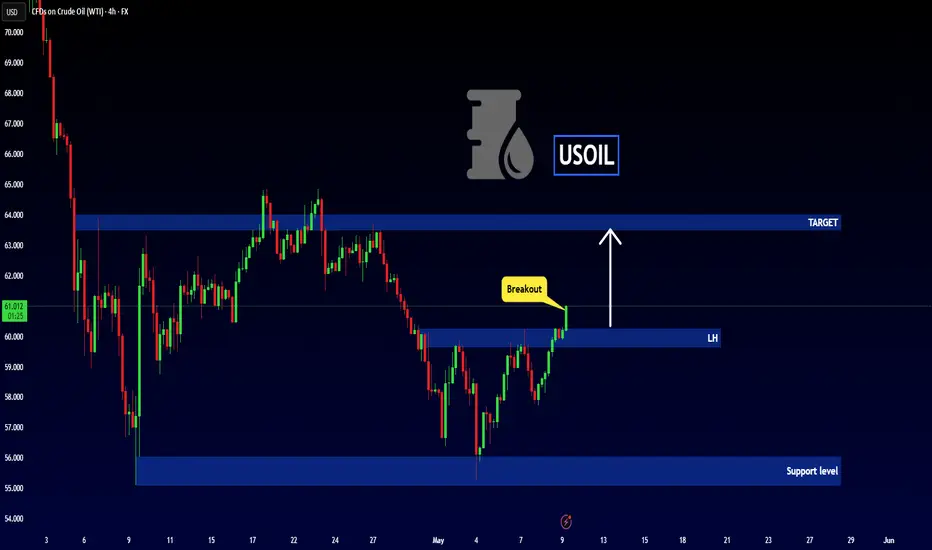
USOIL - Important Breakout !Hello Traders !
The USOIL failed to break the support level (56.047 - 55.102).
Currently, The lower high is broken (Change of Character).
So, I expect a bullish move🚀
________________
TARGET: 63.500🎯
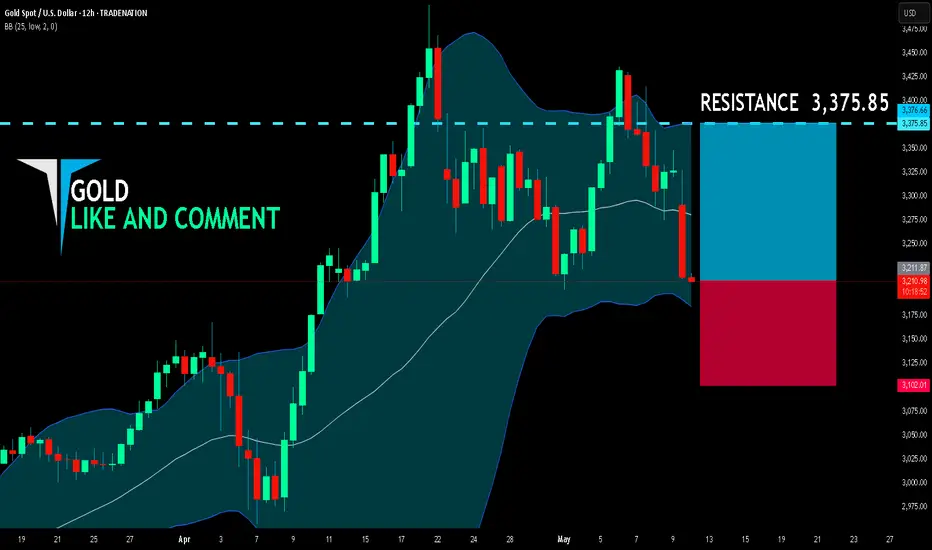
GOLD BULLS ARE GAINING STRENGTH|LONG
GOLD SIGNAL
Trade Direction: long
Entry Level: 3,211.87
Target Level: 3,375.85
Stop Loss: 3,102.01
RISK PROFILE
Risk level: medium
Suggested risk: 1%
Timeframe: 12h
Disclosure: I am part of Trade Nation's Influencer program and receive a monthly fee for using their TradingView charts in my analysis.
✅LIKE AND COMMENT MY IDEAS✅
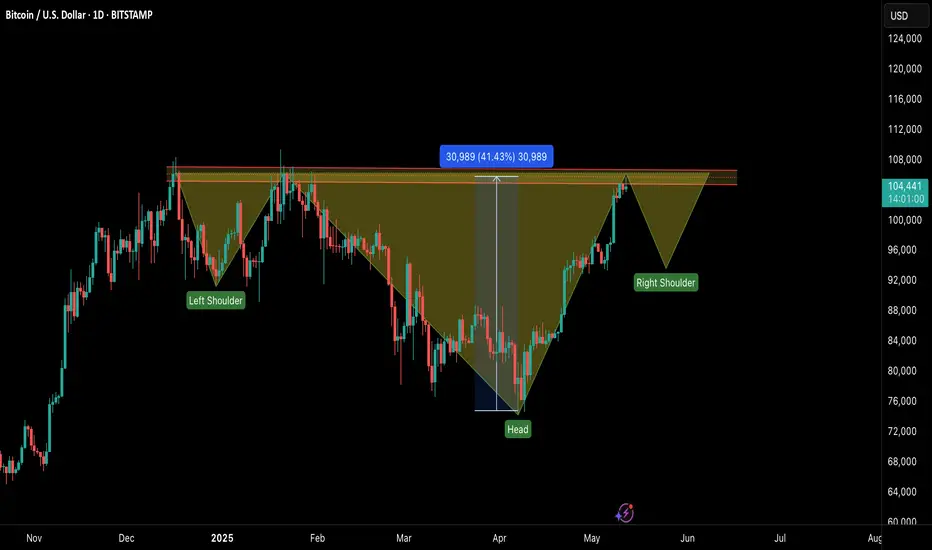
Bitcoin Chart Pattern Signals Possible Dip Before Pump!🚀 Hey Traders! 👋
If you’re finding value in this analysis, smash that 👍 and hit Follow for high-accuracy trade setups that actually deliver! 💹🔥
📉 #BTC – Potential Inverse Head & Shoulders in Play
Bitcoin is showing signs of a classic inverse head and shoulders formation on the daily chart. However, it's facing heavy resistance near the neckline around the $106,000 zone.
🧠 Possible Scenario:
A correction toward the GETTEX:92K –$93K range could complete the right shoulder before a potential breakout. If we see a clean bounce from that level, bulls might reclaim momentum.
⚠️ Invalidation:
A daily close above $106,000 would invalidate the structure and signal early continuation.
💬 What do you think of this setup? Drop your views and analysis in the comments below!
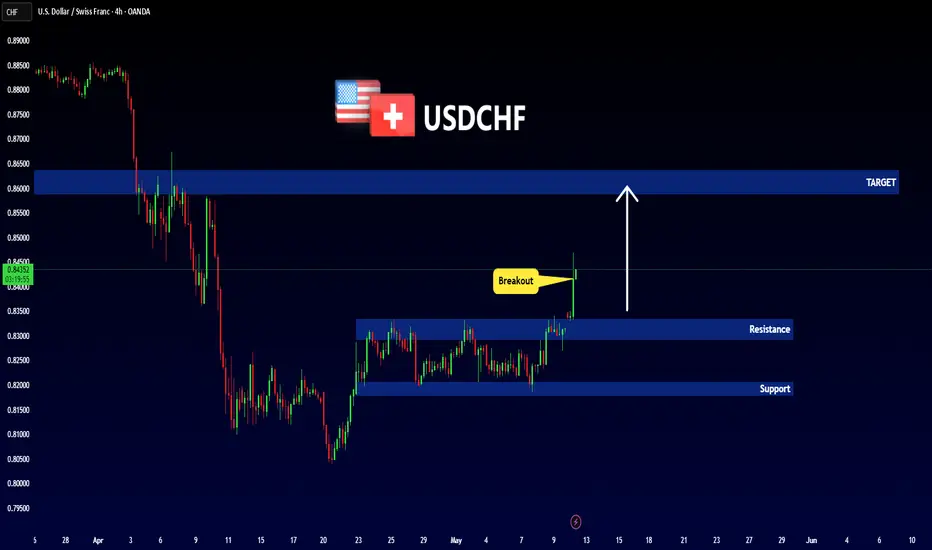
USDCHF - Important Breakout !Hello Traders !
The USDCHF formed a rectangle pattern.
The price broke the resistance level (0.83350 - 0.82931).
This key level becomes new support !
So, I expect a bullish move🚀
________________
TARGET: 0.85890🎯
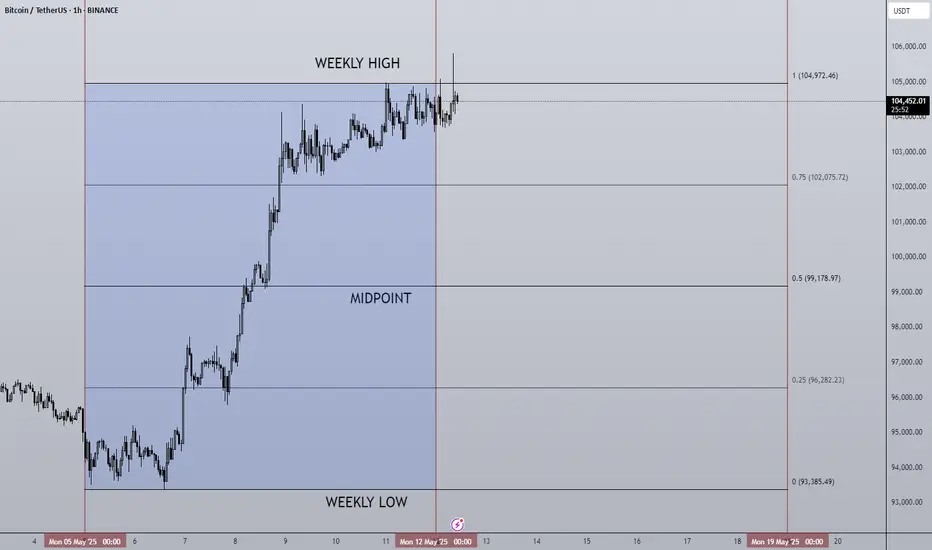
12/05/25 Weekly OutlookLast weeks high: $104,972.46
Last weeks low: $93,385.49
Midpoint: $99,178.97
Bitcoin climbs over 12% from weekly low to weekly high, an incredible achievement despite a mixed performance in Tradfi. A pattern we've seen since the $74,500 double bottom following Liberation day goes; A strong rally for a week, consolidation in a tight trading range for a week, then repeat. Should this pattern continue we should see consolidation between weekly high and $102,075 (0.75 line).
CPI & PPI take place this week on Tuesday and Thursday respectively, inflation is still a big talking point but baring a crazy print I would be surprised if these events move BTC. In the last few hours at time of writing The US has reduced tariffs on China to 30% for 90 days, China has reduced tariffs on the US down to 10%. To me this signifies the worst of the trade war narrative is behind us.
This week I will be tracking altcoins with strong fundamentals as BTC.D rolls over from its highest point since January '21, ETH has already had a strong breakout from the downtrend and with BTC at ATH levels with strong resistance this should be the time to see altcoin strength and play catch-up.
Good luck this week!
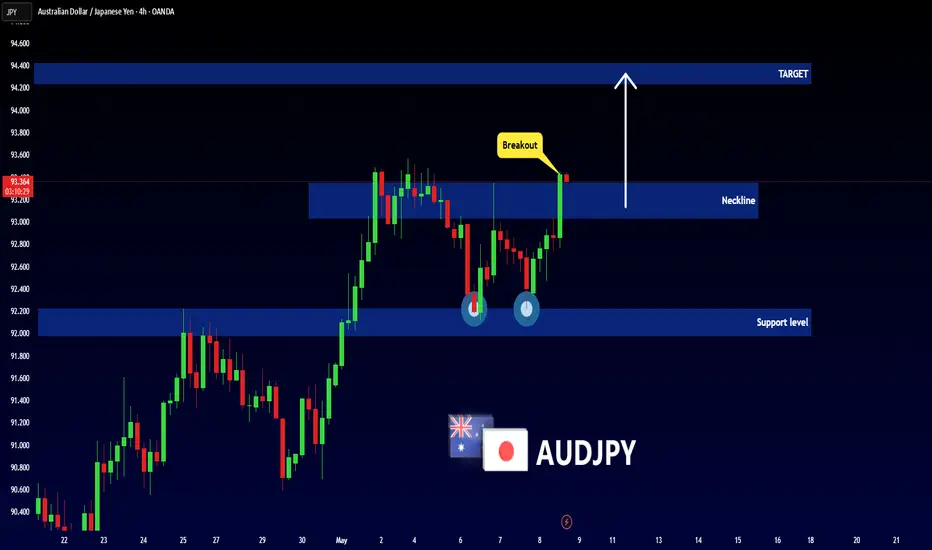
AUDJPY - Bullish Double BottomHello Traders !
On Tuesday 6 May, The AUDJPY reached the support level (92.222 - 91.978).
The price formed a double bottom pattern.
At the moment, The Neckline is broken !
So, I expect a bullish move🚀
_______________
TARGET: 94.240🎯
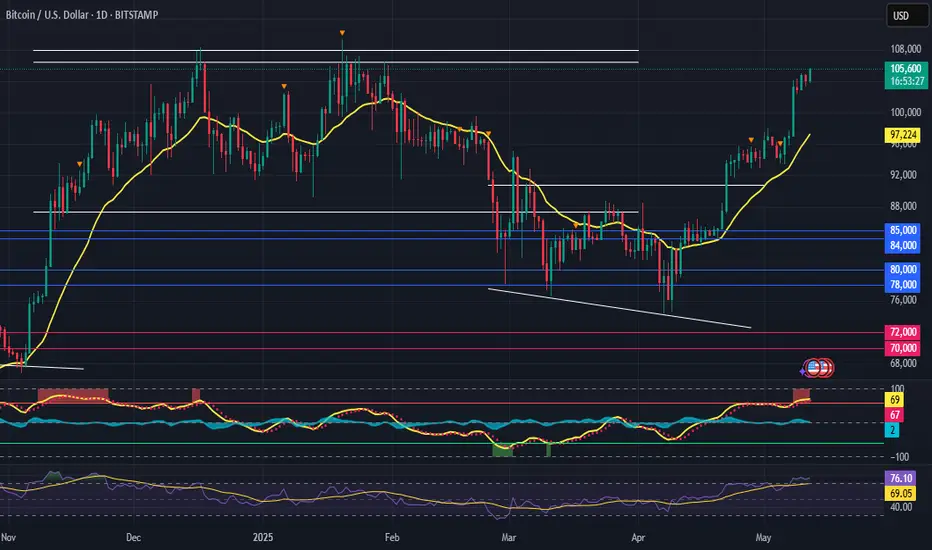
Bitcoin Flips $94K Into Support — Bullish Momentum BuildsStructure Strengthens:
Bitcoin's technical structure has improved significantly, with price now holding firmly above the $94,000 level — a former resistance that has flipped into solid support after multiple successful retests.
Bullish Trend Confirmation:
This move reinforces the ongoing bullish trend, driven by a broad bottoming formation from February to April and a clear series of higher lows since March.
Investor Confidence:
The consistent accumulation signals strong buying interest from long-term investors, suggesting that market participants are positioning for further upside.
Outlook & Targets:
As long as Bitcoin maintains levels above $94,000, the bullish outlook remains intact. The next near-term targets lie in the $110,000–$115,000 range.
Bitcoin appears well-positioned for the next leg of its rally. 🚀📈
#Bitcoin #BTC #Crypto #TechnicalAnalysis #BullishTrend #Support #Breakout #MarketUpdate #PriceAction #CryptoMarket
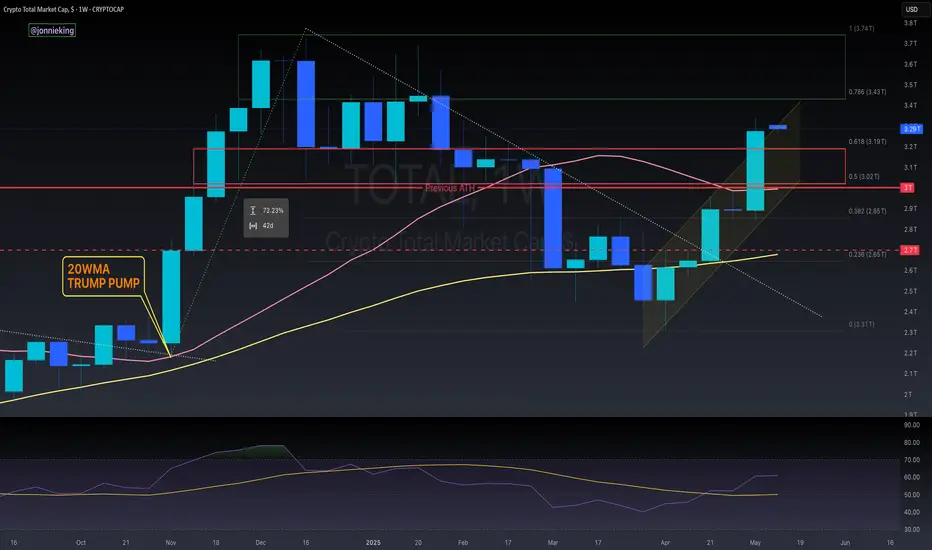
$TOTAL Crypto Market Cap Massive Weekly Close Above 20WMA Massive Weekly Close for the CRYPTOCAP:TOTAL Crypto Market Cap above the .618 Fib and previous cycle's ATH.
RSI still has room to push higher to retest this cycle's ATH.
Price also closed above the 20WMA, which was the signal for the +70% Nov '24 Trump Pump 🚀
UpOnly Season for every coin only happens when the TOTAL Market Cap goes HIGHER.
Otherwise we are stuck in a rotational cycle, where money from one narrative pumps then moves onto the next
ie RWA, DePin, AI, Memes etc