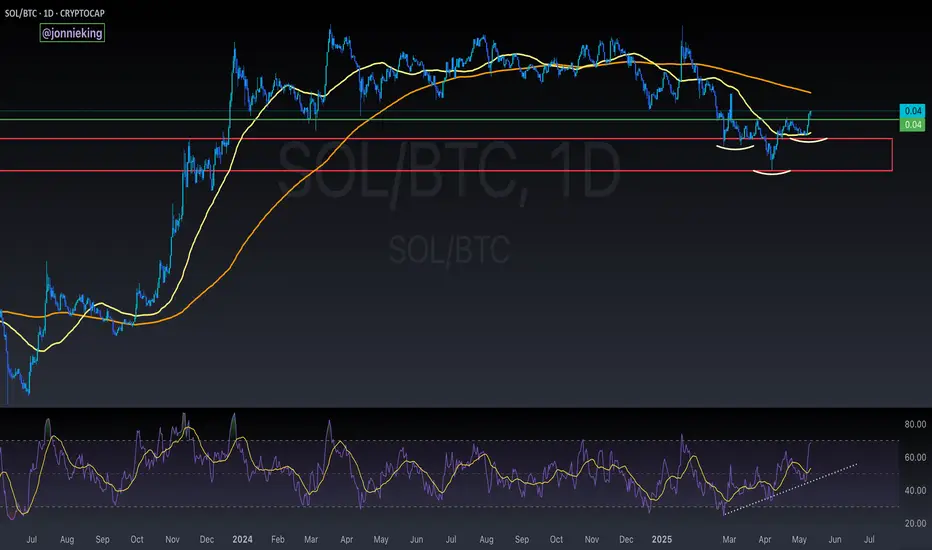
$SOL / $BTC Inverse Head and Shoulders BREAKOUT!!CRYPTOCAP:SOL / CRYPTOCAP:BTC Inverse Head and Shoulders reversal pattern confirmed 🥳
PA has also reclaimed the 50DMA
Bullish Divergence on RSI
So many signs indicators aligning across the market.
IS IT REALLY TIME !!?!?
Bullish Patterns
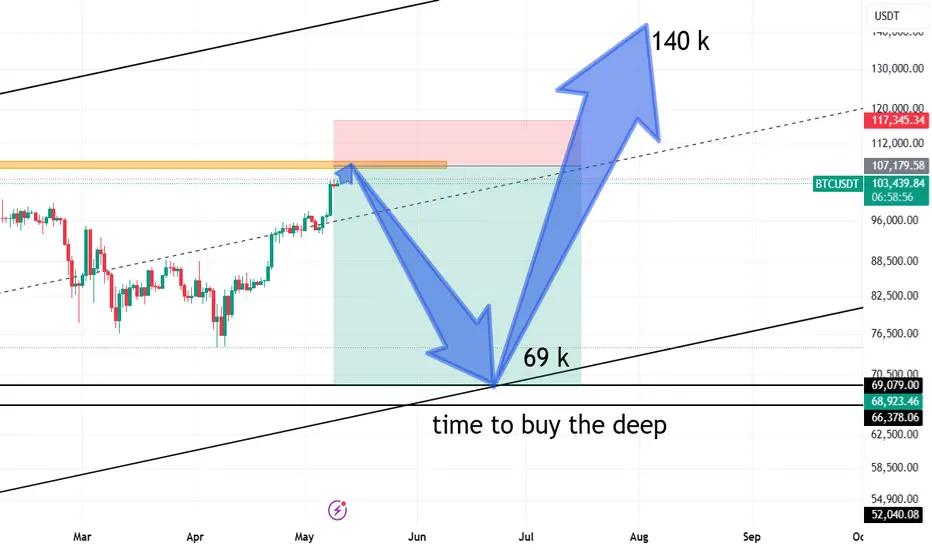
my idea about btc in secound half of 2025Dear followers,
I’ve analyzed BTC’s recent price movements and on-chain indicators, and I’d like to share my outlook for the second half of 2025. Based on my technical and macroeconomic assessment, I anticipate a significant correction before a strong rebound later in the year.
Key Highlights:
Sell Zone: I expect BTC to reach around $108,000 during a bullish run, where I recommend taking profits and initiating a short position.
Correction Phase: Following the peak, I foresee a correction bringing BTC down to approximately $69,000. This presents a deep buy opportunity for those looking to accumulate at lower levels.
Target for Rebound: Post-correction, I project a strong rally towards $140,000, driven by renewed institutional interest and market fundamentals.
Trading Strategy:
Consider selling or reducing holdings near the $108K level.
Be prepared to accumulate during the dip around $69K.
Aim for the $140K target on the rebound, aligned with overall bullish momentum.
Please note that all trading involves risk, and it's essential to manage your positions carefully. Stay tuned for updates, and always do your own research before making trading decisions.
Let me know your thoughts or if you'd like a deeper analysis!
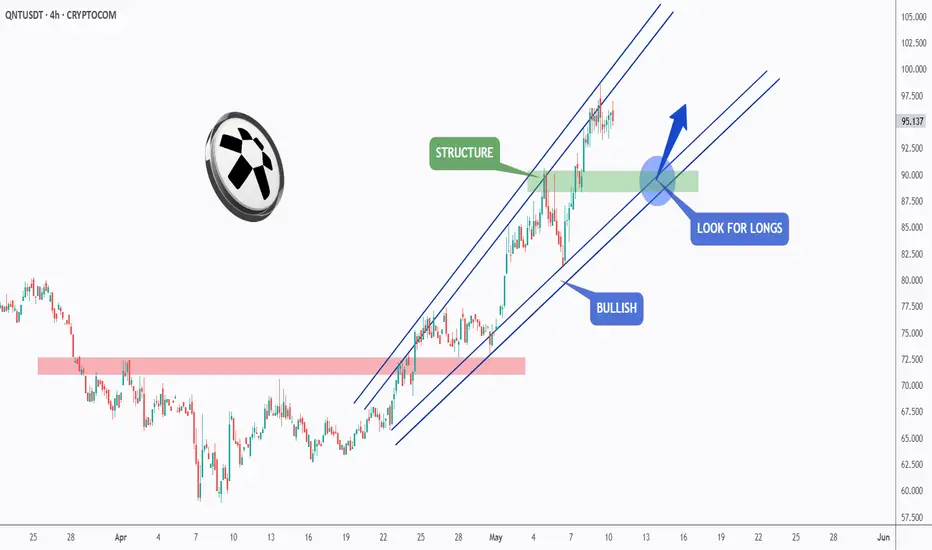
QNT - The Bulls are Leading!Hello TradingView Family / Fellow Traders. This is Richard, also known as theSignalyst.
📈After breaking above the last major high marked in red, QNT has been overall bullish trading within the rising wedge pattern marked in blue.
Moreover, the green zone is a strong demand and structure.
🏹 Thus, the highlighted blue circle is a strong area to look for buy setups as it is the intersection of structure and lower blue trendline acting non-horizontal support.
📚 As per my trading style:
As #QNT retests the blue circle zone, I will be looking for bullish reversal setups (like a double bottom pattern, trendline break , and so on...)
📚 Always follow your trading plan regarding entry, risk management, and trade management.
Good luck!
All Strategies Are Good; If Managed Properly!
~Rich
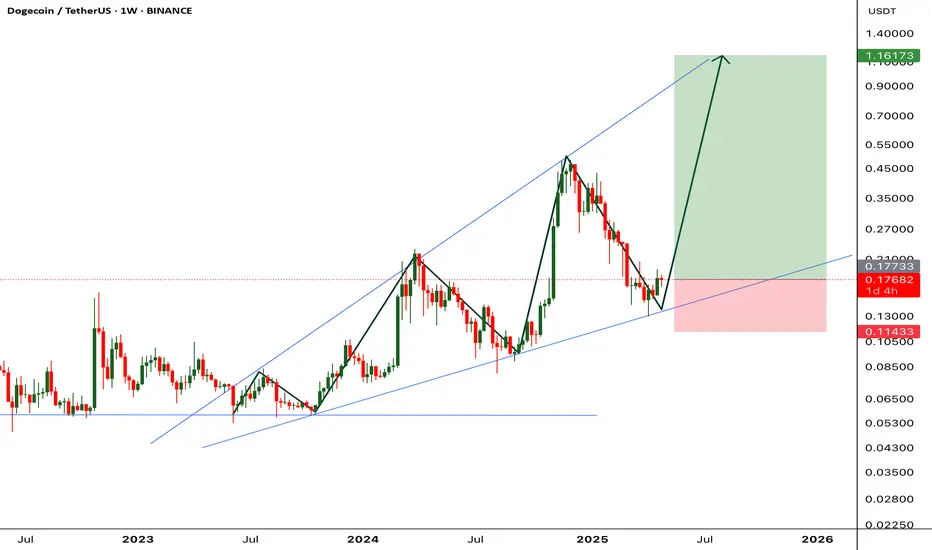
DOGE - 1$ NextDoge is getting ready for the next wave. Based on the previous trend we are looking at the next target around 1.1$.
Doge can break 1$ easily based on the current trend and overall interested in DOGE.
Entry: 0.1766
TP1: 0.22086
TP2: 0.30439
TP3: 0.40104
TP4: 0.53436
TP5: 1.13587
Stop Loss: 0.1143
Follow us for more such ideas.
Cheers
GreenCrypto
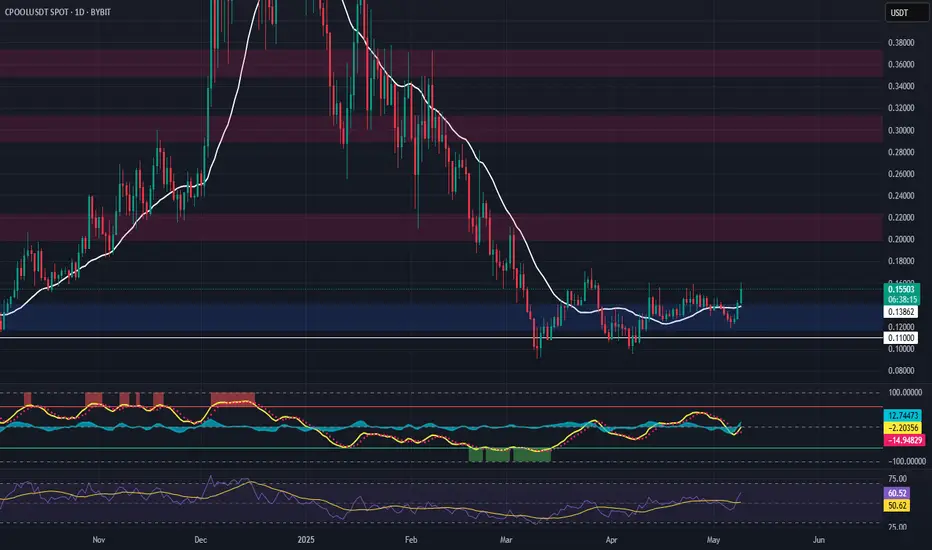
CPOOL (Clearpool) – Momentum Reversal Trade SetupCPOOL is flashing signs of a potential early trend reversal, supported by a strong bounce off a key support zone around $0.140. Price action suggests a reclaim of market structure, positioning this trade for a momentum shift with healthy upside targets.
🔹 Entry Zone:
Around $0.140 (support level)
🎯 Take Profit Targets:
🥇 $0.20 – $0.22
🥈 $0.29 – $0.31
🥉 $0.35 – $0.37
🛑 Stop Loss:
Daily close under $0.11
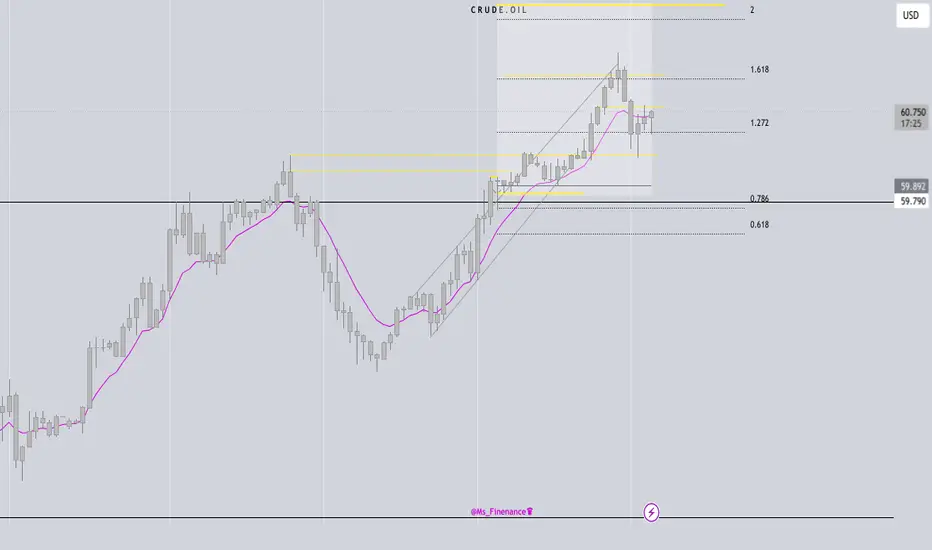
Thursday 5/8 Oil LONG ENTRY 12pm Thursday Oil Long,
retest of 78.6 Fib retracement level
Early close Friday before Market close
Oil could possibly hold bullish momentum
initial TP: 62,000
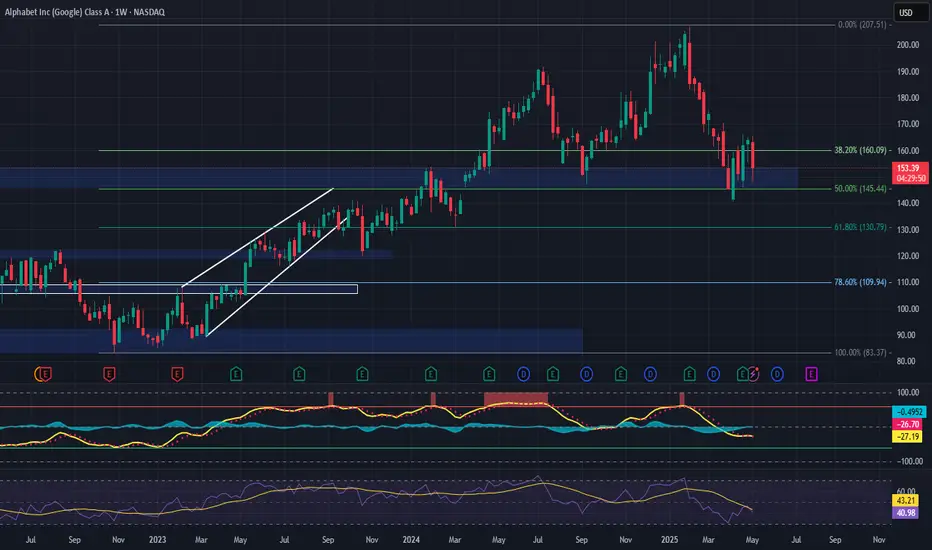
GOOGL (Alphabet Inc.) – Medium-Term Position Trade SetupNASDAQ:GOOGL is showing strength as it revisits its previous all-time high, now aligning with the 50% Fibonacci retracement of the current wave. The price action suggests a bullish flip of resistance into support at the $153 zone, with clear signs of buyer defense—offering a compelling medium-term opportunity.
🔹 Entry Zone:
Around $153 (support zone)
🎯 Take Profit Targets:
🥇 $200
🥈 $230
🛑 Stop Loss:
Weekly close below $130
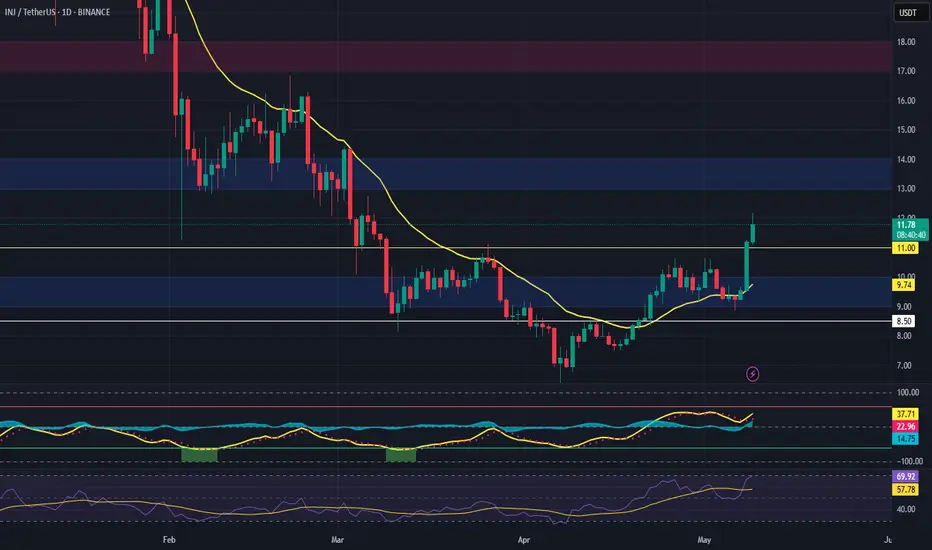
INJ - Long Trade Setup (Medium-Term Reversal Opportunity)INJ (Injective) has completed a deep liquidity sweep and is now reclaiming key technical levels, including the 21-day EMA and a critical horizontal support zone around $11. This sets the stage for a potential medium-term move higher if the structure confirms.
🔹 Entry Zone:
Around $11
🎯 Take Profit Targets:
🥇 $13 – $14
🥈 $17 – $18
🛑 Stop Loss:
Daily close below $8.50
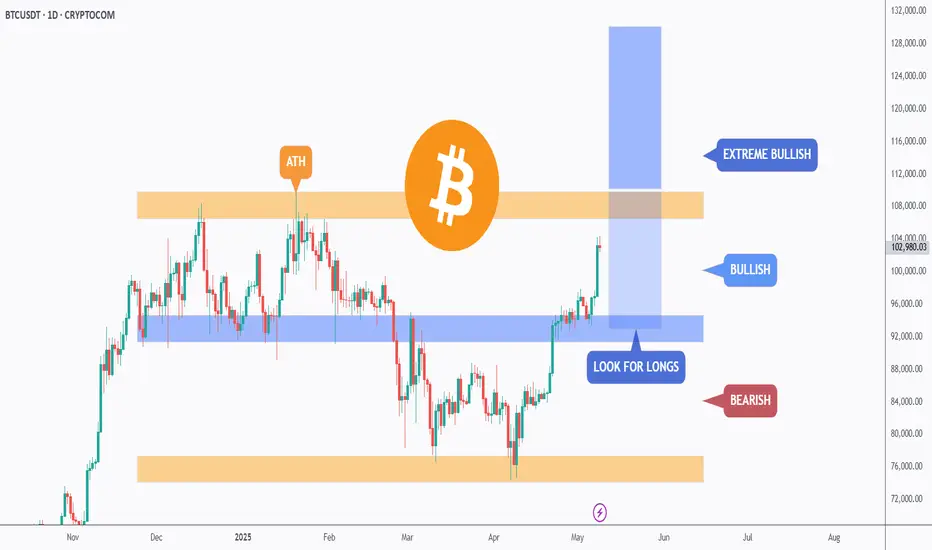
BTC - From Bullish to Extreme Bullish...Hello TradingView Family / Fellow Traders. This is Richard, also known as theSignalyst.
🏢 BTC Building Blocks:
📈 Bullish:
BTC is currently trading within the second floor, between $92,000 and the previous all-time high (ATH) at $109,000.
As BTC retests the $96,000 demand zone, we’ll be looking for trend-following long setups!
📈 Extreme Bullish:
For the momentum to shift from Bullish to Extreme Bullish and enter the price discovery phase, a break above the previous ATH around $109,000 is needed.
📚 Always follow your trading plan regarding entry, risk management, and trade management.
Good luck!
All Strategies Are Good; If Managed Properly!
~Rich
CRYPTO ALT COIN GEM HUNTING!I hope you guys enjoyed the video! Feel free to comment down below other Alt coins that you are buying!

SONIC | (Previously Fantom) | HUGE BULLISH PatternFTM has now officially been replaced on most exchange and is now trading as Sonic.
At first we saw an initial drop, typical "sell the news" actions, but now there is a bullish pattern forming in the 4h timeframe.
SONIC is bullish because:
✅ Upwards trendline trading
✅ Higher Lows
✅ Bullish chart pattern: W-Bottom
_______________
BYBIT:SONICUSDT

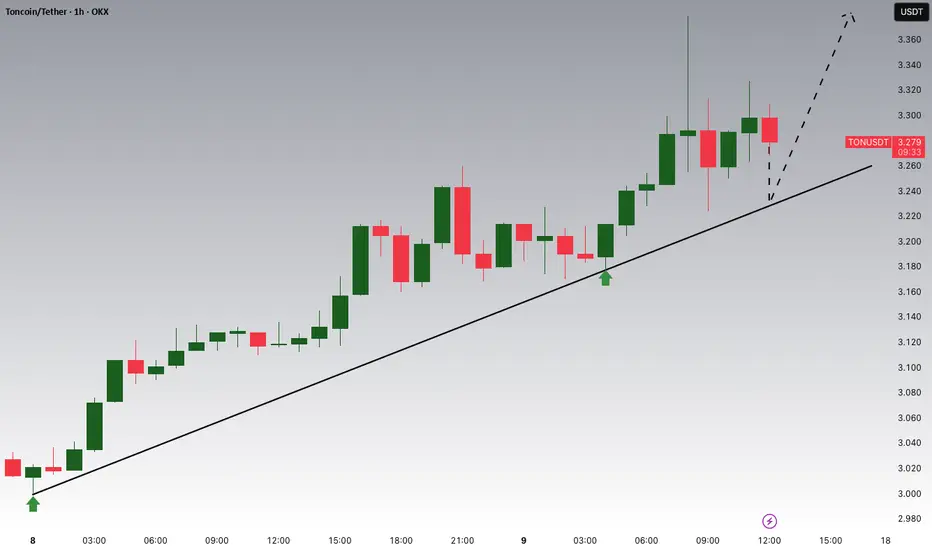
TONUSDT Built a Fresh Up Trend!!!Hey Traders, in today's trading session we are monitoring TONUSDT for a buying opportunity around 3.20 zone, TONUSDT is trading in an uptrend and currently is in a correction phase in which it is approaching the trend at 3.20 support and resistance area.
Trade safe, Joe.
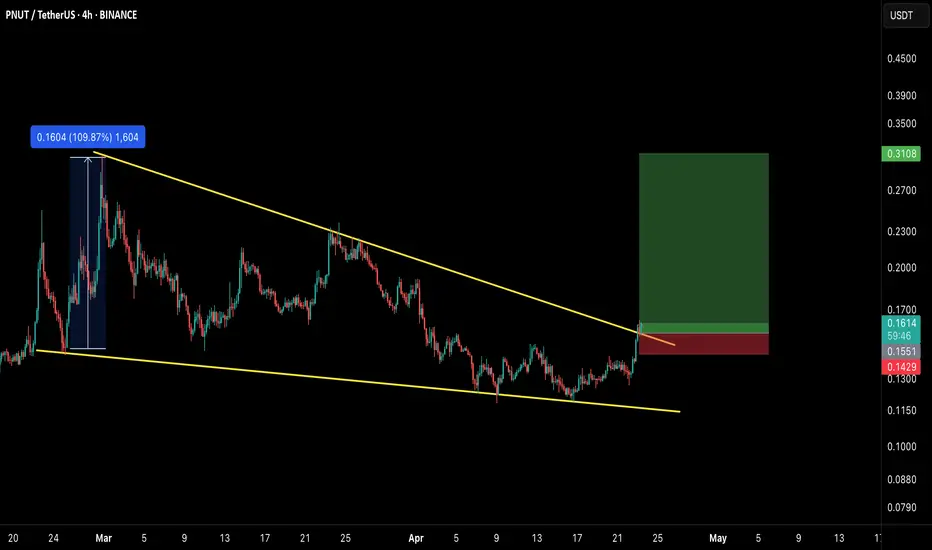
PNUT/USDT: FALLING WEDGE BREAKOUT ALERT!!🚀 PNUT Breakout Alert – 100%+ Potential Incoming?! 👀🔥
Hey Traders! If you're all about high-conviction plays and real alpha, smash that 👍 and tap Follow for more setups that actually deliver! 💹💯
PNUT has officially broken out of a falling wedge structure — a bullish reversal pattern we've been eyeing for weeks! After weeks of consolidation and pressure along the wedge resistance, the price has now made a clean breakout with increasing volume.
🔹 Last time it broke out from this zone, we witnessed a massive 109% move.
🔹 Currently, it’s showing a similar breakout structure with room for a big upside move.
🔵 Entry Zone: $0.158–$0.162
🎯 Targets:
• Target 1: $0.21
• Target 2: $0.27
• Target 3: $0.31+
🛑 Stop-loss: $0.142
📊 Leverage: 3x–5x (low to moderate risk)
⚠️ As always, manage your risk and don’t chase pumps. Setup looks strong as long as the breakout holds and we don’t see a fakeout candle back inside the wedge.
📍Let me know what you think — will PNUT fly again?
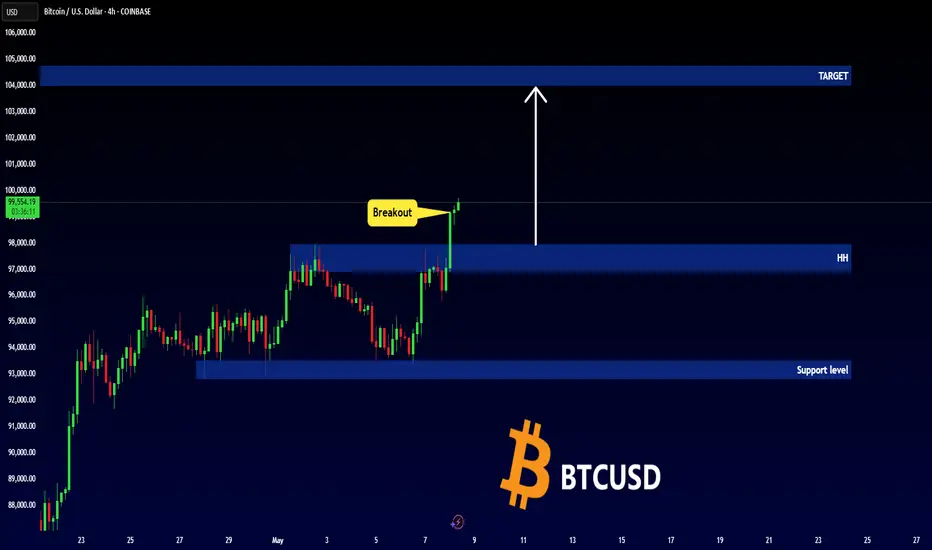
BITCOIN - Important Breakout (BoS)Hello Traders !
On Monday 5 May, The BTC reached the support level (92800 - 93500).
The price broke the higher high (Break of Structure).
So, I expect a new bullish move🚀
_______________
TARGET: 104000🎯
Retrace Complete...but we need 1 more Sweep on Gold!This pullback is what I waited for and it took all week for it to happen. Not sure if I will get the bullish move today being that it is Friday. But if they hit the level I'm looking for I will try at least once. Keeping expectations low since its the end of the week. but things are shaping out for us to have a STRONG bullish week next week.

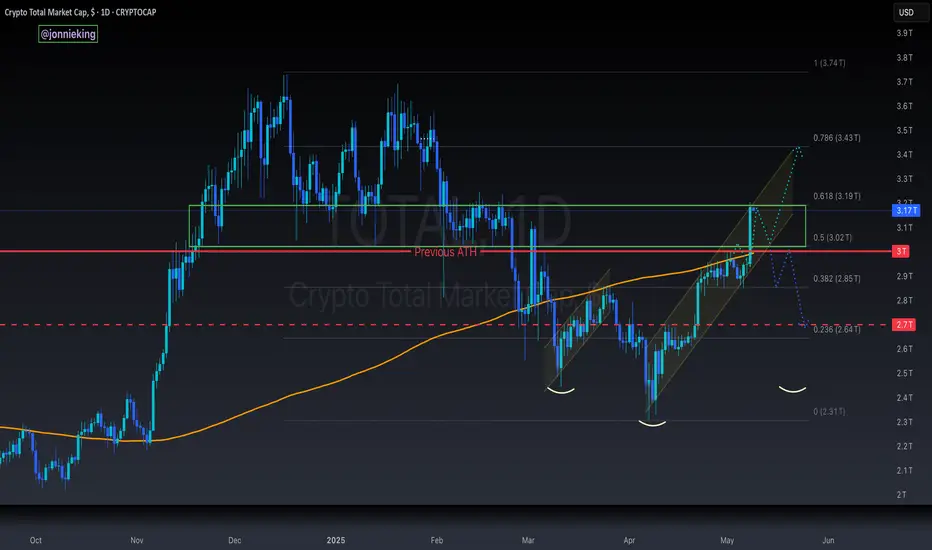
$TOTAL Crypto Market Cap - Banana Zone or Bull Trap!?Massive day for CRYPTOCAP:TOTAL Crypto Market Cap with 9% move UP, breaking above the 200DMA and last cycle’s ATH.
Got rejected at the .618 Fib ~$3.19T, so work still needs to be done to confirm this region.
Expect a retest at $3T to decide if the market goes to $3.2T or back down to $2.85T
As I've been saying this past month, this is either the biggest bull trap all cycle, or it's the start of the PARABOLA 🍌
$ETH 20% Move With 20/50DMA CrossoverHOLY MOLY!
Over 20% gain for CRYPTOCAP:ETH on the day
20DMA making a bullish crossover the 50.
Next target at the .382 Fib ~$2400
Did Pectra actually work?
And is Ethereum back from the dead !?

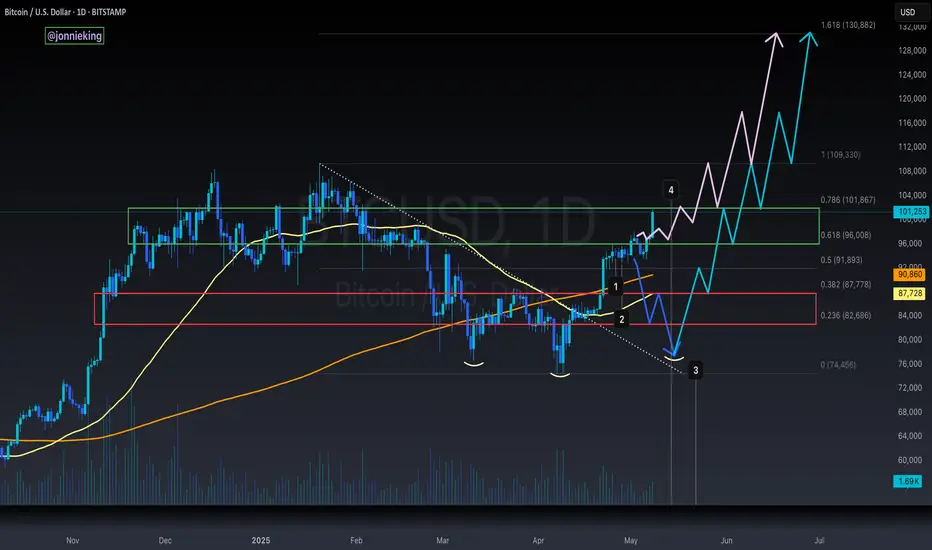
$BTC Trump Pump $100k Target HitTRUMP PUMP IS BACK 🔥
$100k target hit ✅
Another massive rip for CRYPTOCAP:BTC closing within the golden zone 🏆
Need some consistent PA in here or a rip and close above the .786 fib.
200DMA (now sitting at $90,861) is still my base case as mentioned in my original analysis several weeks ago.
IF this is the start of the PARABOLA, and you have some dry powder, a retest of ATH ~109k and then correction to .786 ~$101k would be your entry, with a SL just below the .618 ~$93k
Exciting to watch either way it goes!
This is why you always prepare for both scenarios 🤓
AAPL – Long Trade Setup (Support-Based Reversal Opportunity)Apple (AAPL) is pulling back toward a key support zone between $197–$198, aligning with both previous structural support and potential demand zone behavior. This setup offers a favorable risk-to-reward profile for a swing long entry.
🔹 Entry Zone:
$197 – $198
🎯 Take Profit Targets:
🥇 $210 – $215
🥈 $225 – $233
🛑 Stop Loss:
Just below $190

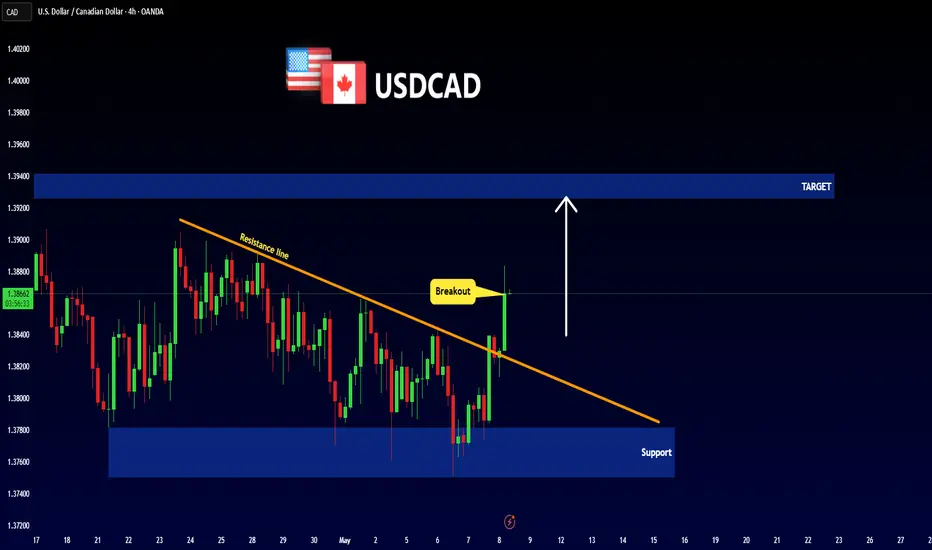
USDCAD - BULLISH MOVEHello Traders !
The USDCAD price formed a descending triangle.
Currently, The Resistance line is broken !
So, I expect a bullish move🚀
______________
TARGET: 1.39260🎯
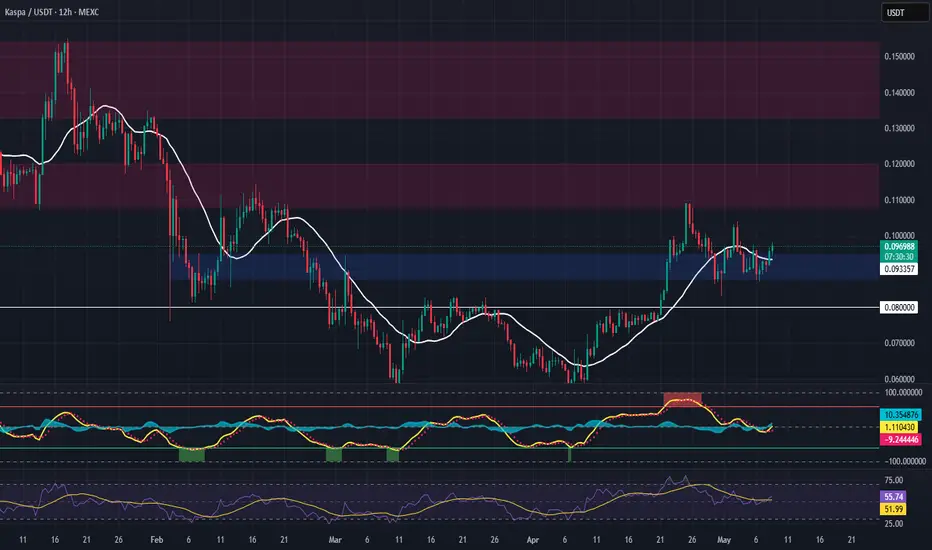
KAS – Long Spot Trade Setup (Structural Recovery in Play)KAS is beginning to show early signs of reversal, reclaiming the 20-day SMA after forming a double bottom near the $0.087 zone. This signals a potential shift in momentum and offers a favorable risk-reward opportunity.
🔹 Entry Zone:
$0.087 – $0.094
🎯 Take Profit Targets:
🥇 $0.108 – $0.120
🥈 $0.133 – $0.154
🛑 Stop Loss:
Just below $0.080
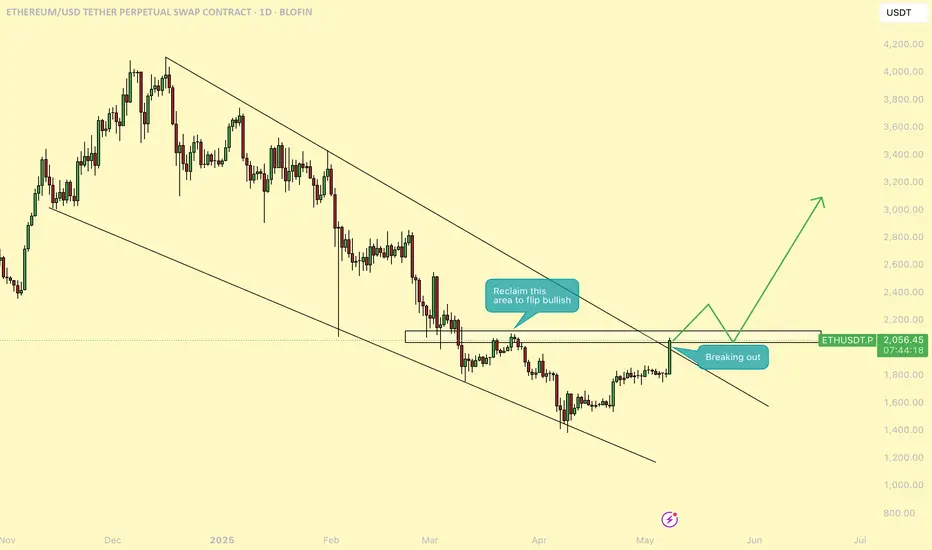
ETH - Is $3,000 next?Today marked a significant milestone for Ethereum as it successfully rolled out its much-anticipated Pectra upgrade. The update, which introduces a number of technical enhancements aimed at improving scalability, security, and developer experience, has already had a noticeable impact on market sentiment. In the hours following the upgrade, Ethereum (ETH) surged more than 13%, breaking through key resistance levels and igniting fresh bullish momentum.
From a technical standpoint, ETH is currently breaking out of a descending wedge pattern, a structure often seen as a bullish reversal signal. The price action has decisively pushed through the wedge’s upper boundary, signaling a potential end to the recent downtrend. Additionally, ETH is now testing a significant resistance zone, often referred to as the "resistance box," which has historically served as a key battleground between bulls and bears.
Should Ethereum manage to secure a clean breakout above this resistance area with strong volume. The next major upside target lies around the $3,000 level, a psychologically and technically important price point. This move could mark the beginning of a larger bullish cycle if market conditions remain favorable and momentum continues to build.
With the broader crypto market showing signs of recovery and Ethereum's fundamentals strengthening post-upgrade, traders and investors alike will be closely watching to see whether ETH can sustain its breakout and confirm this bullish trend.
-------------------------------
Thanks for your support.
- Make sure to follow me so you don't miss out on the next analysis!
- Drop a like and leave a comment!
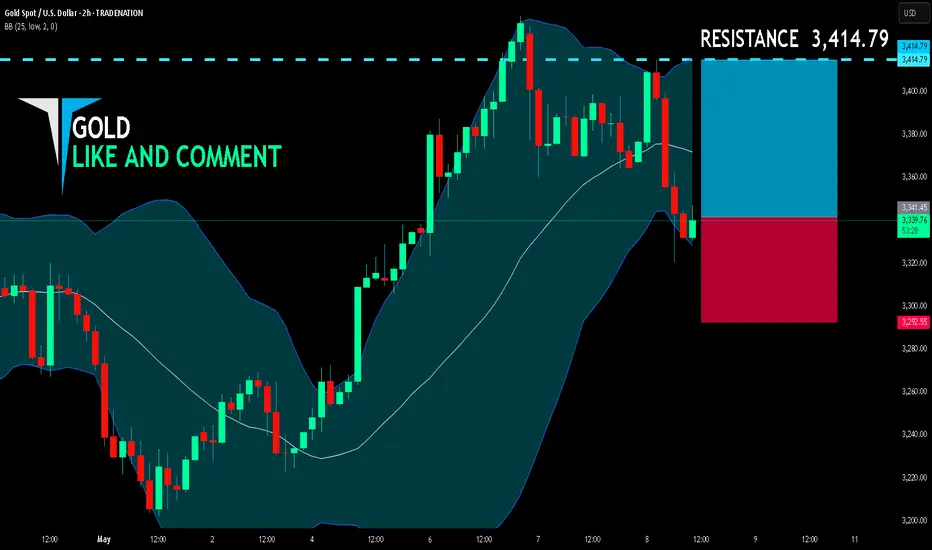
GOLD BEST PLACE TO BUY FROM|LONG
GOLD SIGNAL
Trade Direction: long
Entry Level: 3,341.45
Target Level: 3,414.79
Stop Loss: 3,292.55
RISK PROFILE
Risk level: medium
Suggested risk: 1%
Timeframe: 2h
Disclosure: I am part of Trade Nation's Influencer program and receive a monthly fee for using their TradingView charts in my analysis.
✅LIKE AND COMMENT MY IDEAS✅