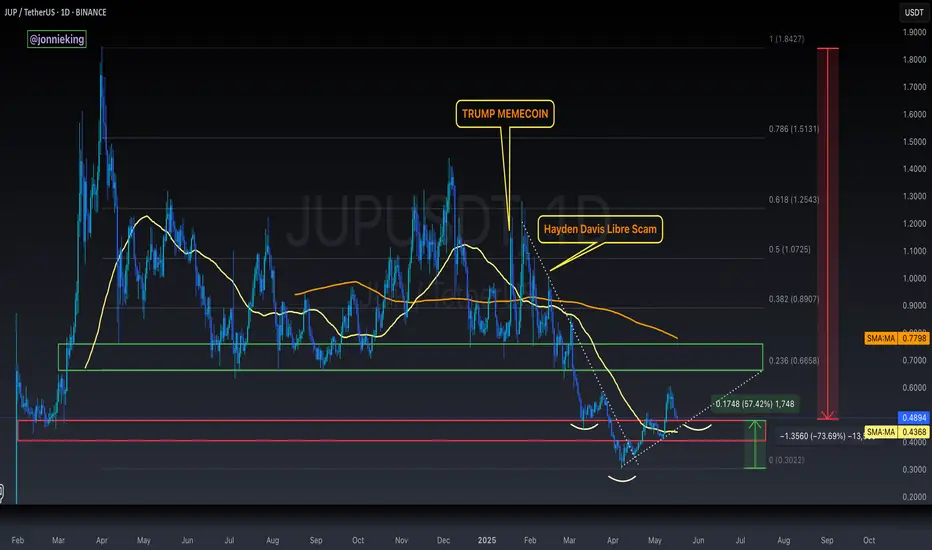
$JUP is Struggling but shows signs for HOPEwtf happened to LSE:JUP
It was once heralded at the leading DEX in web3 on the premier blockchain, but dumped ~75% from ATH with only a 57% rally.
Couldn't even make a run at the 200DMA, but retesting the 50 soon.
needs to have a big dally soon above the .236 fib to test the 200DMA. A breakthrough is a strong reversal confirmation.
market cap is about 60% cheaper than BME:UNI so im liking the value here.
Bullish Patterns
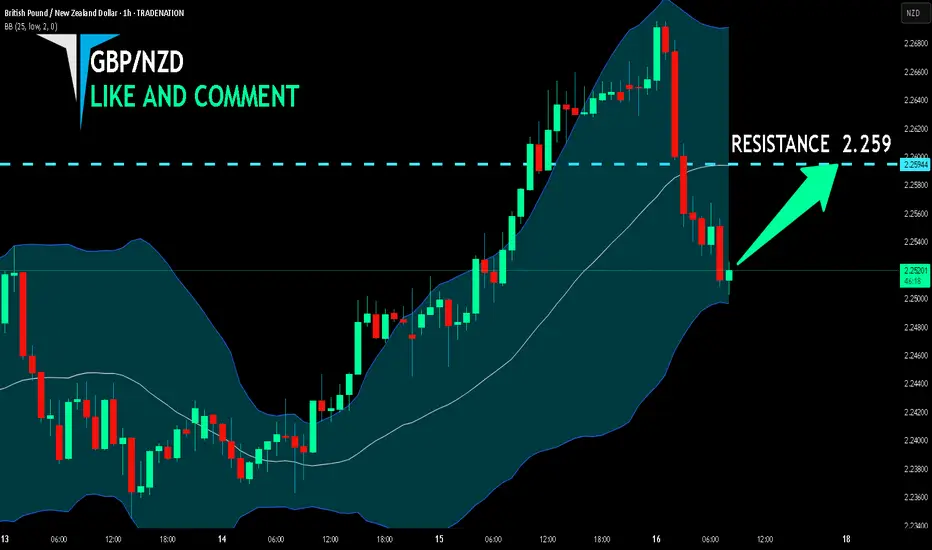
GBP/NZD BULLISH BIAS RIGHT NOW| LONG
Hello, Friends!
Previous week’s red candle means that for us the GBP/NZD pair is in the downtrend. And the current movement leg was also down but the support line will be hit soon and lower BB band proximity will signal an oversold condition so we will go for a counter-trend long trade with the target being at 2.259.
Disclosure: I am part of Trade Nation's Influencer program and receive a monthly fee for using their TradingView charts in my analysis.
✅LIKE AND COMMENT MY IDEAS✅
$SOL and Most Major Alts Get Hard Rejection from 200DMAMost of your favorite Alts such as CRYPTOCAP:SOL had hard rejections from the 200DMA.
If this trend breaks into the red box we should see a retest around the .236 Fib and 50DMA ~$140
RSI also looks McDonald's toppy
Not a good time to FOMO.
PS. Normally i dont post TA this late in the night from the US but I'm gonna consider doing more if i get some decent engagement.
Lmk if you think i should post more at these midnight hours 🎃

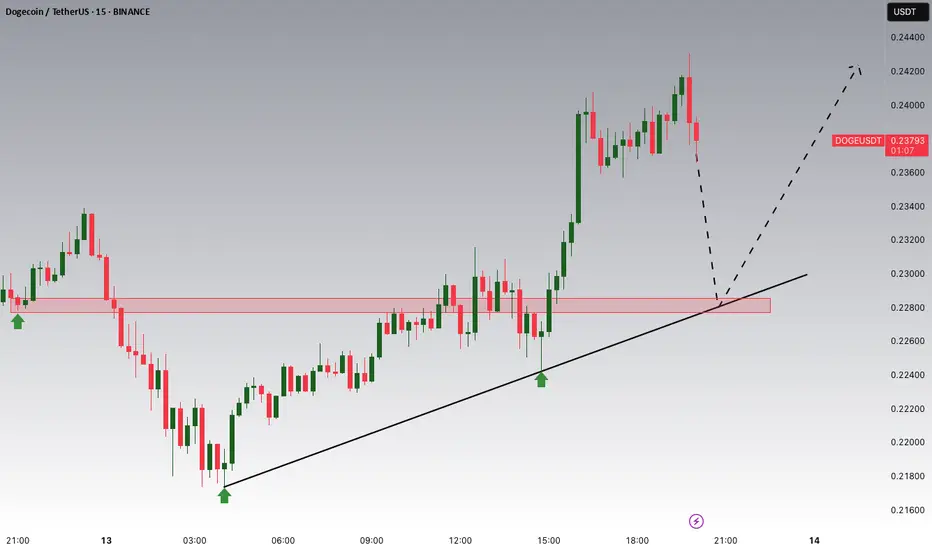
DOGE/USDT: Key Buy Opportunity at 0.22800 Support Zone!Hey Traders, in today's trading session we are monitoring DOGE/USDT for a buying opportunity around 0.22800 zone, DOGE/USDT is trading in an uptrend and currently is in a correction phase in which it is approaching the trend at 0.22800 support and resistance area.
Trade safe, Joe.
BTC: Next Big Move is Brewing – $116K Target Locked!🚀 Hey Traders! 👋
If you’re finding value in this analysis, smash that 👍 and hit Follow for high-accuracy trade setups that actually deliver! 💹🔥
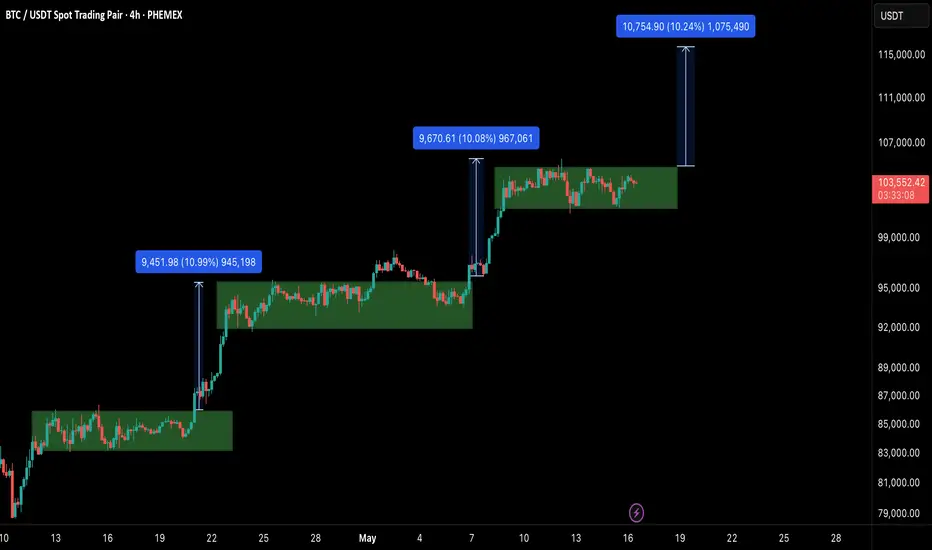
Bitcoin has been following a highly consistent rally-consolidation-breakout pattern over the last few weeks — each time breaking out with nearly +10% upside moves after forming solid accumulation zones. 📈
📊 Observational Pattern:
Let’s break it down:
Phase 1 (April 19–21)
Accumulation range: GETTEX:82K –$84K
Breakout: ~11% gain to ~$93K
Phase 2 (April 25–May 7)
Range: ~$91K–$94K
Breakout: ~10% rally to ~$103.5K
Phase 3 (Current Zone: May 9–Now)
Range: ~$101K–$104K
Price is consolidating, showing signs of continuation.
🧠 What the Chart is Telling Us:
Bitcoin is forming a bullish continuation structure (like a stepping staircase) — a pattern often seen in strong trending markets.
Each green box (marked in chart) represents a clear demand zone followed by a breakout.
If this pattern repeats, we can expect a move towards $114K–$116K.
Invalidation Level: A daily close below $101K would break the rising support and flip sentiment short-term bearish.
✅ Summary:
Target: $114K–$116K
Invalidation: Daily close < $101K
⚠️ Trade with discipline. Let the chart confirm before aping in.
We’ll keep updating as the setup evolves — pin this for reference. 🧠
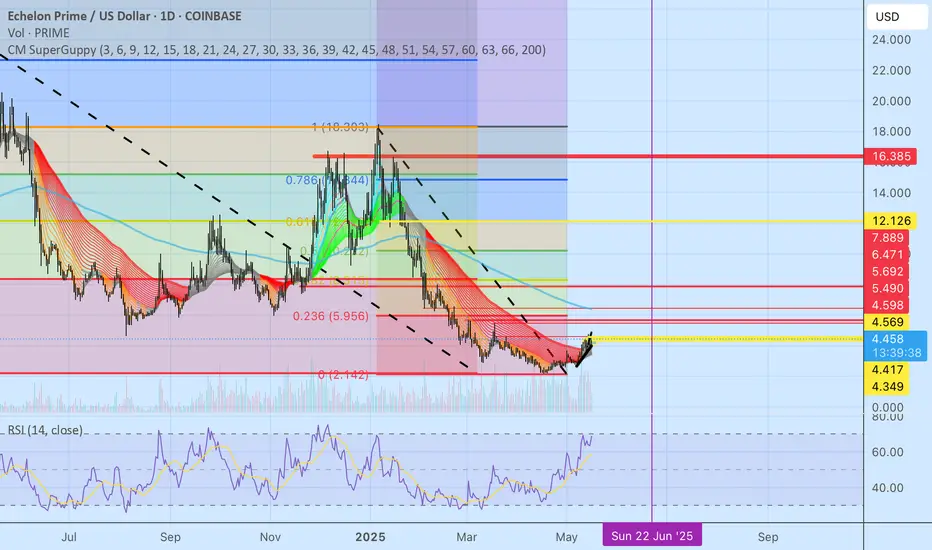
PRIME TIMEIt’s prime time for PRIME. Very low entry cost good risk to reward ratio, I believe with Bitcoin if it holds we could see PRIME do a very strong and fast push upwards. Not financial advice it’s just what I see. I was told I can’t post links in my ideas,
Long scalp if BTC breaks it’s downtrend, otherwise retrace downward until we get support as we are overbought on the daily but if this peaks we will see some price movement. If you follow me you have gained some scalp trades over 15-25% these past days on PRIME.
Good luck and have fun with it.
NC HAMMER CRYPTO will be my new name.
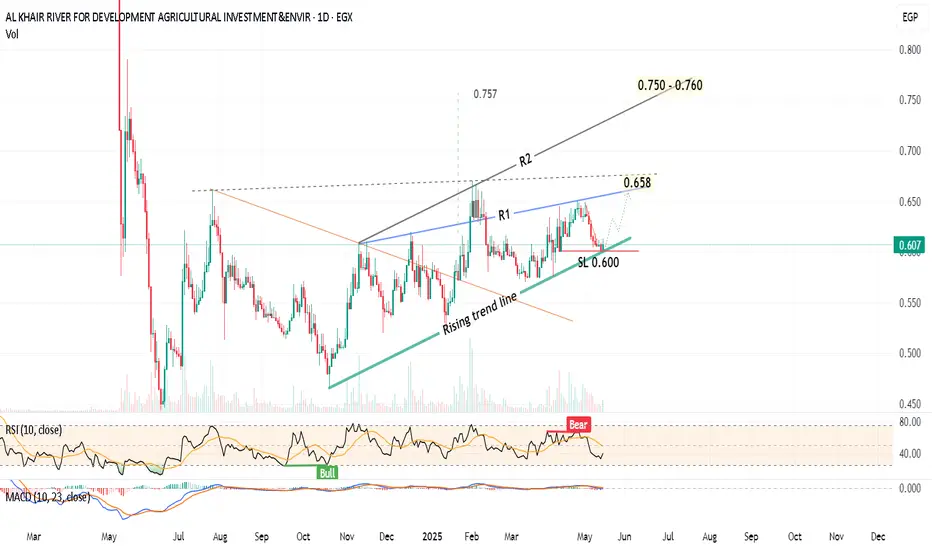
KRDI Egypt is expected to target 0.65 then 0.75Daily chart,
the stock EGX:KRDI has been trading above a rising trend line since Oct 2024. I see the price will rebounce from the current level 0.600 to test the resistance line R1.
After crossing R1 line at around 0.650 - 0.658, the next target will be R2 (around 0.750 - 0.760).
Technical indicators: RSI and MACD still need confirmation for a new entry (buy)
Note: A Resistance level at 0.670
Consider Stop Loss below 0.600 (closing)
OP/USDT Breakout Alert!!🚀 OP Breakout Alert – 100% Potential Incoming?! 👀🔥
Hey Traders! If you're all about high-conviction plays and real alpha, smash that 👍 and tap Follow for more setups that actually deliver! 💹💯
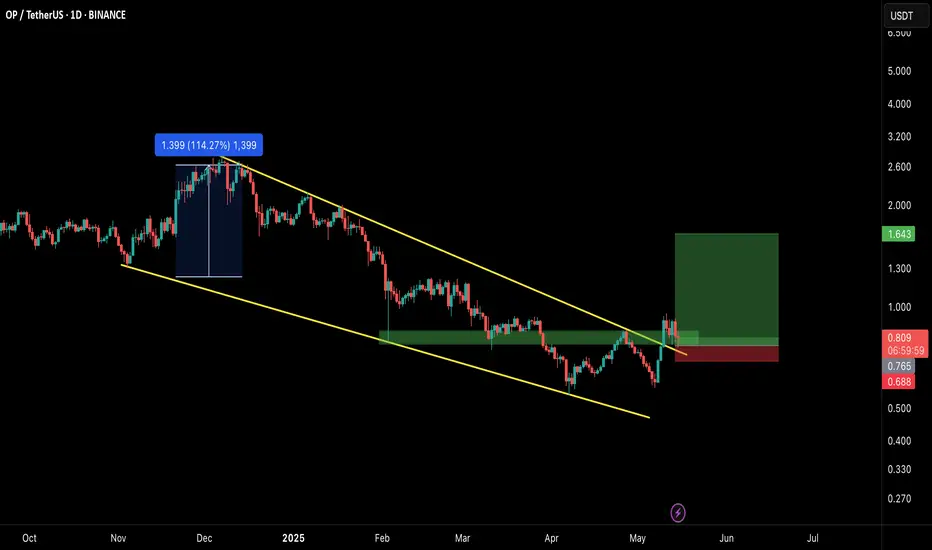
OP has successfully broken out from the falling wedge pattern on the daily timeframe, which historically signals a strong trend reversal. After retesting the breakout zone, price action looks ready for a fresh upside move!
🔹 Entry: CMP and add more up to $0.76
🎯 Targets:
→ $0.98
→ $1.21
→ $1.43
→ Final Target: $1.64
🛑 SL: $0.688
⚙️ Leverage: Low leverage (Max 5x)
📊 Structure:
Falling wedge breakout ✅
Retest holding strong ✅
Volume starting to pick up 📈
We’re watching closely—this setup has the potential to mimic the last 114% rally. Let's see how it unfolds! 🚀
💬 What’s your take on OP from here?
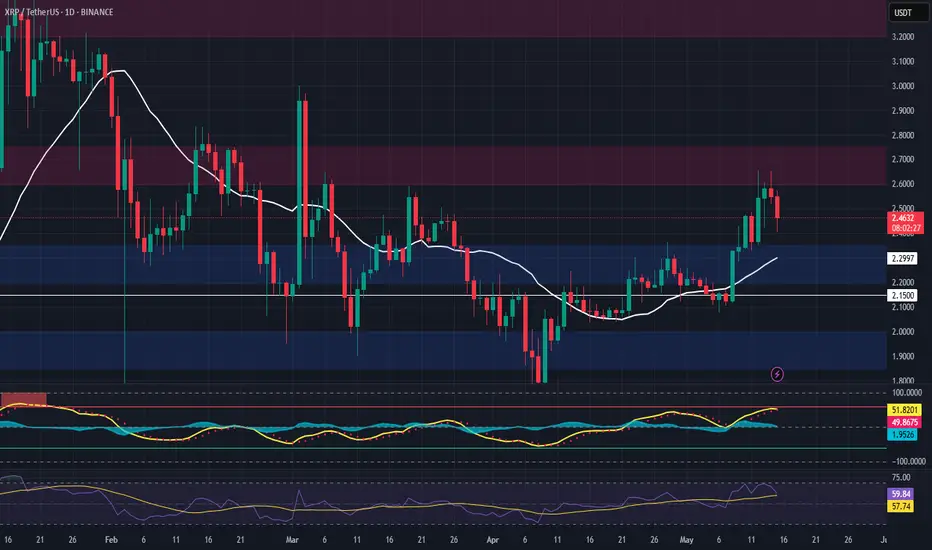
XRP – Long Swing Trade Setup Near Key SupportXRP is pulling back toward a major support zone around $2.25, a level that previously acted as a breakout region. With the market showing signs of rotating into strength across large caps, this could offer a solid risk-reward entry for a medium- to long-term swing trade.
🔹 Entry Zone:
$2.25 support zone
🎯 Take Profit Targets:
🥇 $2.60 – $2.75 (prior supply zone & range mid-point)
🥈 $3.15 – $3.40 (macro resistance / high timeframe target)
🛑 Stop Loss:
Just below $2.15 (invalidates the reclaim thesis & opens risk to deeper correction)
ONDO (Ondo Finance) – Long Swing Trade Setup Near Key SupportONDO is retracing alongside broader market weakness and is approaching a key support zone around $0.95, which previously acted as a breakout base. This area now presents a potential high-reward swing trade if buyers step in to defend the level.
🔹 Entry Zone:
$0.95 (critical horizontal support & potential demand zone)
🎯 Take Profit Targets:
🥇 $1.15 – $1.25 (prior local highs and resistance)
🥈 $1.40 – $1.55 (macro range extension)
🛑 Stop Loss:
Just below $0.83 (breakdown below previous structural low)

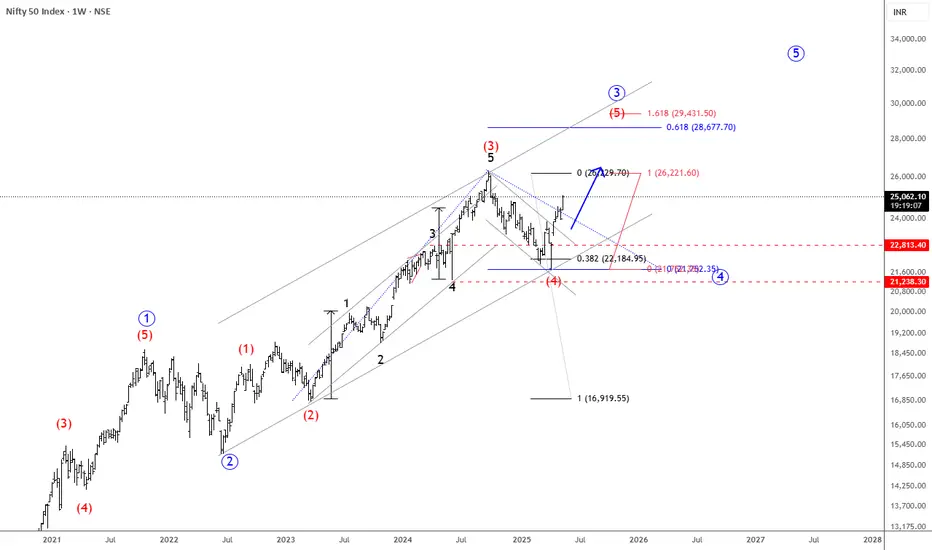
NIFTY Resumes Its Bullish TrendHello traders! Today we will talk about an Indian stock market exchange NIFTY 50, as we see nice and clean pattern from technical and Elliott wave perspective.
As you can see, NIFTY is in an impulsive bullish rise on the weekly basis, which looks like a higher degree wave 3 of an ongoing five-wave bullish impulse by Elliott wave theory.
After recent corrective slowdown in subwave (4), which perfectly tested channel support line and 38,2% Fibonacci retracement, we can now see it extending even higher, ideally for subwave (5) of a higher degree wave 3 that can push the price even up to 28k-30k area this year, just watch out on short-term pullbacks.
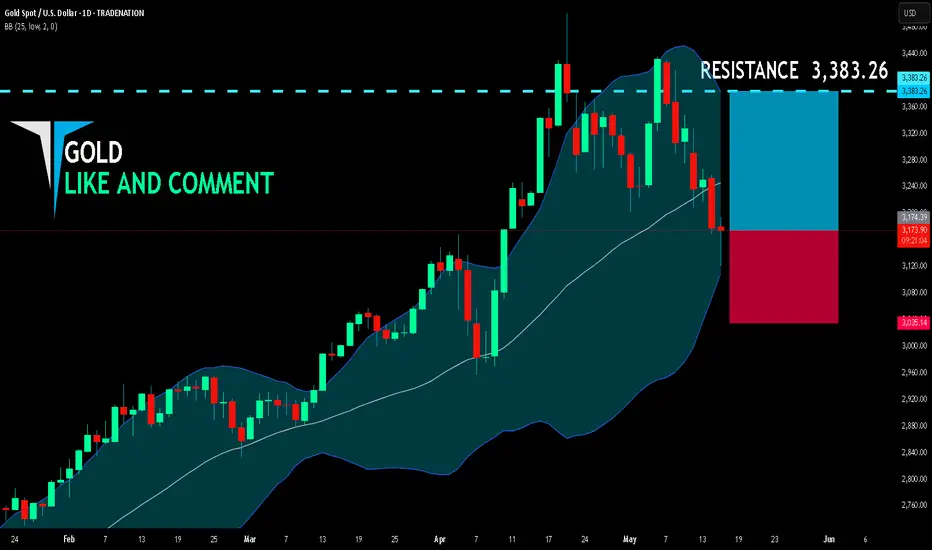
GOLD BULLS ARE STRONG HERE|LONG
GOLD SIGNAL
Trade Direction: long
Entry Level: 3,174.39
Target Level: 3,383.26
Stop Loss: 3,035.14
RISK PROFILE
Risk level: medium
Suggested risk: 1%
Timeframe: 1D
Disclosure: I am part of Trade Nation's Influencer program and receive a monthly fee for using their TradingView charts in my analysis.
✅LIKE AND COMMENT MY IDEAS✅
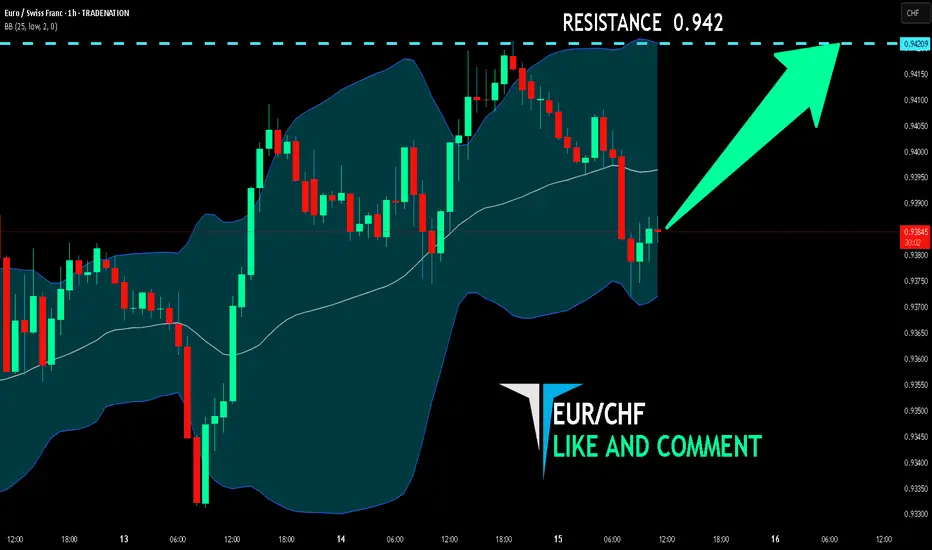
EUR/CHF BULLS WILL DOMINATE THE MARKET|LONG
Hello, Friends!
EUR/CHF pair is in the downtrend because previous week’s candle is red, while the price is obviously falling on the 1H timeframe. And after the retest of the support line below I believe we will see a move up towards the target above at 0.942 because the pair oversold due to its proximity to the lower BB band and a bullish correction is likely.
Disclosure: I am part of Trade Nation's Influencer program and receive a monthly fee for using their TradingView charts in my analysis.
✅LIKE AND COMMENT MY IDEAS✅
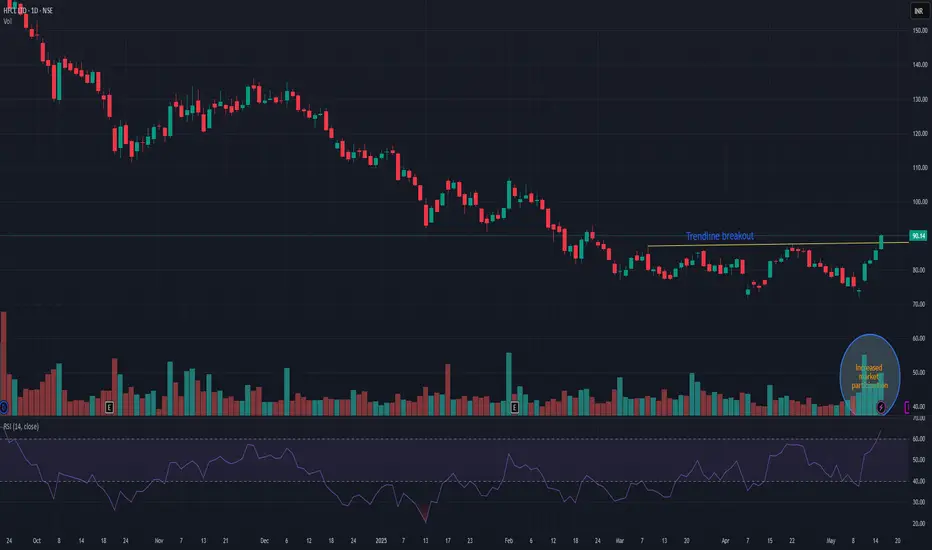
HFCLHFCL showing trendline breakout with higher high pattern. Market participation has also increased since few sessions. Probability of new momentum rally is quite higher. It has also booked highest weekly volume since last 7-8 months.
Gold had Swept Lows and Filled Bullish Gaps! Reversal next?This is price action that I was patiently waiting for. Now that we have that sweep lows Im looking for signs price want to turn around. It can remain bearish for now. But Im expecting to see something clear by the time we get inside of the killzone.

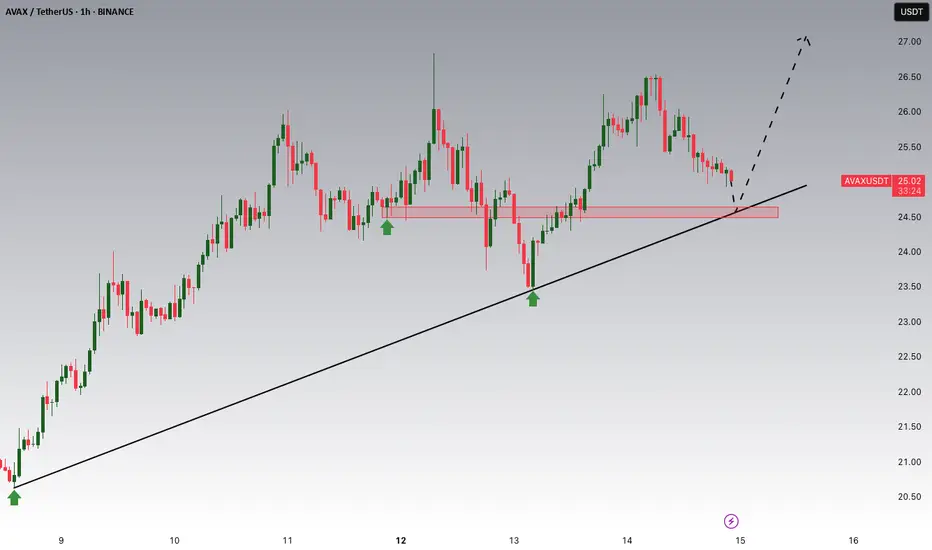
AVAX Potential UpsidesAVAX/USDT is currently trading within a broader uptrend and is in a corrective phase. The price is approaching the 24.60 level, a key support and resistance area that aligns with the prevailing trend structure. This zone may offer insight into potential market reaction and the strength of the ongoing trend.
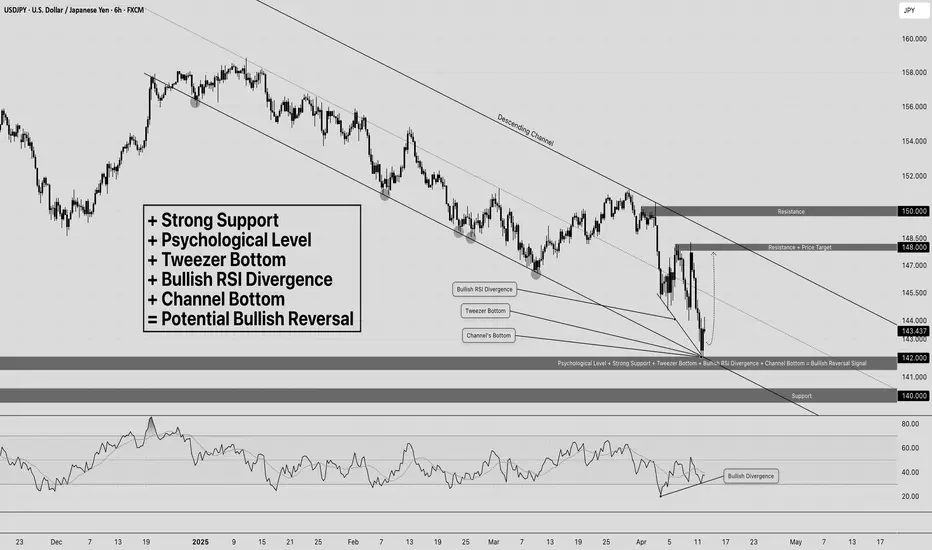
Too Many Bullish Clues — Greed Activated📍Current Price: 143.437
TimeFrame 30Min
Bullish Reasons:
+ Strong Support
+ Psychological Level
+ Tweezer Bottom
+ Bullish RSI Divergence
+ Channel Bottom
= Potential Bullish Reversal
Support & Resistance Levels:
• 142.000 – Strong Support + Psychological Level
• 140.000 – Strong Support + Psychological Level
• 148.000 – Psychological Level + Price Target
• 150.000 – Psychological Level
"Trade smart – always follow your risk management.
Protect your account first, profits will follow.
Happy trading!"
$1000 on this one NQ tradeBeautiful trade caught here on NQ. Happy we were able to capitalize on this and make the right decisions when it came to risk and our profits.
We'll see where NQ takes us next, our MNQ trade could get stopped out and if it does I am content either way. GETTEX:52K threshold reached for our prop trading challenge account.
May this month be the month we are able to pass this account and start capitalizing from our trading.

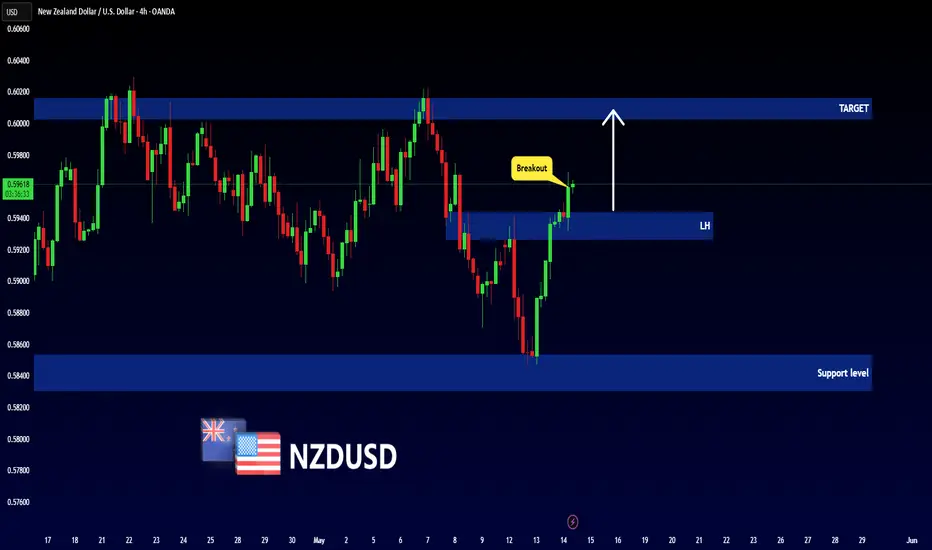
NZDUSD - NEW BREAKOUT !Hello Traders !
On Monday 12 May, The NZDUSD reached the support level (0.5853 - 0.5830).
The price broke the lower high (change of character).
So, I expect a bullish move🚀
_______________
TARGET: 0.60030🎯
DOGE (Dogecoin)–Pullback Opportunity Amid Market-Wide ResistanceWith the total crypto market cap stalling at a major resistance zone, many altcoins — including DOGE — are due for a healthy retracement after recent strong moves. This sets up a potential buy-the-dip opportunity as DOGE returns to key support near $0.20.
🔹 Entry Zone:
$0.20 (next major support zone after recent rally)
🎯 Take Profit Targets:
🥇 $0.23 – $0.24
🥈 $0.30 – $0.31
🛑 Stop Loss:
Just below $0.18 (invalidates the support-based long idea)

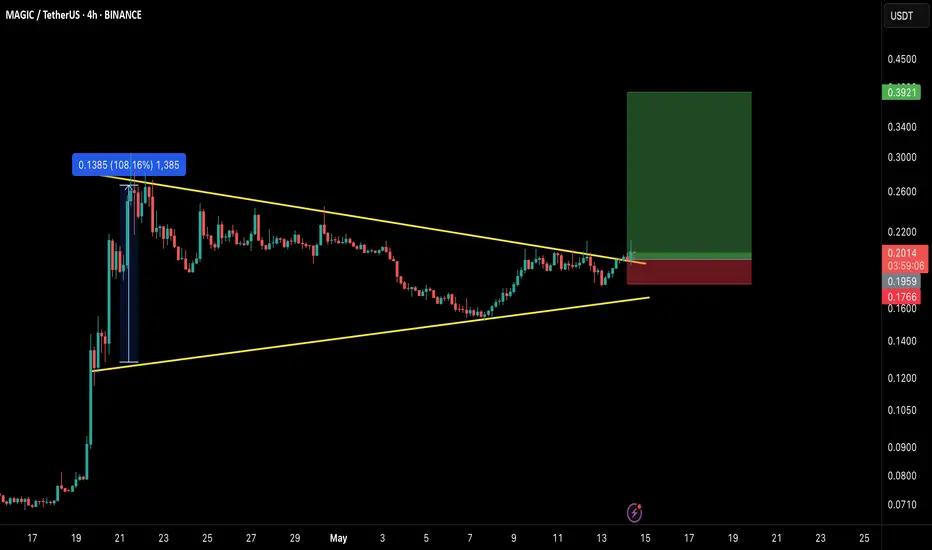
MAGIC Breaking Out – Next 100% Move on the Horizon?🚀 MAGIC Breakout Alert – 100% Potential Incoming?! 👀🔥
Hey Traders! If you're all about high-conviction plays and real alpha, smash that 👍 and tap Follow for more setups that actually deliver! 💹💯
MAGIC has finally broken out from a long-standing symmetrical triangle on the 4H chart — a classic bullish reversal pattern. After consolidating tightly, it's now flashing signs of a strong upward impulse! ⚡
📌 Entry: CMP ($0.200) and add more on dips up to $0.195
🎯 Targets: $0.25 / $0.29 / $0.33 / $0.39
🛑 Stoploss: Close below $0.176
⚙️ Leverage: 5x (Max)
✨ Previous breakout delivered over 100% gains — this one could be next!
Chart structure + volume looks perfect. If BTC stays calm, we might witness another explosive move in MAGIC.
💬 What are your thoughts on this setup? Drop your opinions below and don't forget to like & follow for more high-conviction trade setups! 💥
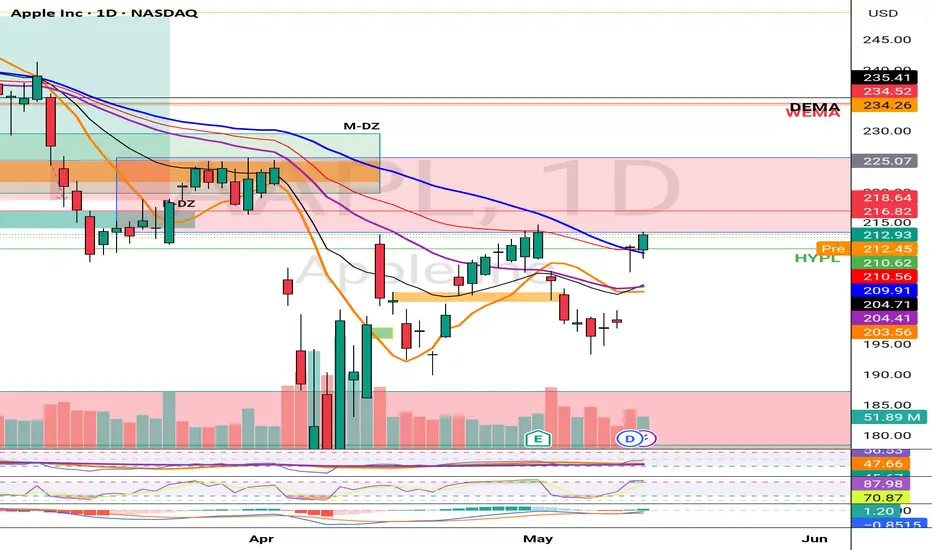
AAPL LOOKING BULLISH 14TH MAY 2025Aapl is looking good to go long at current price as every demand is being respected and price is looking to go deeper into tbe supply zone.
So I will be going long with STOCKS ONLY.
If you any doubts do let me know in the comments below
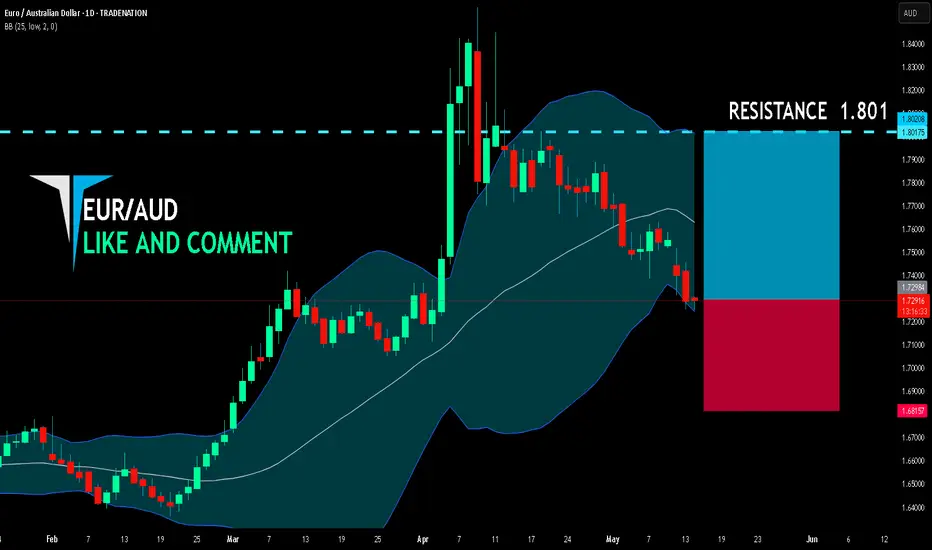
EUR/AUD BUYERS WILL DOMINATE THE MARKET|LONG
EUR/AUD SIGNAL
Trade Direction: long
Entry Level: 1.729
Target Level: 1.801
Stop Loss: 1.681
RISK PROFILE
Risk level: medium
Suggested risk: 1%
Timeframe: 1D
Disclosure: I am part of Trade Nation's Influencer program and receive a monthly fee for using their TradingView charts in my analysis.
✅LIKE AND COMMENT MY IDEAS✅