Gold – Bear-to-Bull Transition in Motion?🧠 MJTrading:
TVC:GOLD – 8H Chart: Bulls, It’s Your Move.
📸 Viewing Tip:
🛠️ Some layout elements may shift depending on your screen size.
🔗 View the fixed high-resolution chart here:
The impulsive move from 3000 to 3500 wasn’t just a trend — it was a statement of strength.
That rally carved the ATH, then left behind weeks of digestion and structural compression.
Now, the market may be setting up for its next decision.
Notice how each bearish leg has been shrinking — a classic behavioral signal that sellers are losing momentum — possibly a shift in control underway.
We’re also pressing above the downtrend line from the ATH (3500), while the uptrend from 3000 remains clean and respected.
We’re now testing the 3400 zone — a key battleground.
📍 If bulls want to reclaim the momentum and show dominance, this is the moment to act.
🔹 1st Support: 3363–3377
🔹 2nd Support: Rising trendline
🎯 Target Zone: 3455–3500+ (Liquidity Pool & ATH proximity)
⚠️ Break back inside the triangle could delay the breakout narrative.
⚠️ If momentum fails to increase from here, and bulls can’t break out with conviction, the market is likely to remain range-bound for longer — extending the sideways phase between 3250–3500.
💭 If you’re watching for a new ATH… stay sharp, stay structured — the market rewards patience and readiness.
“If the structure speaks to you, let it echo, boost it.”
📐 MJTrading 🚀
What do you think?
#GoldAnalysis #XAUUSD #MarketStructure #LiquiditySweep #AnythingCanHappen
#MJTrading
#ChartDesigner
Psychology Always Matters:
Click on them for the caption...
Bullish Patterns

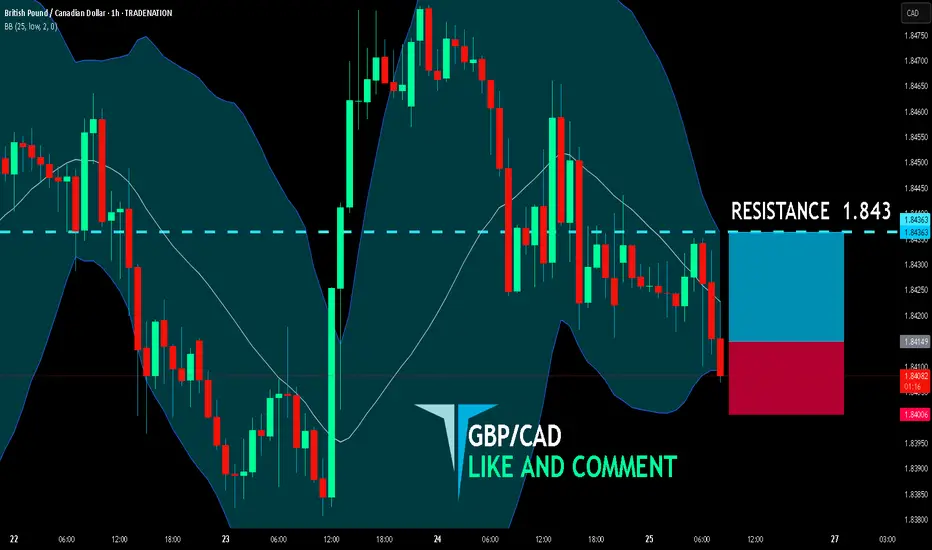
GBP/CAD BUYERS WILL DOMINATE THE MARKET|LONG
GBP/CAD SIGNAL
Trade Direction: long
Entry Level: 1.841
Target Level: 1.843
Stop Loss: 1.840
RISK PROFILE
Risk level: medium
Suggested risk: 1%
Timeframe: 1h
Disclosure: I am part of Trade Nation's Influencer program and receive a monthly fee for using their TradingView charts in my analysis.
✅LIKE AND COMMENT MY IDEAS✅
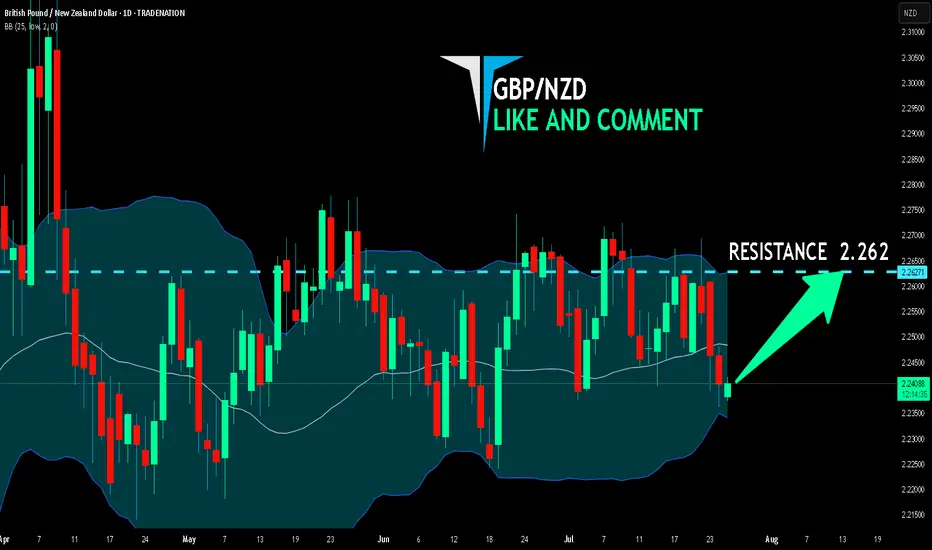
GBP/NZD BEST PLACE TO BUY FROM|LONG
Hello, Friends!
We are going long on the GBP/NZD with the target of 2.262 level, because the pair is oversold and will soon hit the support line below. We deduced the oversold condition from the price being near to the lower BB band. However, we should use low risk here because the 1W TF is red and gives us a counter-signal.
Disclosure: I am part of Trade Nation's Influencer program and receive a monthly fee for using their TradingView charts in my analysis.
✅LIKE AND COMMENT MY IDEAS✅
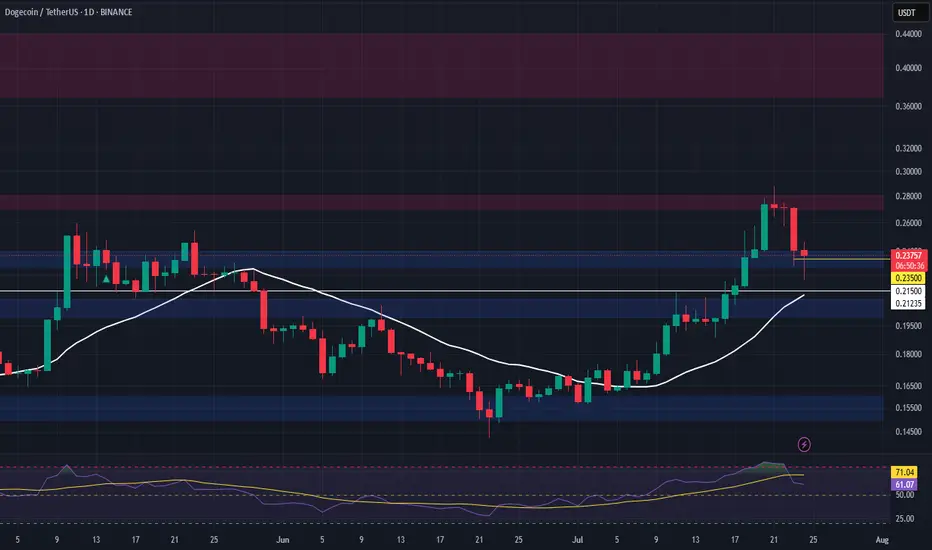
DOGE Swing Trade – Key Support in PlayDOGE is currently holding a major support zone, offering a strong risk-reward opportunity for a long swing position. With bullish sentiment and meme coin narratives returning, this level is worth watching for upside continuation.
📌 Trade Setup:
• Entry Zone: $0.23 – $0.24
• Take Profit Targets:
o 🥇 $0.27 – $0.28
o 🥈 $0.37 – $0.44
• Stop Loss: Just below $0.215
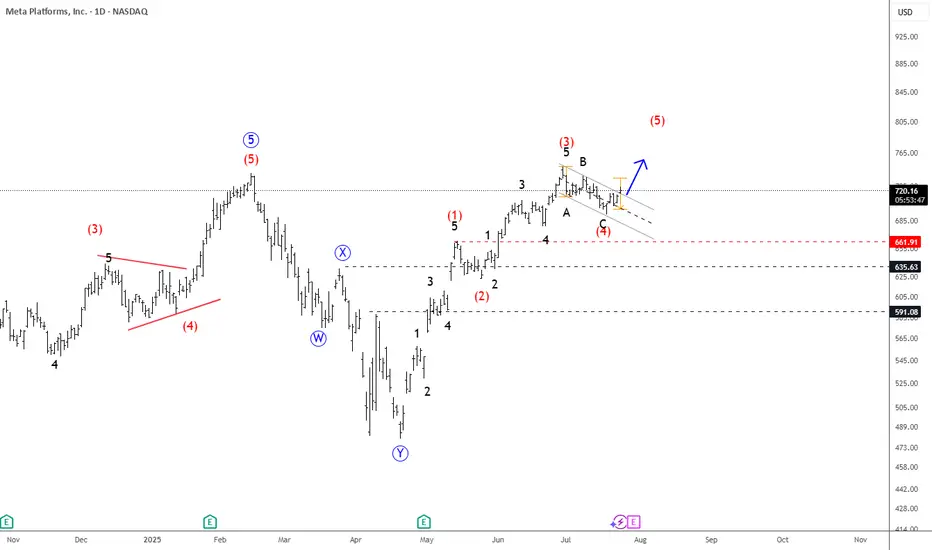
META Slows Down For A Correction Within UptrendMeta has seen a strong recovery recently, but barely retested February highs around 740, from where we can see some nice pullback, but it appears corrective, since it’s unfolding in three waves, and forming a potential bull flag — likely wave 4. A breakout above the downward channel on a daily close could signal the start of wave 5 and a push to new highs.
However, keep a close eye on the 666.1; a break below this level would invalidate the bullish view and suggest a deeper consolidation phase may follow.
Highlights:
Direction: Up (pending breakout)
Structure: Wave 4 bull flag; wave 5 possible soon
Support: 680 / 690
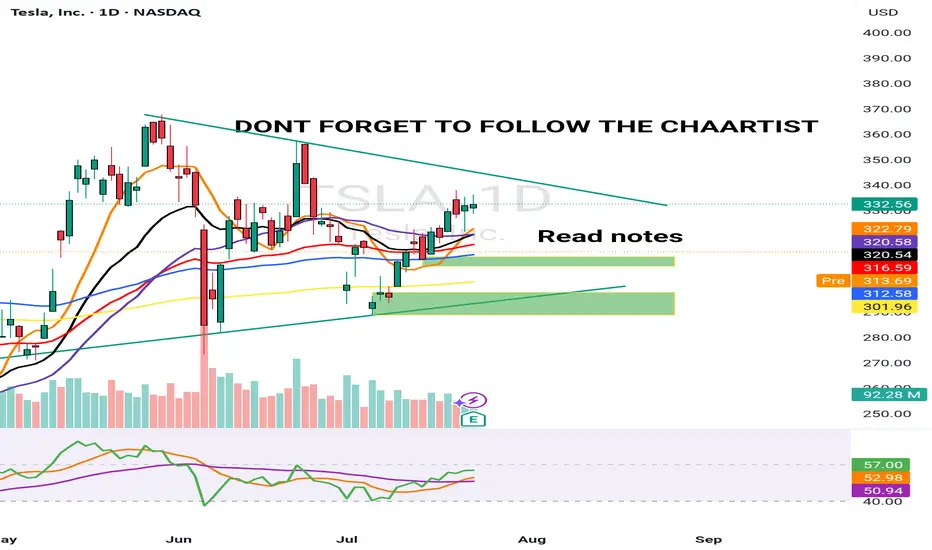
TSLA 24 JULY 2025I have marked 2 levels in green boxes. Price is inside this box pre market and TSLA is down -8.5% from the highs of $338 post market till $310 & -7.5% down from yesterday's close
A better level is the lower demand zone but its not the best. Price has not hit any major resistance.
My job is to read the data & trade. I am still bullish & 10% up down move is normal for Tesla &
This could be a "BEAR TRAP".
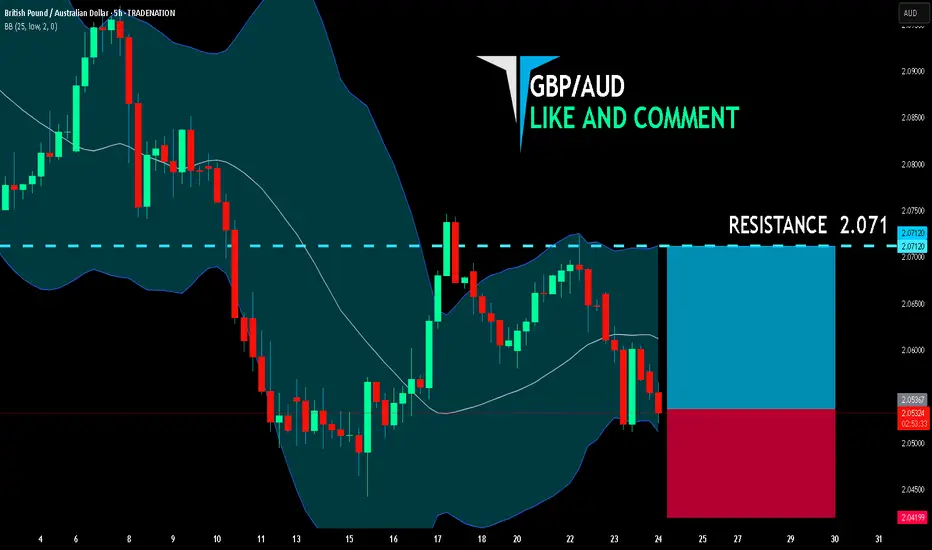
GBP/AUD LONG FROM SUPPORT
GBP/AUD SIGNAL
Trade Direction: long
Entry Level: 2.053
Target Level: 2.071
Stop Loss: 2.041
RISK PROFILE
Risk level: medium
Suggested risk: 1%
Timeframe: 5h
Disclosure: I am part of Trade Nation's Influencer program and receive a monthly fee for using their TradingView charts in my analysis.
✅LIKE AND COMMENT MY IDEAS✅
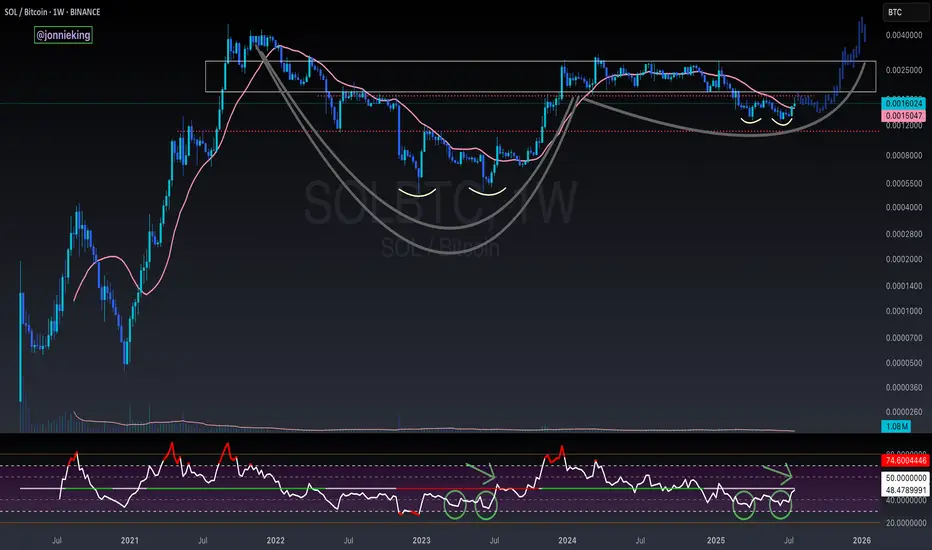
SOL / BTC Cup and Handle Weekly ChartBeautiful cup and handle on the SOL / BTC Weekly chart.
Need to break above the neckline and reclaim the POI.
Double bottom on the RSI matches just before the rip in July 2023.
AUDJPY Bullish Order Block In SightOANDA:AUDJPY Price finds Support at the Swing Low @ 95.629 and creates a Swing High @ 96.741!
Based on the ICT Method, the Swing Low broke Sell-Side Liquidity @ 95.995 and opened up a Bullish Order Block Opportunity @ 96.217!
Price is currently working down from 96.49 at the time of publishing but once Price visits the Order Block, this could deliver Long Opportunities!!

ARTY - The Undervalued Gaming Rocket?While most eyes are on memecoins and major Layer-1s, a sleeping giant may be gearing up in the GameFi sector — and this time, it’s powered by real innovation and user growth.
🎮 Fundamental Boost
Artyfact has just launched its long-awaited Play-and-Earn mode — the first of its kind. This new feature is expected to onboard hundreds of thousands of gamers into the ecosystem. And here’s the catch: players can only purchase gaming NFTs using KUCOIN:ARTYUSDT . This shift not only introduces a fresh wave of demand but also builds real token utility — the kind most GameFi tokens lack.
💼Additionally, recent sell pressure from early investors has now faded. Those who had been staking ARTY for three years have finally taken their profits. With that wave of selling behind us, the token now has room to breathe — and potentially fly.
And yes, I bought ARTY myself — not financial advice, but I’m personally betting on its next big move.
📊 Technical Analysis
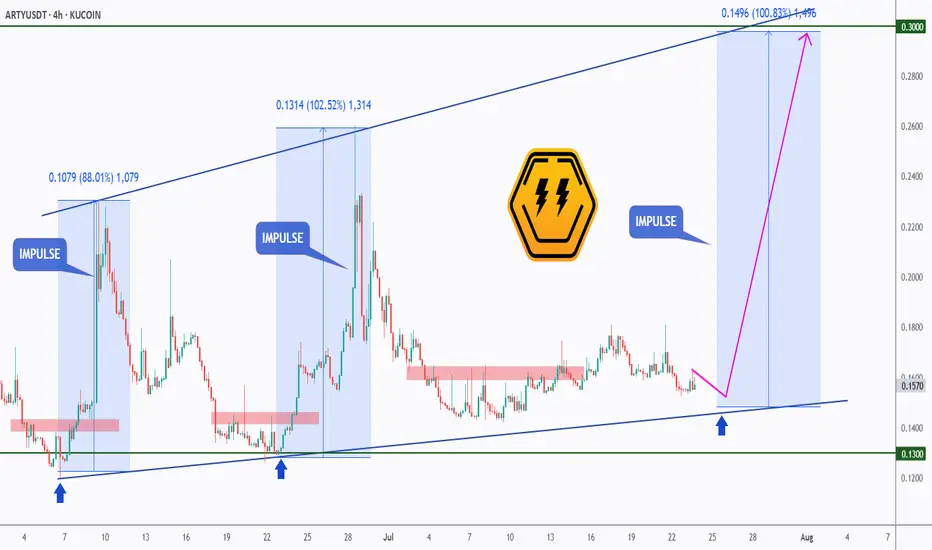
AMEX:ARTY has been trading within a bullish ascending triangle, forming higher lows and maintaining strong support around the $0.13 level. Each time it tapped this zone, it triggered strong impulse moves — one up 88%, another over 100%.
Right now, ARTY is back at that exact support level, with a third impulse wave potentially brewing. A bounce from here could send it back toward the upper trendline near $0.30 — our first target.
If that breaks, the next resistance sits around the $0.70 zone, a previous structural high and psychological round number. And if the gaming adoption kicks in as expected, we could be heading toward a macro bull market target of $1+, which would represent a multi-X move from here.
📈 3 Bullish Targets for AMEX:ARTY
$0.30 — top of ascending triangle
$0.70 — structural resistance from prior impulse
$1.00+ — psychological milestone backed by new NFT demand and adoption
📍 Why ARTY?
Artyfact is not just another GameFi project — it’s building a functional gaming economy where NFTs have real use, and where the token is required for participation. In a sea of hype-driven tokens, ARTY stands out by actually shipping product and onboarding users.
With the new Play-and-Earn mode gaining traction, a solid technical base forming, and sell pressure behind us, ARTY could be setting up for its biggest run yet.
➡️ As always, make sure to do your own research and only invest in what you truly believe in.
🎯 Stick to your trading plan — entry, risk, and execution.
Good luck!
All strategies are good, if managed properly.
~ Richard Nasr
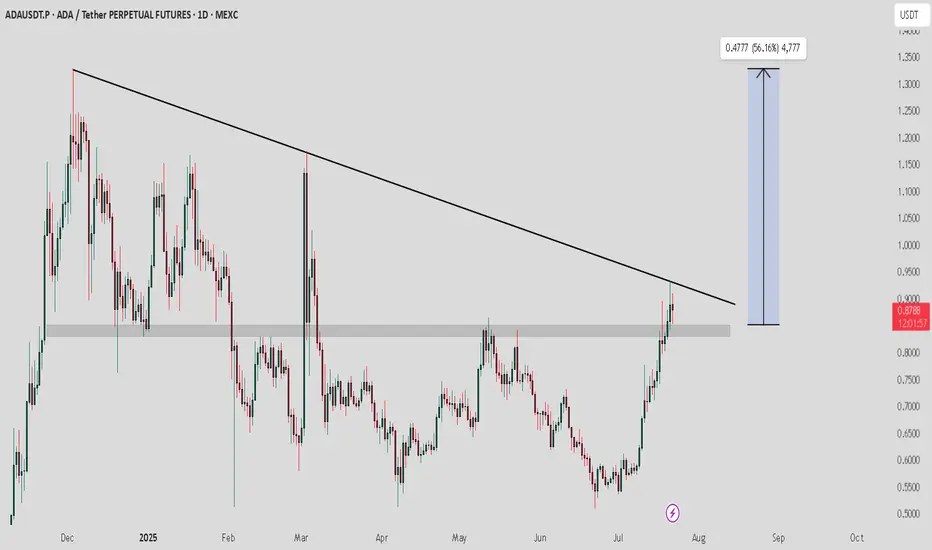
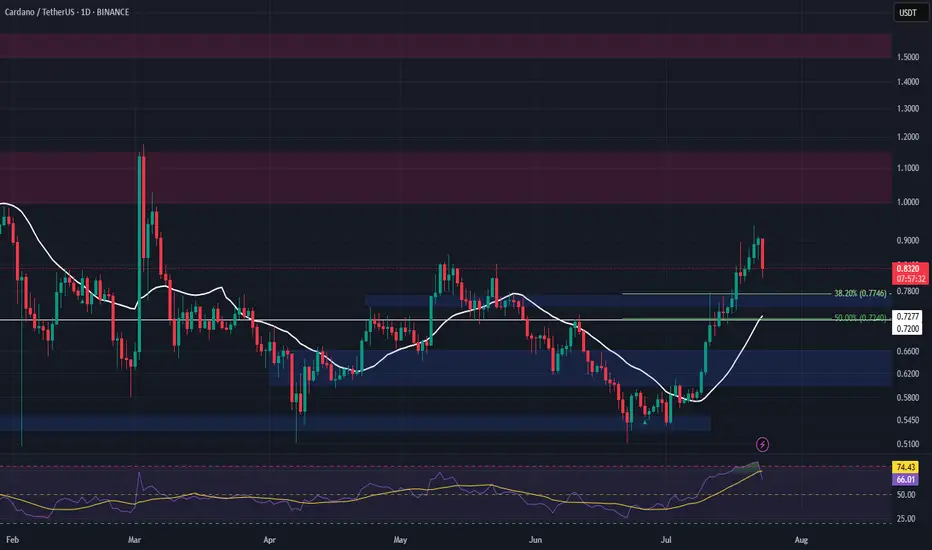
ADA Spot Entry – Pullback Opportunity AheadADA has reached a major resistance zone, and with the broader market appearing overbought, a healthy pullback looks likely. We’re watching for a dip into the next key support area to accumulate for spot holdings.
📌 Trade Setup:
• Entry Zone: $0.75 – $0.77
• Take Profit Targets:
o 🥇 $1.00 – $1.15
o 🥈 $1.50 – $1.60
• Stop Loss: Just below $0.72
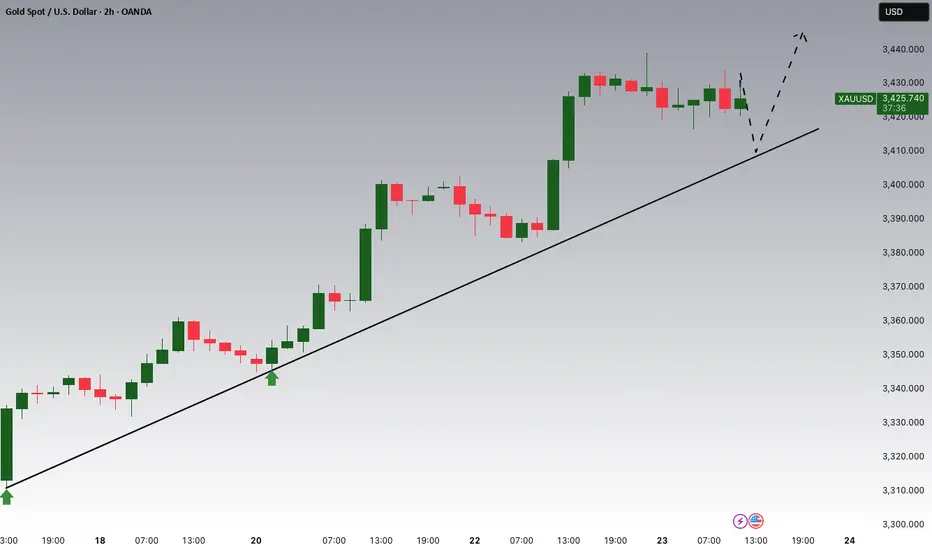
Gold is Targeting Fresh HighsHey Traders, in today's trading session we are monitoring Gold for a buying opportunity around 3,410 zone, Gold is trading in an uptrend and currently is in a correction phase in which it is approaching the trend at 3,410 support and resistance area.
Trade safe, Joe.
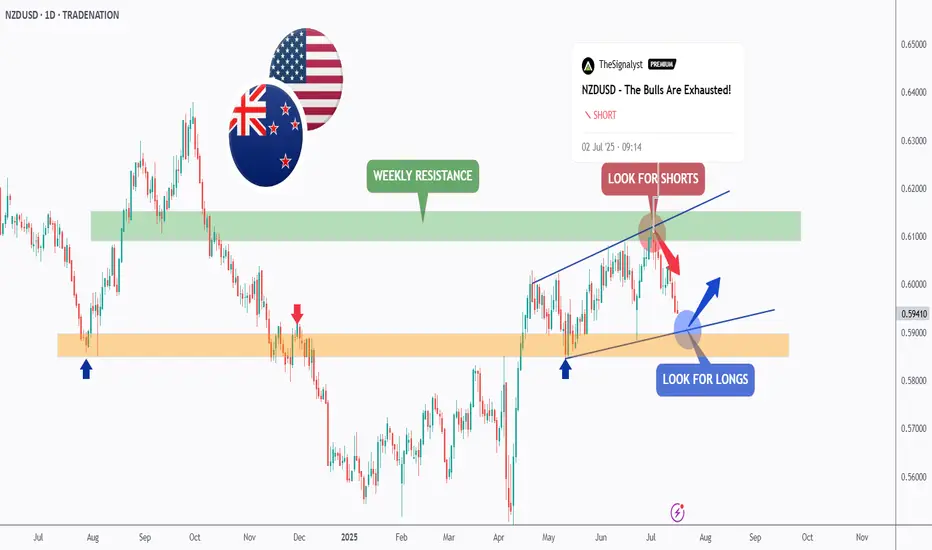
NZDUSD - It is Time!Hello TradingView Family / Fellow Traders. This is Richard, also known as theSignalyst.
As per our last NZDUSD analysis, attached on the chart, it rejected the upper bound of the blue wedge pattern and traded lower.
📈This week, NZDUSD is retesting the lower bound of the wedge.
Moreover, the orange zone is a strong weekly support.
🏹 Thus, the highlighted blue circle is a strong area to look for buy setups as it is the intersection of the lower blue trendline and orange support.
📚 As per my trading style:
As #NZDUSD approaches the blue circle zone, I will be looking for bullish reversal setups (like a double bottom pattern, trendline break , and so on...)
📚 Always follow your trading plan regarding entry, risk management, and trade management.
Good luck!
All Strategies Are Good; If Managed Properly!
~Rich
Disclosure: I am part of Trade Nation's Influencer program and receive a monthly fee for using their TradingView charts in my analysis.
Milking USDCHF again! This time => BULLISH!Hello TradingView Family / Fellow Traders. This is Richard, also known as theSignalyst.
📈USDCHF has been overall bullish as a correction phase, trading within the rising wedge marked in blue.
This week, USDCHF is retesting the lower bound of the wedge pattern.
Moreover, the green zone is a strong structure.
🏹 Thus, the highlighted blue circle is a strong area to look for buy setups as it is the intersection of the lower blue trendline and green support.
📚 As per my trading style:
As #USDCHF approaches the blue circle zone, I will be looking for bullish reversal setups (like a double bottom pattern, trendline break , and so on...)
📚 Always follow your trading plan regarding entry, risk management, and trade management.
Good luck!
All Strategies Are Good; If Managed Properly!
~Richard Nasr
Disclosure: I am part of Trade Nation's Influencer program and receive a monthly fee for using their TradingView charts in my analysis.

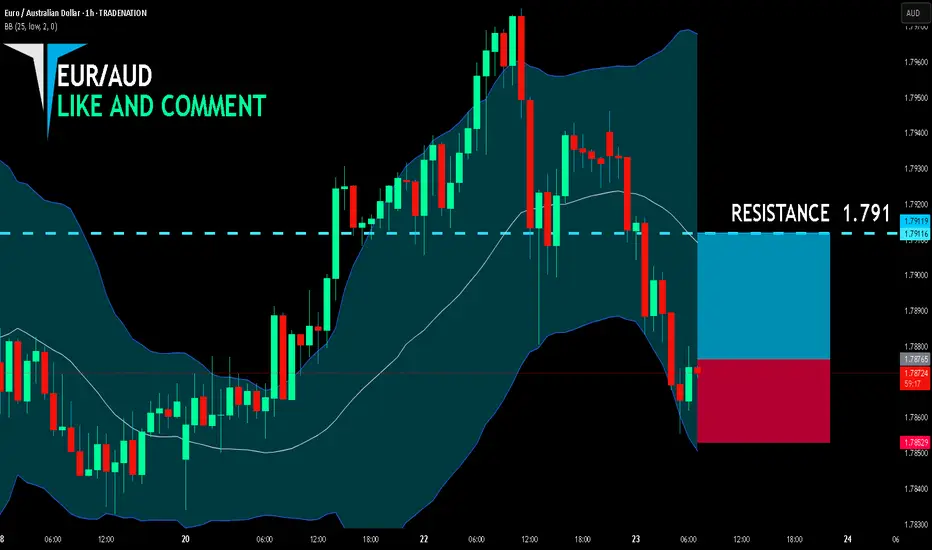
EUR/AUD BUYERS WILL DOMINATE THE MARKET|LONG
EUR/AUD SIGNAL
Trade Direction: long
Entry Level: 1.787
Target Level: 1.791
Stop Loss: 1.785
RISK PROFILE
Risk level: medium
Suggested risk: 1%
Timeframe: 1h
Disclosure: I am part of Trade Nation's Influencer program and receive a monthly fee for using their TradingView charts in my analysis.
✅LIKE AND COMMENT MY IDEAS✅
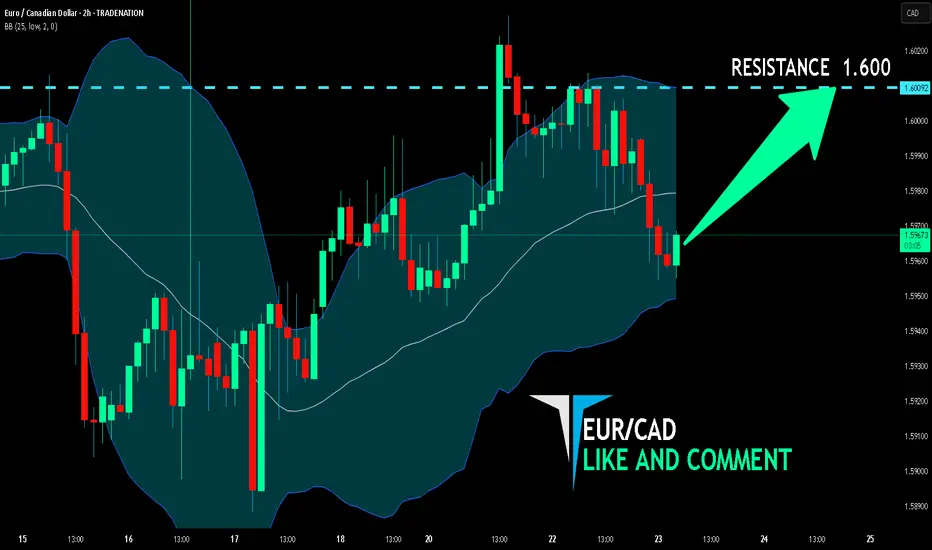
EUR/CAD BULLISH BIAS RIGHT NOW| LONG
Hello, Friends!
Previous week’s red candle means that for us the EUR/CAD pair is in the downtrend. And the current movement leg was also down but the support line will be hit soon and lower BB band proximity will signal an oversold condition so we will go for a counter-trend long trade with the target being at 1.600.
Disclosure: I am part of Trade Nation's Influencer program and receive a monthly fee for using their TradingView charts in my analysis.
✅LIKE AND COMMENT MY IDEAS✅
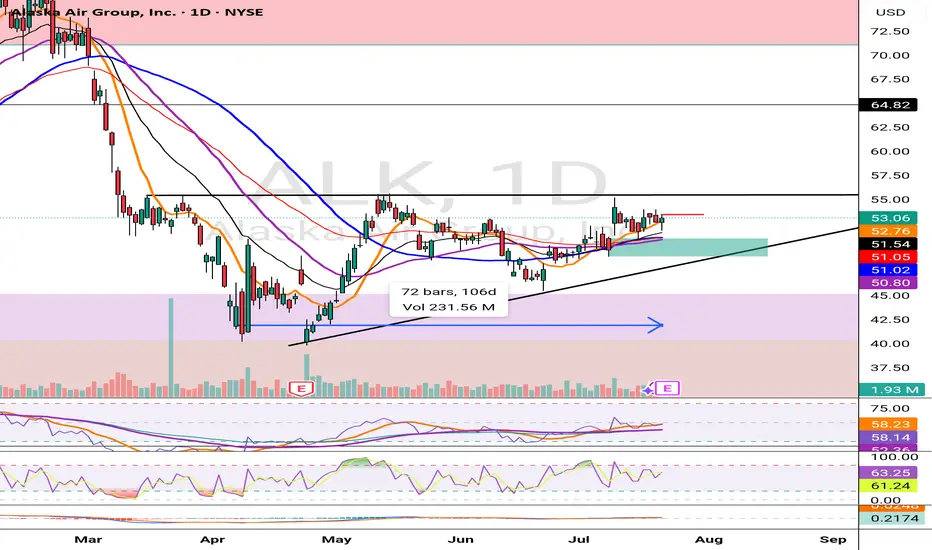
ALK LOOKING BULLISH 22 JULY 2025ALK is looking good to go long at current price. I am going long as it looks very good. If you dont understand a trade then don't push yourself.
NOTE: LONG WITH STOCKS ONLY
bch buy midterm"🌟 Welcome to Golden Candle! 🌟
We're a team of 📈 passionate traders 📉 who love sharing our 🔍 technical analysis insights 🔎 with the TradingView community. 🌎
Our goal is to provide 💡 valuable perspectives 💡 on market trends and patterns, but 🚫 please note that our analyses are not intended as buy or sell recommendations. 🚫
Instead, they reflect our own 💭 personal attitudes and thoughts. 💭
Follow along and 📚 learn 📚 from our analyses! 📊💡"

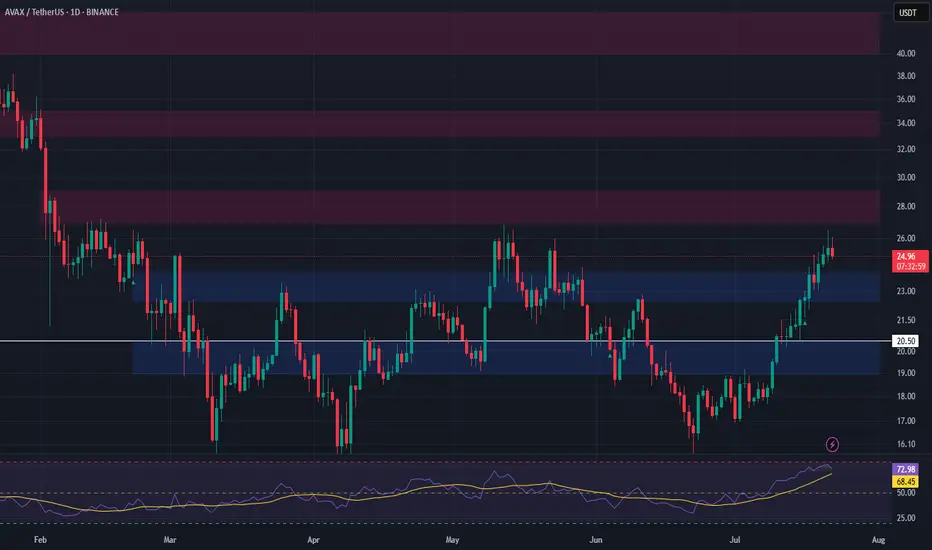
AVAX Long Swing Setup – Waiting for Support RetestAVAX has been rallying for two straight weeks, showing strong momentum. We’re watching for a healthy pullback into the $22.50–$24.00 support zone to position for continuation. If this zone holds, the risk/reward setup favors bulls with clear upside targets.
📌 Trade Setup:
• Entry Zone: $22.50 – $24.00
• Take Profit Targets:
o 🥇 $27 – $29
o 🥈 $33 – $35
o 🥉 $40 – $44
• Stop Loss: Daily close below $20.50
THETA Long Swing Setup – Accumulation Phase Near BreakoutTHETA is still consolidating in a range, but momentum is quietly building. A break above $1.07 followed by a higher low would confirm structural reversal. We’re eyeing the $0.95–$1.00 zone for a clean entry on retest, offering solid risk-reward if support holds.
📌 Trade Setup:
• Entry Zone: $0.95 – $1.00
• Take Profit Targets:
o 🥇 $1.60 – $1.70
o 🥈 $2.10 – $2.20
• Stop Loss: Daily close below $0.90

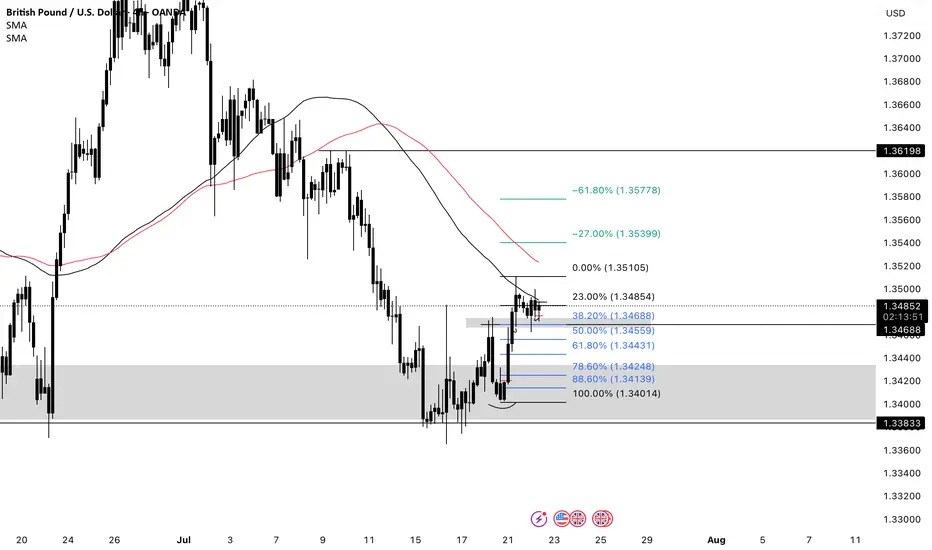
GBPUSD BUYS GU broke the previous LH and formed support. I’m waiting for price to break out of consolidation on the M15 and form more bullish pressure before entering longs towards 1.36200 area.
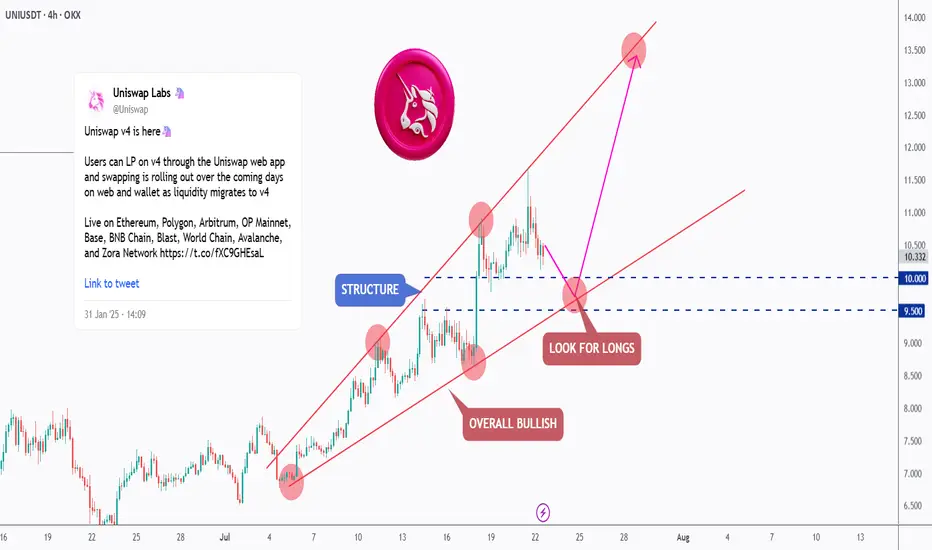
[Deep Dive] UNI – Edition 1: Retest. Reload. Rally?Uniswap (UNI) has been trading within a well-respected rising channel, showing consistent bullish structure across the 4H timeframe.
After a strong rally from the $7.50 region, price is now undergoing a healthy correction — retesting the lower boundary of the channel, which intersects with the $9.50–$10.00 demand zone.
📐 Technical Outlook
The market has printed a series of higher highs and higher lows, confirming the bullish momentum. The recent correction is testing a key support structure — previously a resistance zone — and this confluence aligns perfectly with the channel’s lower bound.
As long as this zone holds, UNI is well-positioned for a continuation toward the $13–$14 region, in line with the pink projected path.
🔥 Fundamental Boost
Uniswap has recently launched its V4 upgrade, introducing "hooks" — customizable smart contracts that allow developers to build more complex DeFi logic directly within liquidity pools. This upgrade not only enhances flexibility and capital efficiency, but also reduces gas costs — making Uniswap an even more dominant player in the DEX ecosystem.
Additionally, with Ethereum L2 adoption growing and Uniswap expanding across multiple chains (Arbitrum, Base, and Optimism), protocol usage and fees are on the rise again.
The UNI token may soon benefit from the proposed fee switch, which would redirect a portion of protocol fees to token holders — potentially adding new value accrual mechanics.
🟢 Conclusion
The technicals and fundamentals are aligning. UNI is in a bullish structure, trading at a key area of interest, and the latest upgrades may unlock new growth for the ecosystem.
Traders and investors alike should keep a close eye on this zone for long opportunities, as the next impulse could be just around the corner.
💬 What do you think — is UNI ready to break toward new highs, or will the demand zone fail? Let me know in the comments 👇
🔔 Disclaimer: This analysis is for educational and informational purposes only. It does not constitute financial advice or a recommendation to buy or sell any asset. Always do your own research and manage your risk accordingly.
📚 Always follow your trading plan => including entry, risk management, and trade execution.
Good luck!
All strategies are good, if managed properly.
~ Richard Nasr
ADA / USDT lying on support ,ready to bounce and break trendlineADA/USDT broke above horizontal resistance and is now retesting from the trendline above. If it holds this support and bounces, a strong move toward $1.00, $1.20, and even $1.40 could follow. One to watch closely in the coming days.