doge buy midterm "🌟 Welcome to Golden Candle! 🌟
We're a team of 📈 passionate traders 📉 who love sharing our 🔍 technical analysis insights 🔎 with the TradingView community. 🌎
Our goal is to provide 💡 valuable perspectives 💡 on market trends and patterns, but 🚫 please note that our analyses are not intended as buy or sell recommendations. 🚫
Instead, they reflect our own 💭 personal attitudes and thoughts. 💭
Follow along and 📚 learn 📚 from our analyses! 📊💡"
Bullish Patterns
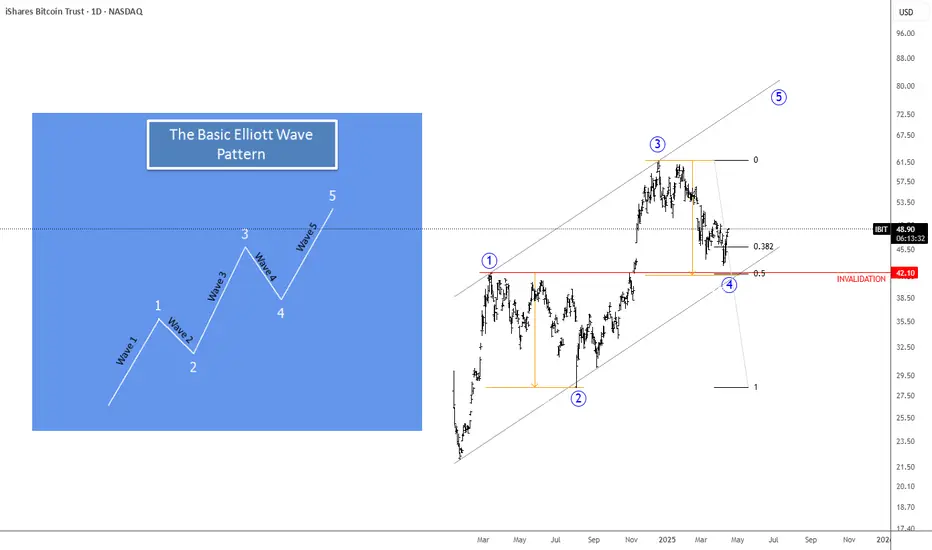
BlackRock's Bitcoin ETF Can Be Unfolding A Bullish ImpulseBlackRock's Bitcoin ETF with ticker IBIT made a massive rally in 2024, which can be wave 3 of an ongoing five-wave bullish impulse. Despite the recent decline at the beginning of 2025, it's still above 42 invalidation level, and as long as it's above that level, it can be wave 4 correction, so we may still see that 5th wave this year.
The Elliott Wave Principle is a form of technical analysis that identifies patterns in market movements. A bullish impulsive wave is one of the most important and common wave structures in an uptrend. It describes how prices typically move in the direction of the main trend. A bullish impulsive wave consists of five waves labeled 1, 2, 3, 4, 5.
Now that we Have our Pullback...Back to BULLISHNESSBeen waiting on this pull back. Now that we got it price should move more reasonably. Looking for the bullish action to continue and new highs to be made.

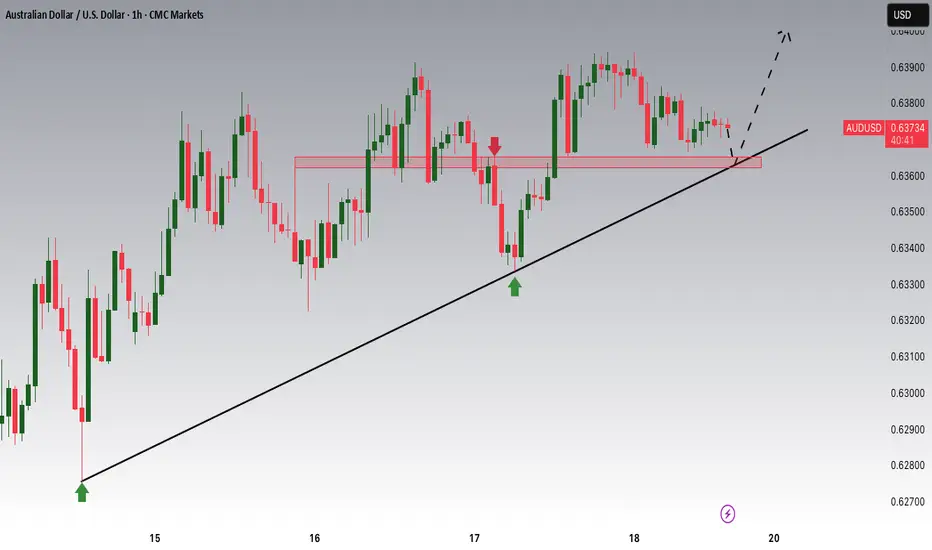
AUDUSD Potential UpsidesHey Traders, in today's trading session we are monitoring AUDUSD for a buying opportunity around 0.63600 zone, AUDUSD is trading in an uptrend and currently is in a correction phase in which it is approaching the trend at trend at 0.63600 support and resistance area.
Trade safe, Joe.
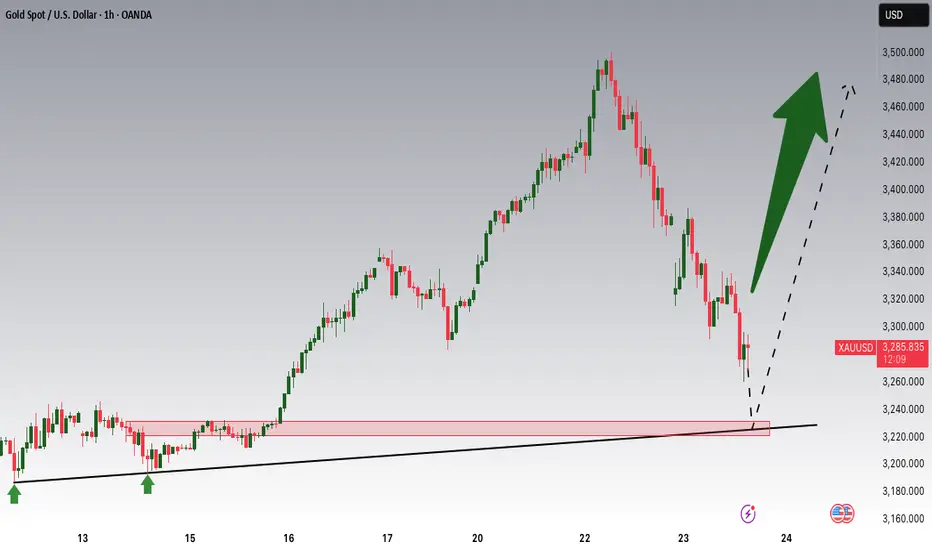
Gold: Correction Before Another ATH?Hey Traders, in today's trading session we are monitoring XAUUSD for a buying opportunity around 3220 zone, Gold is trading in an uptrend and currently is in a correction phase in which it is approaching the trend at 3220 support and resistance area.
Trade safe, Joe.
Crypto Bulls Awaken – Is This Just the Beginning?In the past 48 hours, the crypto market has brought joy to traders and investors who managed to buy near the bottom.
(Sorry to the cryptobros still holding floating losses—your time will come too! 😊)
Some of you might be thinking it's too late to ride this bull run. But if you zoom out and look at the bigger picture, there's still plenty of room for the bull to run.
Just switch to a higher timeframe like the weekly or monthly chart, and you'll see the potential upside.
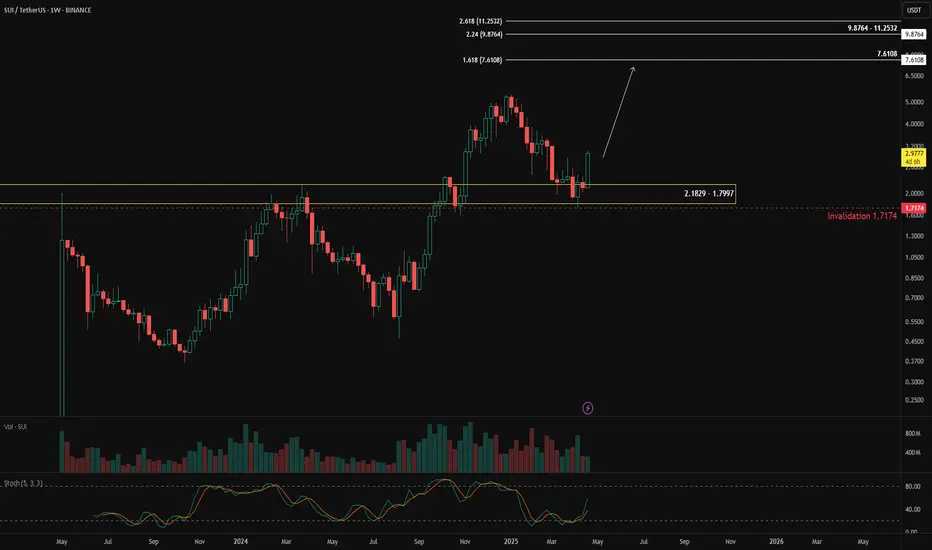
One coin that looks particularly interesting is BINANCE:SUIUSDT .
There's been a pullback from 2.1829 - 1.7997, and it's supported by bullish divergence, suggesting a continuation of the impulsive move with 7.6108 as the first major target.
This bullish scenario remains valid as long as the price holds above 1.7174.
You might be wondering,
" So can I just buy/long BINANCE:SUIUSDT now? "
Not yet.
For a better entry and a more favorable risk-reward ratio, I suggest using the daily chart.
Wait for a pullback, then look for confirmation using candlestick patterns.
(I'll cover those patterns in my next post—stay tuned!)
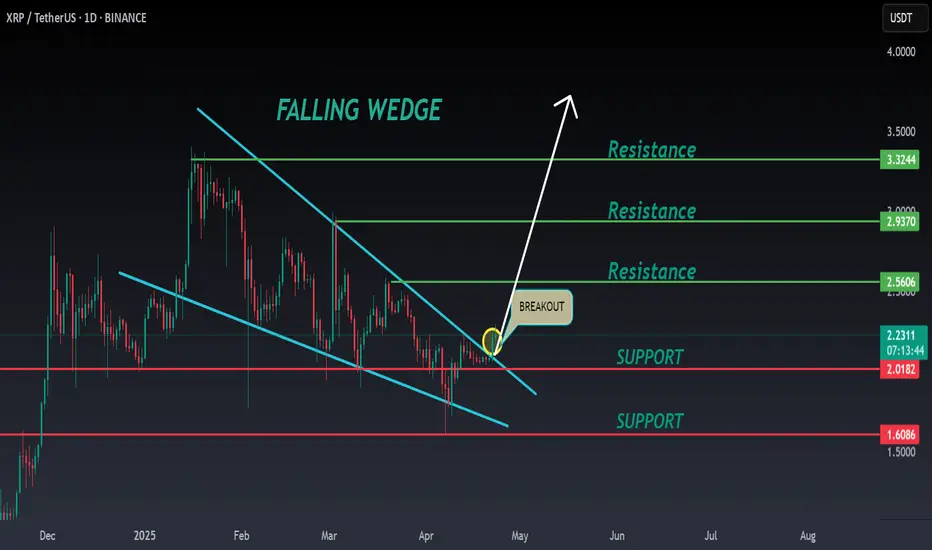
XRP ANALYSIS🚀#XRP Analysis :
🔮As we can see in the chart of #XRP that there is a formation of "Falling Wedge Pattern". In a daily timeframe #XRP broke out the pattern. Expecting a bullish move in few days if #XRP retest the levels
⚡️What to do ?
👀Keep an eye on #XRP price action. We can trade according to the chart and make some profits⚡️⚡️
#XRP #Cryptocurrency #TechnicalAnalysis #DYOR
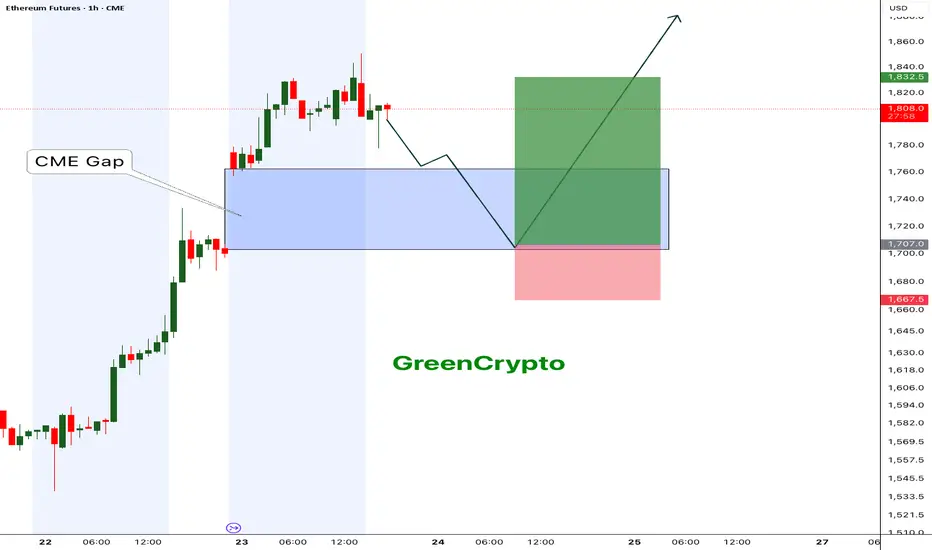
Ethereum - CME Gap fill before going up ?Ethereum has formed a classic CME Gap between $1,707 and $1,765, following a strong breakout. CME gaps, especially over the weekend, are statistically likely to be filled before the next major move.
We’re watching for a retest of this gap zone with a potential bounce at the lower boundary, creating a solid long entry opportunity.
Entry: 1,710–1,725 (inside the CME gap)
TP1: 1760
TP2: 1800
TP3: 1900
SL: 1,667 (below gap & invalidation of bullish structure)
Like and support us for more such idea.
Cheers
GreenCrypto
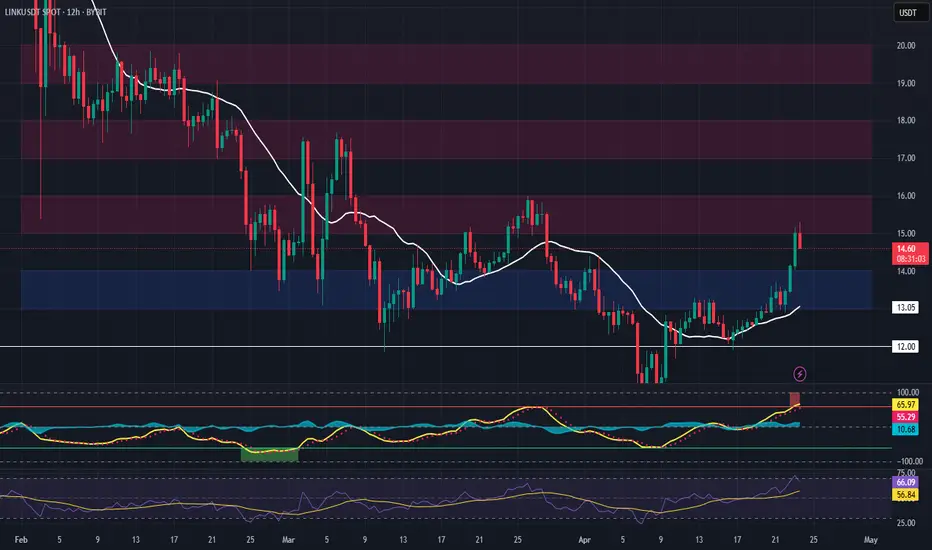
LINK Trade Setup – Pullback to SupportLINK has made a solid move from ~$10 to $15 over the past couple of weeks. With that rally showing signs of slowing, a pullback into support presents a potential opportunity to catch the next leg up.
📍 Entry Zone:
$13.00 – $14.00
🎯 Take Profit Targets:
🥇 $15.00 – $16.00
🥈 $17.00 – $18.00
🥉 $19.50 – $20.50
🛑 Stop Loss:
Just below $12.00
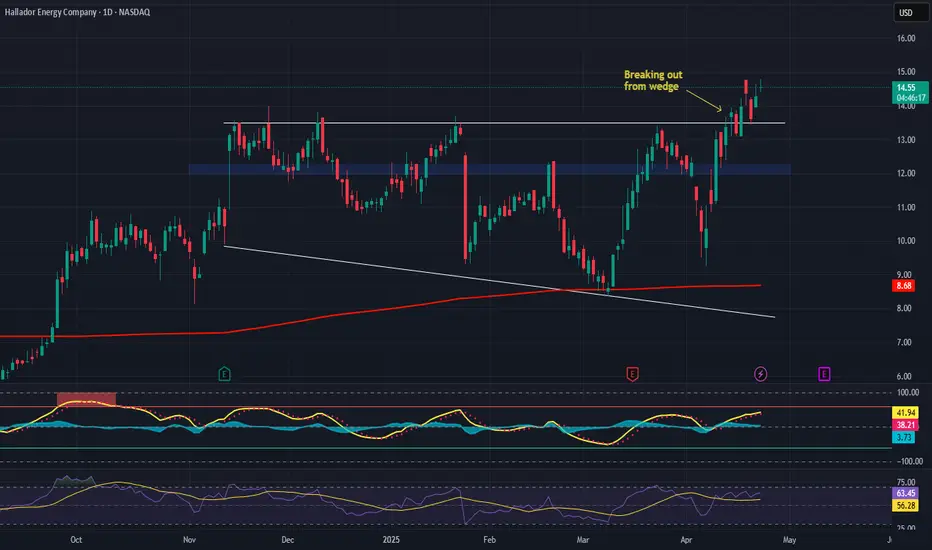
Hallador Energy Company (HNRG) – Vertically Integrated PowerhousCompany Snapshot:
Hallador Energy NASDAQ:HNRG is redefining resilience in the energy sector with its fully integrated model, controlling both fuel supply and power generation. In today’s volatile energy landscape, this structure provides exceptional cost control and long-term strategic advantages.
Key Catalysts:
Vertically Integrated Model = Margin Power 💰
Manages ~90% of variable costs
Insulated from commodity price swings
Scales profitably as energy prices rise
Exclusive Grid Access ⚙️
Owns generator interconnection assets
Guarantees locked-in grid access—a rare competitive advantage
Strong positioning in a tight, regulated market
Revenue Visibility 💼
~$1.6B forward-contracted sales backlog
Ensures predictable cash flow and capital flexibility
Enables debt paydown, reinvestment, or shareholder returns
Tailwinds from Energy Demand 📈
U.S. power demand rising from AI/data centers, electrification
HNRG is well-positioned to benefit from stable base-load energy needs
Investment Outlook:
✅ Bullish Above: $12.00–$12.25
🚀 Target Range: $22.00–$23.00
🔑 Thesis: Structural cost control + grid access moat + revenue certainty = powerful upside potential
📢 HNRG: A rare energy stock with stability, growth, and moat strength.
#EnergyStocks #GridInfrastructure #PowerGeneration #HNRG #CashFlowStrong #ValuePlay
NZDCHF - Important Breakout !Hello Traders !
The NZDCHF failed to create a new lower low !
The price broke the resistance level (0.48828 - 0.48553).
This key level becomes new support !
So, I expect a bullish move🚀
______________
TARGET: 0.49420🎯

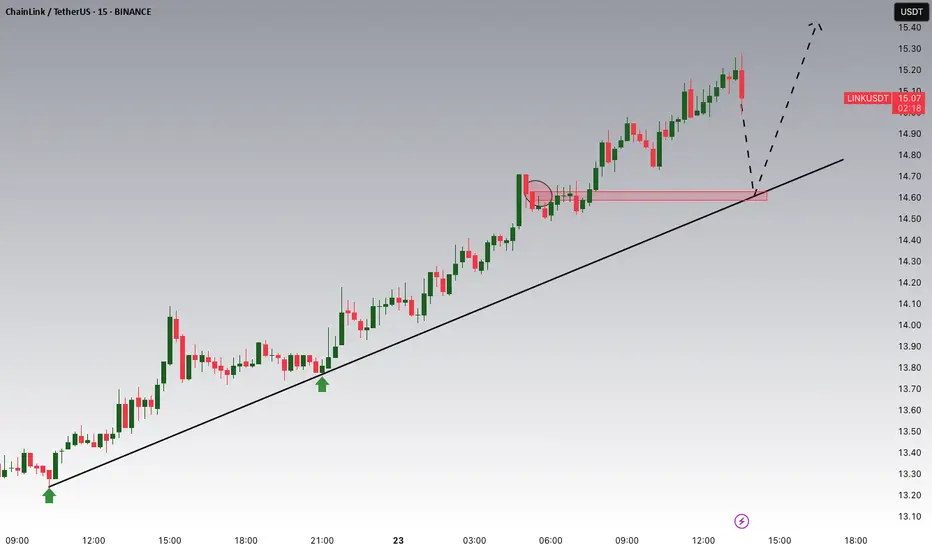
LINK/USDT Potential UpsidesHey Traders, in today's trading session we are monitoring LINK for a buying opportunity around 14.6 zone, LINK/USDT is trading in an uptrend and currently is in a correction phase in which it is approaching the trend at 14.6 support and resistance area.
Trade safe, Joe.
ADA 1-Year EMA Reclaim and Reversal (1D)After a double bottom at ~$0.50, BINANCE:ADAUSDT reclaimed the 1-year EMA (red) with a ~+9% large bodied daily candle, potentially shifting back to a bullish bias.
Key Levels to Watch
• $0.50-$0.58: Current support, a break below it would invalidate any bullish setup.
• $0.73-$0.77: Current resistance, 0.236 fib extension, HVN, and key S/R in place since February 2022. This is the most crucial level that the bulls need to reclaim.
• $1.10-$1.30: Main supply zone, with significant weekly and daily sell order blocks, plus 0.618 fib extension.
A daily close above above $0.77 would offer a good chance at retesting 2024's highs.

BTC - Bullish Control, Confirmed!Hello TradingView Family / Fellow Traders! This is Richard, also known as theSignalyst.
🚀 As per my last two setups (highlighted on the chart), BTC rejected the $72,000 support and pushed higher with strength.
📈 This week, BTC broke above the $90,000 structure, confirming a shift in momentum from bearish to bullish.
🟢 For the bulls to stay in control, a break above the $95,200 resistance is still needed.
📊 In the meantime, as BTC retests the $89,000–$90,000 zone, we’ll be looking for medium-term trend-following longs to catch the next impulsive move.
📚 Reminder:
Always stick to your trading plan — entry, risk management, and trade management are key.
Good luck, and happy trading!
All Strategies Are Good, If Managed Properly!
~Rich
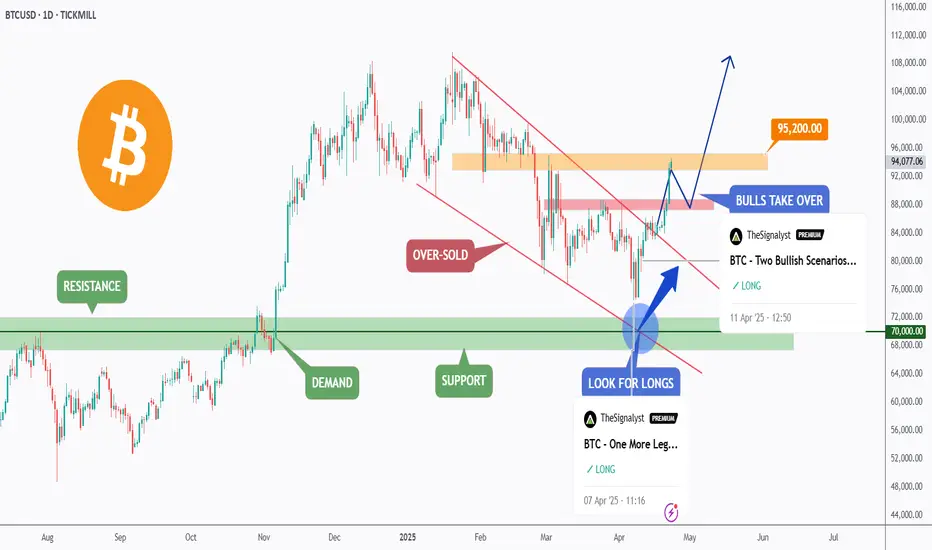
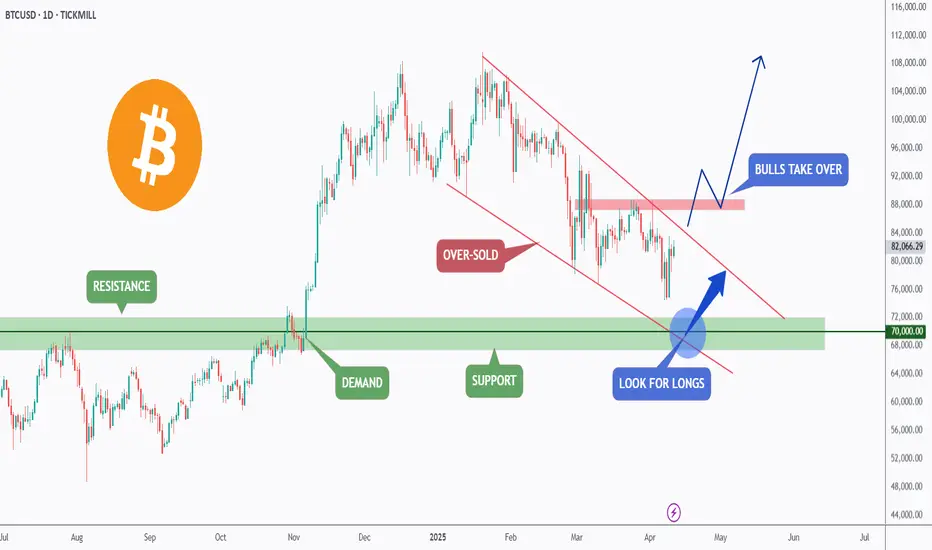
BTC - Two Bullish Scenarios...Hello TradingView Family / Fellow Traders! This is Richard, also known as theSignalyst.
📉 BTC has been overall bearish, trading within the falling channel marked in red.
The $70,000 area is a key confluence zone — it aligns with the lower red trendline, horizontal support, a psychological round number, and a potential demand zone.
📚 According to my trading style:
As #BTC approaches the blue circle zone, I’ll be looking for bullish reversal setups — such as a double bottom pattern, trendline break, and more.
🏹In parallel, for the bulls to take over long-term, and shift the entire trend in their favor, a break above the last major high marked in red at $88,888 is needed!
📚 Reminder:
Always stick to your trading plan — entry, risk management, and trade management are key.
Good luck, and happy trading!
All Strategies Are Good, If Managed Properly!
~Rich
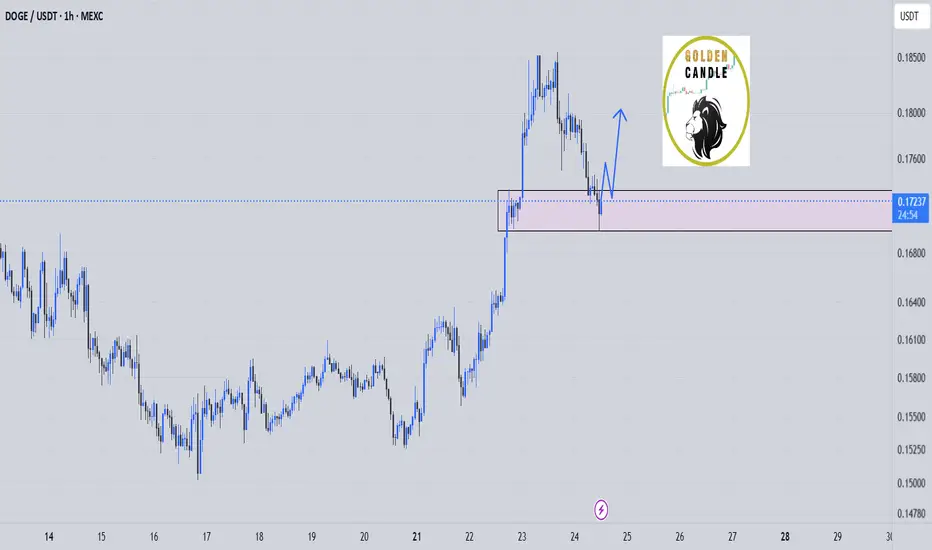
DOGEUSDT - Now (Big Time) Bullish? Top Cryptocurrencies other than Bitcoin have been given a tough wrap over the last decade, pumping and dumping...but is that all about to change?
Significant funds have flowed into popular alt coins over the past few days...Is this in preparation of more sustained gains in popular secondary cryptocurrencies such as DOGE, ADA, LINK etc? Or will alt coins continue with their typical pump and dump style behaviour?
Time will tell...
We have identified a potential opportunity within DOGE over the coming weeks(+), caution as always is warranted.
We're inspired to bring you the latest developments across worldwide markets, helping you look in the right place, at the right time.
Thank you for reading! Stay tuned for further updates, and we look forward to being of service along your trading & investing journey...
Disclaimer: Please note all information contained within this post and all other Bullfinder-official Tradingview content is strictly for informational purposes only and is not intended to be investment advice. Please DYOR & Consult your licensed financial advisors before acting on any information contained within this post.

ETH Bullish Navarro 200 Harmonic Pattern + Key Levels / TargetsHarmonic Structure: Navarro 200
Ethereum's weekly chart showcases a fully formed Navarro 200 pattern, identified by:
• A deep B-to-D leg extension (~1.364) — beyond typical harmonic norms, validating the Navarro classification.
• Precise internal Fibonacci alignments:
- XA retracement to B = ~0.771
- BC extension to D = ~1.364
• Completion of point D in a historical demand area around $1500, indicating a potential reversal zone (PRZ).
This harmonic pattern suggests a bullish reversal scenario, contingent on price holding above the $1500 level.
Demand Zone: $1500–$1600
This green box zone represents a major accumulation range from early 2023:
• High volume support — confirmed by prior consolidations.
• On-chain data supports this as a major ETH acquisition zone (1.5M+ ETH bought).
• Current bounce from this area following a liquidity sweep reaffirms it as a strong demand base.
Failure to hold this zone could invalidate the bullish harmonic setup.
Target Zones (Based on Navarro 200 Mechanics)
• T1: $2100–$2200
- Historically significant support-turned-resistance.
- Converges with structural highs and prior breakdown area from mid-2024.
- First logical profit-taking or reaction point following a D-point reversal.
• Mid-Zone: ~$2800
Though not labeled as a target, this is a key supply region to monitor:
- Past consolidations and price rejection.
- Mid-range of the overall pattern.
- Also aligns with prior bullish support in 2024 that flipped to resistance.
• T2: $4000–$4100
- Strong weekly supply zone marked in red.
- Aligns with point C of the pattern.
- Also a psychological barrier near the previous all-time high area ($4,868).
- Likely to see heavy resistance if price rallies that far.
Risks to Watch
• Failure to hold the $1500–$1600 demand zone could send ETH into deeper retracement.

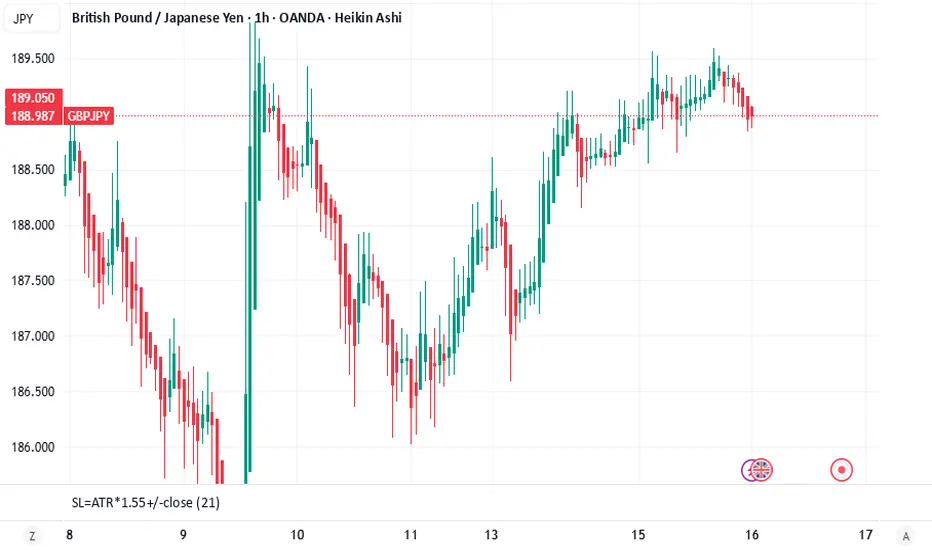
GBPJPY IS A BUY (Britsh Pound-CPI News)TP: 190.00+
SL: 187.00
There is support forming for GBPJPY, which we could be looking for a buying opportunity. We have CPI news for the British Pound Dollar that could make this possible on Wednesday.
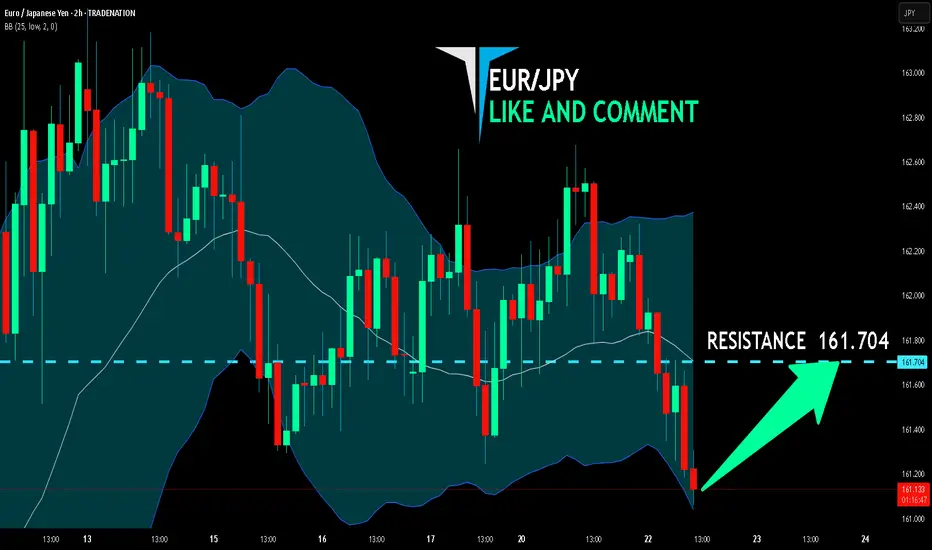
EUR/JPY BULLS WILL DOMINATE THE MARKET|LONG
Hello, Friends!
We are going long on the EUR/JPY with the target of 161.704 level, because the pair is oversold and will soon hit the support line below. We deduced the oversold condition from the price being near to the lower BB band. However, we should use low risk here because the 1W TF is red and gives us a counter-signal.
Disclosure: I am part of Trade Nation's Influencer program and receive a monthly fee for using their TradingView charts in my analysis.
✅LIKE AND COMMENT MY IDEAS✅
SUI - Double Digit is next - Alt season LeaderCorrection of the SUI is over, currently trading around the previous Support zone. i'm expecting this support to hold and bounce back from the support zone.
Once the price breaks from the falling wedge pattern we can expect the bullish momentum to start and hit new all time high.
Entry: after wedge breakout
Target 1: 2.8
Target 2: 3.49
Target 3: 4.5
Target 4: 5.3
Target 5: 6.3
Target 6: 9.2
SL below 1.68
Cheers
GreenCrypto

MKR Falling Wedge Breakout + Target & Key LevelsBINANCE:MKRUSDT just broke out of a 1-year long falling wedge, see 1D zoom below.
Further confirmation would be either:
• Daily retest of the resistance as support
• Weekly close above the resistance
Key Levels to Watch
Aside from the demand zone, these are all potential resistances and good candidates for partial TPs.
• $520-$720: Key demand zone. A break below it would invalidate any bullish setup.
• $1600-$1800: Daily sell order block, and the first resistance to overcome.
• ~$2000: 0.382 fib of the move down, and HVN*.
• $2300-$2400: 0.5 fib of the move down, daily sell order block and previous support
• ~$2800: 0.618 fib of the move down, and HVN*.
• $3800-$4000: Daily sell order block, and 2024 high.
The falling wedge measured target is $3700 .
* HVN = High Volume Node

TESLA 22 APRIL 2025This is my analysis for Tesla irrespective of its earnings. If yoiu have any doubts feel free to leave a txt.
I am long with proper RR & risk management

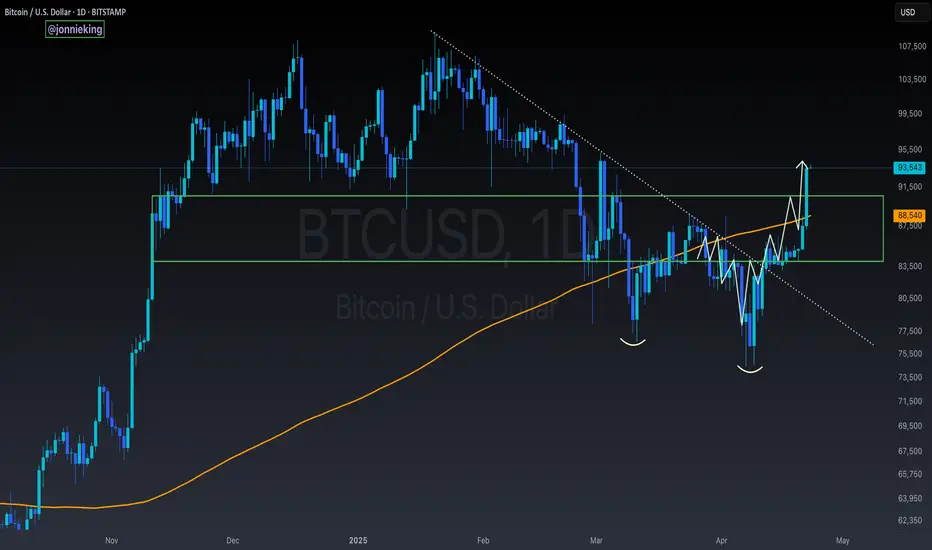
$BTC Closes Above the 200DMAPretty crazy how accurate ₿itcoin PA follows my squiggles, eh? 🤓
CRYPTOCAP:BTC has Closed above the 200DMA with a massive 25% rally over the past two weeks.
Next target $100k, but expect a retest of the 200DMA ~$88,5