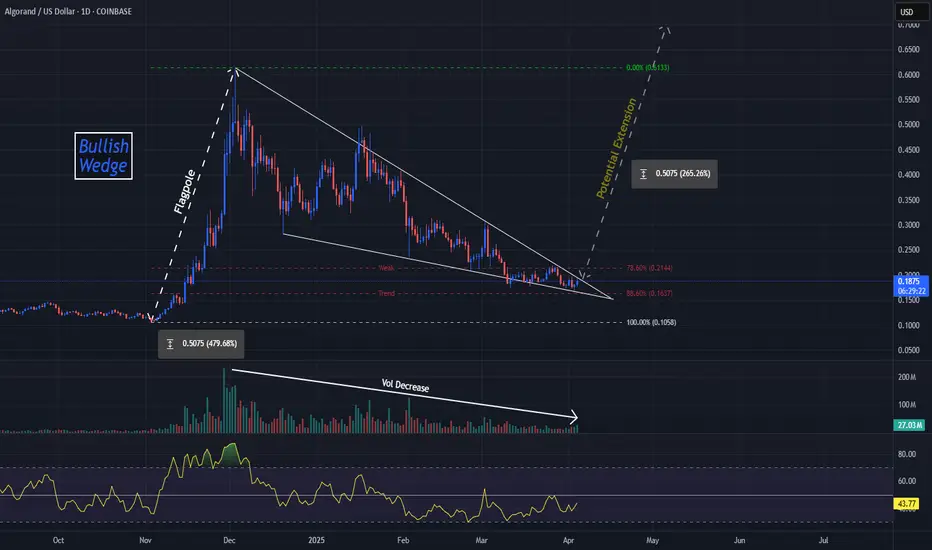
Algorand Consolidation "Pointing" To An End??Here we can see COINBASE:ALGOUSD is about finished forming a Continuation Pattern, the Bullish Wedge!
Price has made an impressive .50 increase since Trump taking office but has slipped into quite a steep Consolidation Phase where Price has made run for the 88.6% Retracement and seems to be filling out the rest of the "Point" of the Wedge!
Accompanying the Chart Pattern is a Decrease in Volume as well, signaling the tight Consolidation could be looking to make a break soon!
*With a True Breakout, we will want to be vigilant of multiple factors coming into play with Increase of Volume to Validate the Break of Pattern!
Once the Pattern is Confirmed and a Breakout Validated, based on the "Flagpole" of the Pattern, we could expect a potential extension of price to go behind the current Swing High of .6133 and up into the .70 area!
Bullish Patterns
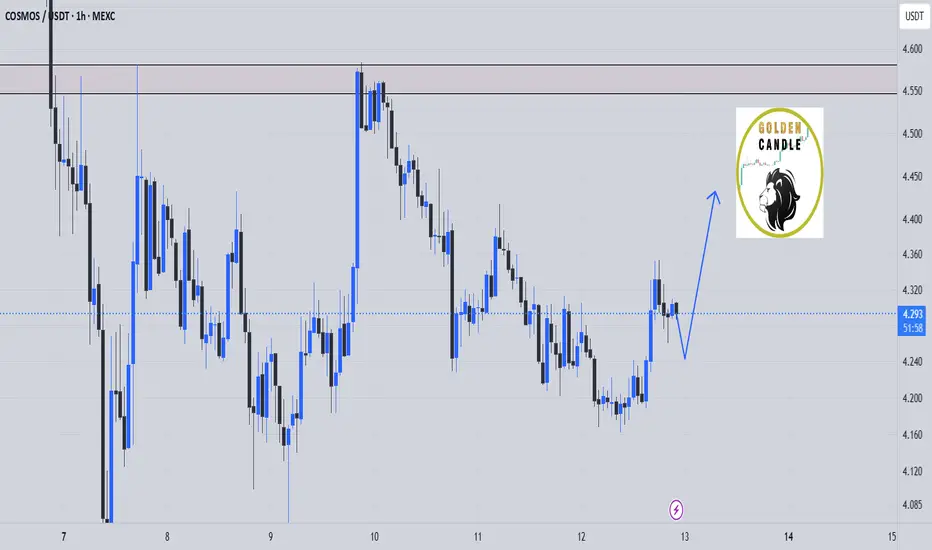
atom buy midterm"🌟 Welcome to Golden Candle! 🌟
We're a team of 📈 passionate traders 📉 who love sharing our 🔍 technical analysis insights 🔎 with the TradingView community. 🌎
Our goal is to provide 💡 valuable perspectives 💡 on market trends and patterns, but 🚫 please note that our analyses are not intended as buy or sell recommendations. 🚫
Instead, they reflect our own 💭 personal attitudes and thoughts. 💭
Follow along and 📚 learn 📚 from our analyses! 📊💡"
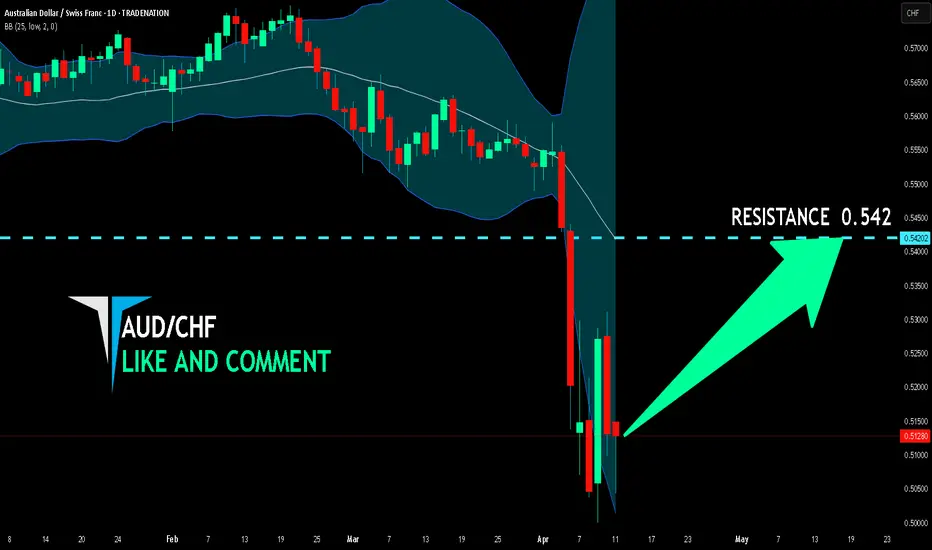
AUD/CHF BULLS WILL DOMINATE THE MARKET|LONG
Hello, Friends!
AUD/CHF is trending up which is obvious from the green colour of the previous weekly candle. However, the price has locally plunged into the oversold territory. Which can be told from its proximity to the BB lower band. Which presents a great trend following opportunity for a long trade from the support line below towards the supply level of 0.542.
Disclosure: I am part of Trade Nation's Influencer program and receive a monthly fee for using their TradingView charts in my analysis.
✅LIKE AND COMMENT MY IDEAS✅
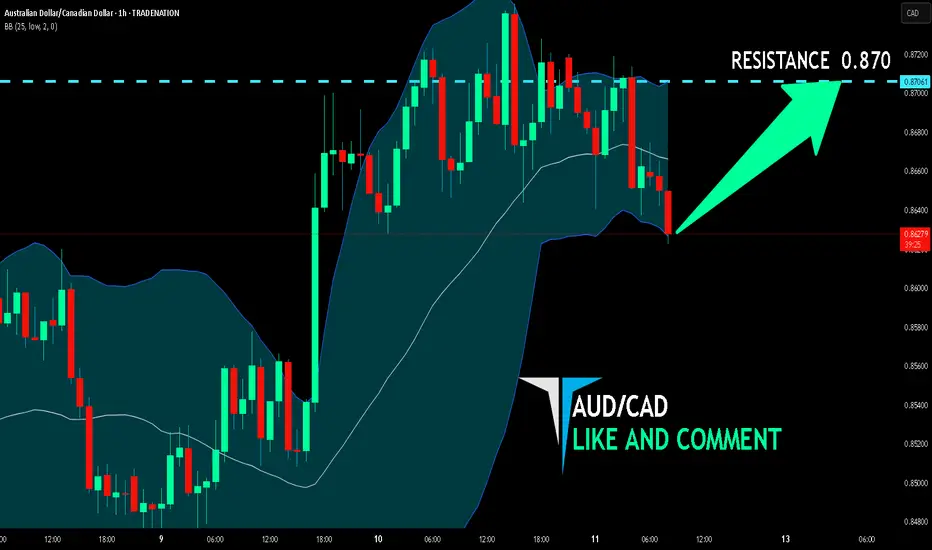
AUD/CAD BUYERS WILL DOMINATE THE MARKET|LONG
Hello, Friends!
AUD/CAD pair is in the uptrend because previous week’s candle is green, while the price is obviously falling on the 1H timeframe. And after the retest of the support line below I believe we will see a move up towards the target above at 0.870 because the pair is oversold due to its proximity to the lower BB band and a bullish correction is likely.
Disclosure: I am part of Trade Nation's Influencer program and receive a monthly fee for using their TradingView charts in my analysis.
✅LIKE AND COMMENT MY IDEAS✅
XRP - Two Longs on the Horizon!Hello TradingView Family / Fellow Traders. This is Richard, also known as theSignalyst.
📈 Medium-Term: XRP broke below the $2 support zone last week, shifting the momentum from bullish to bearish.
📍 As it retests the lower bound of the channel — which perfectly intersects with the orange demand zone and the $1.5 round number — I’ll be looking for short-term longs.
🚀 For the bulls to take over in the long term and kick off the next bullish phase, a breakout above the red structure at $2.15 is needed.
Which scenario do you think will happen first — and why?
📚 Always follow your trading plan regarding entry, risk management, and trade management.
Good luck!
All Strategies Are Good; If Managed Properly!
~Rich

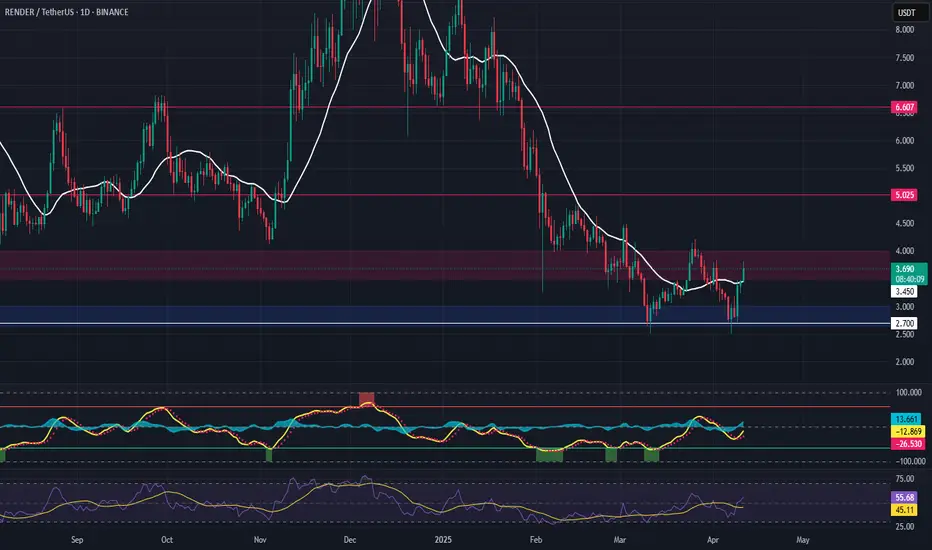
RNDR Long Swing Setup – Double Bottom at Key SupportRNDR has formed a textbook double bottom at the $3.00 high-timeframe support, hinting at a potential trend reversal. The strong bounce off that level shows bullish intent, and we’re now eyeing the $3.50–$4.00 zone for a potential throwback entry, turning old resistance into new support.
📌 Trade Setup:
Entry Zone: $3.50 – $4.00
Take Profit Targets:
🥇 $5.25
🥈 $6.60
Stop Loss: Daily close below $2.70
XPeng Inc. (XPEV) – Driving the Smart EV Revolution Company Snapshot:
XPeng NYSE:XPEV is solidifying its status as a smart electric vehicle pioneer, blending cutting-edge AI, proprietary battery tech, and global expansion to challenge the status quo in EV innovation.
Key Catalysts:
Product Innovation 🚀
New 2025 G6 & G9 feature 5C fast-charging AI batteries
Turing-powered autonomous driving is among the most advanced in China
XNGP smart driving system reaches 86% active user penetration across cities
AI-Defined Vehicles 🤖
Launch of XPENG P7+, an AI-enhanced EV with futuristic user interfaces
Showcases XPeng’s edge in machine learning + mobility
Global Expansion 🌍
Entering UK, Indonesia, and Switzerland, boosting brand recognition & revenue diversification
Creates strategic foothold in key international EV markets
First-Mover Advantage 🔧
One of the few companies to integrate full-stack smart driving + proprietary battery tech
Strong R&D focus (40% of workforce) keeps XPeng at the forefront of next-gen mobility
Investment Outlook:
✅ Bullish Above: $17.50–$18.00
🚀 Upside Target: $25.00–$26.00
📈 Growth Drivers: Global footprint, AI-defined mobility, and rising EV adoption
⚡ XPeng – The AI brain behind tomorrow’s drive. #XPEV #EVInnovation #AIOnWheels

Weekly Closing above 290 - 291 is very positive.Weekly Closing above 290 - 291 is very positive.
Monthly Closing should not go below 263.
284 - 298 is actually a Very Strong Support.
Resistance as of now is around 340 and then 360.

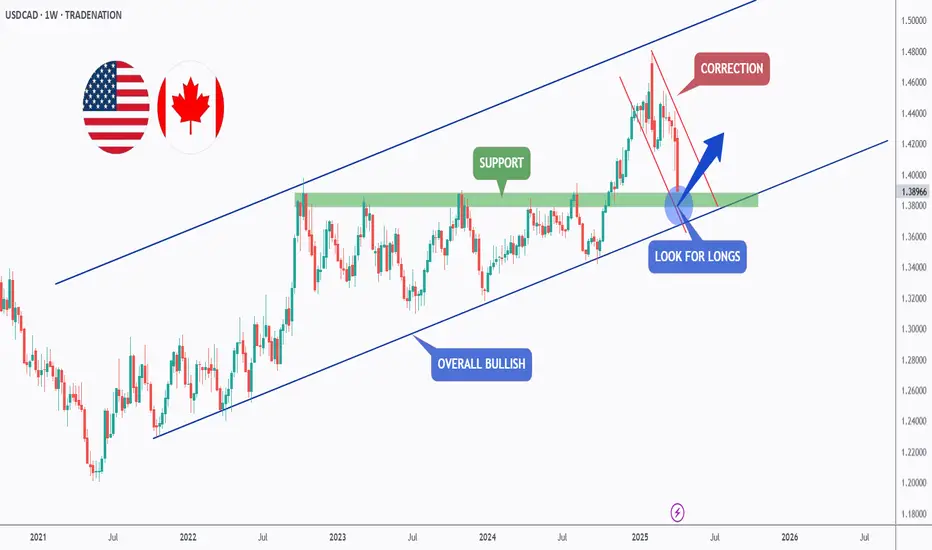
USDCAD - Long-Term Long!Hello TradingView Family / Fellow Traders. This is Richard, also known as theSignalyst.
📈USDCAD has been overall bullish from a macro perspective trading within the rising blue channel.
This week, USDCAD has been in a correction phase trading within the falling red channel.
Moreover, the green zone is a strong resistance turned support.
🏹 Thus, the highlighted blue circle is a strong area to look for buy setups as it is the intersection of support and lower red/blue trendlines acting non-horizontal support.
📚 As per my trading style:
As #USDCAD approaches the blue circle zone, I will be looking for bullish reversal setups (like a double bottom pattern, trendline break , and so on...)
📚 Always follow your trading plan regarding entry, risk management, and trade management.
Good luck!
All Strategies Are Good; If Managed Properly!
~Rich
Disclosure: I am part of Trade Nation's Influencer program and receive a monthly fee for using their TradingView charts in my analysis.
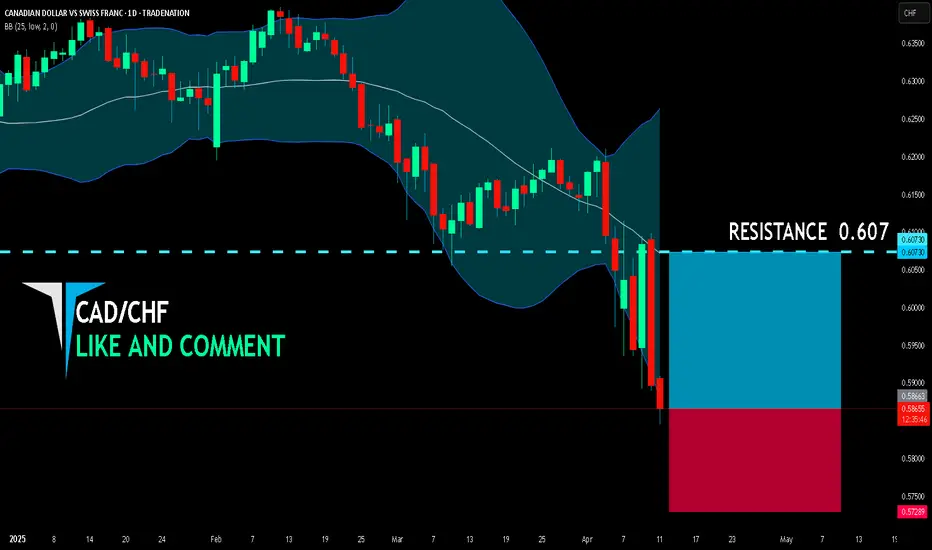
CAD/CHF BULLS ARE GAINING STRENGTH|LONG
CAD/CHF SIGNAL
Trade Direction: long
Entry Level: 0.586
Target Level: 0.607
Stop Loss: 0.572
RISK PROFILE
Risk level: medium
Suggested risk: 1%
Timeframe: 1D
Disclosure: I am part of Trade Nation's Influencer program and receive a monthly fee for using their TradingView charts in my analysis.
✅LIKE AND COMMENT MY IDEAS✅
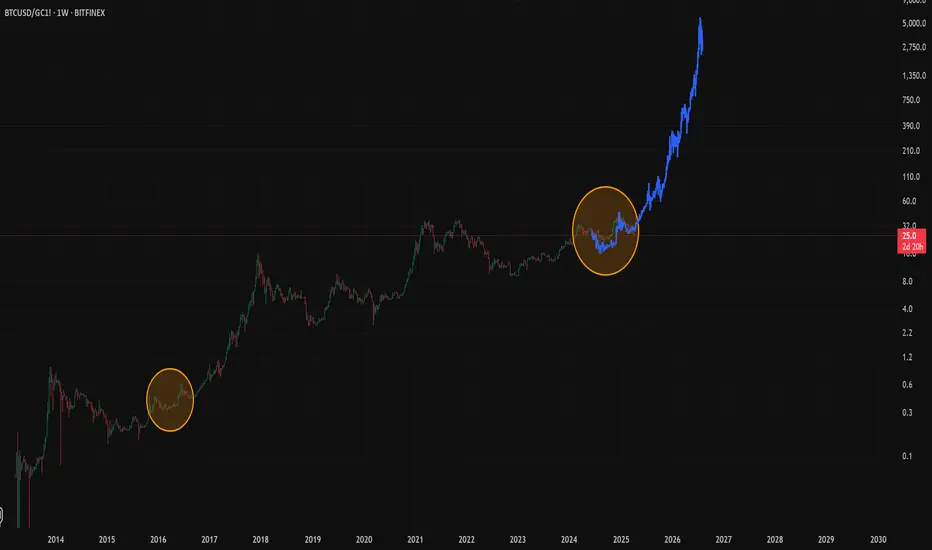
TC/GOLD: Could 1 BTC Reach 6,000 oz of Gold by 2027 ($19.2M US)The chart tracks Bitcoin (BTC) priced in ounces of gold (oz) on a logarithmic scale, revealing its historical growth and a speculative projection. As of April 2025, 1 BTC equals approximately 25 oz of gold, which translates to $80,000 per BTC at an implied gold price of $3,200/oz (derived from the projection).
The chart forecasts a dramatic rise to 6,000 oz of gold by 2027, a 240x increase from the current level. At $3,200/oz for gold, this would value 1 BTC at $19.2M, resulting in a market cap of $378 trillion (19.7M BTC in circulation). Historically, Bitcoin has shown exponential growth, with significant spikes during bull cycles (e.g., 2017-2018 and 2024-2025, as circled). Factors like Bitcoin’s capped supply, post-2024 halving scarcity, and potential for increased adoption as "digital gold" could support such a run.
What are your thoughts? Could Bitcoin achieve this monumental target, or is the projection too optimistic? Let’s discuss!
TL;DR: BTC/GOLD ratio is set to ****ing pump! From 25 oz now to 6,000 oz by 2027—1 BTC could hit $19.2M. Buckle up for a wild ride!
The Yield Curve is NOT InvertedLately I've been seeing a lot of people incorrectly state that the Yield Curve is currently inverted.
IT IS NOT.
Easily measurable 10Y - 2Y.
Google the definition if you need to.
I laid out the impact of the yield curve inverting against the S&P 500.
In most cases, you can see SP:SPX sells off slightly after inverting.
The higher the spread, the healthier the market is.
You want funds buying longer dated securities for market stability and confidence.
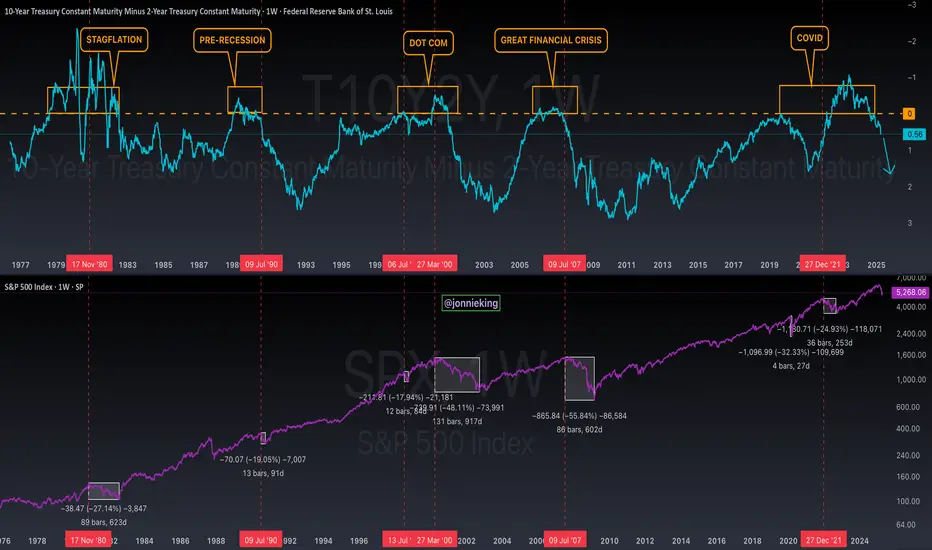
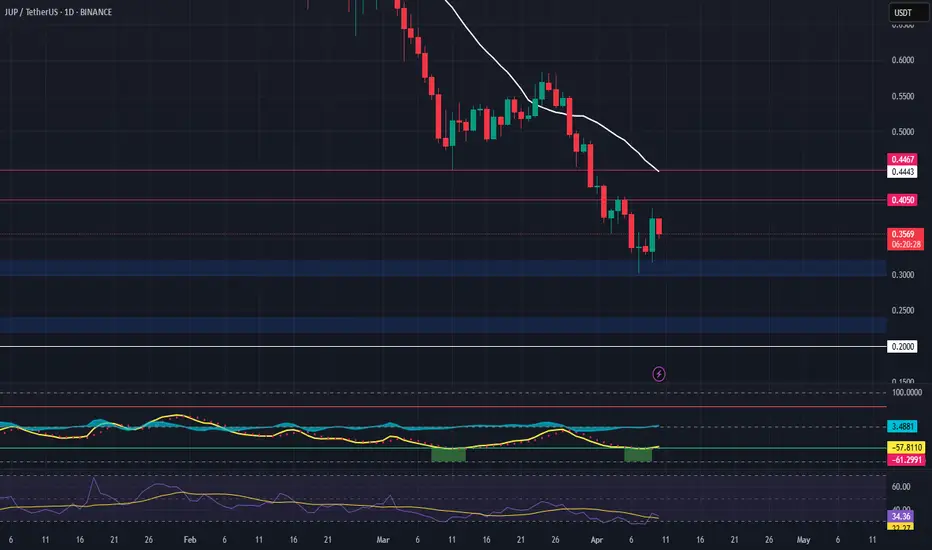
JUP Long Spot Trade Setup – Oversold and Approaching Key SupportJUP is showing strong signs of oversold conditions and is now approaching a major support zone ($0.22 – $0.30). This area offers a favorable risk-to-reward opportunity for a bounce if buyers step in.
📌 Trade Setup:
Entry Zone: $0.22 – $0.30
Take Profit Targets:
🥇 $0.4050
🥈 $0.4467
Stop Loss: Just below $0.20
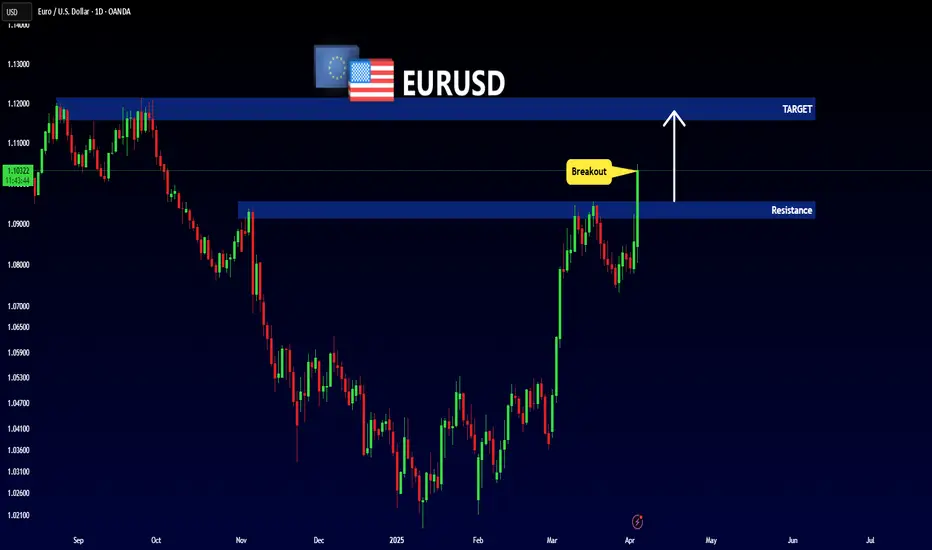
EURUSD - NEW BREAKOUTHello Traders !
The EURUSD price broke the resistance level (1.09548 - 1.09150).
This key level becomes new support !
So, I expect a bullish move🚀
_______________
TARGET: 1.11580🎯
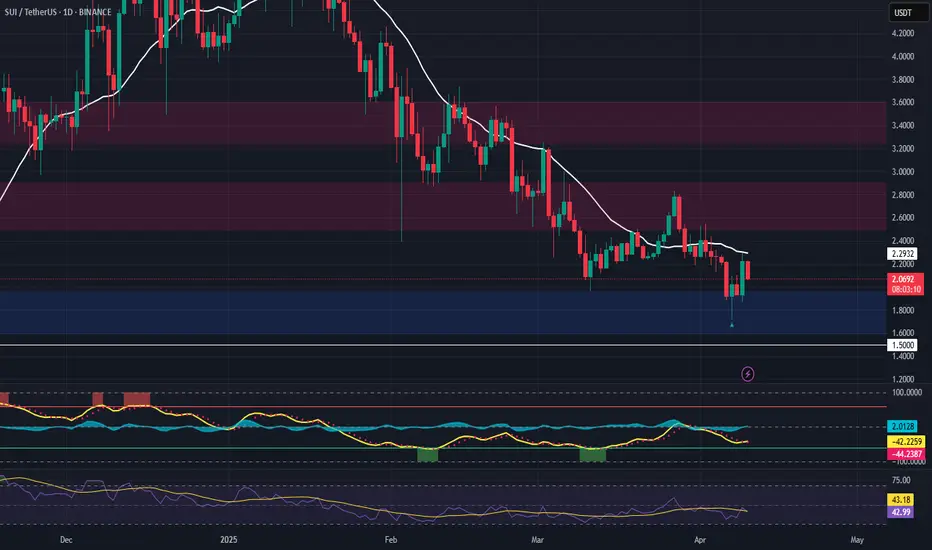
SUI Long Spot Trade Setup – Oversold Bounce PotentialSUI has dropped into a key support zone ($1.60 – $1.96) after an extended selloff. The price is showing oversold conditions, making this a potentially high-reward setup if a bounce confirms from this zone.
📌 Trade Setup:
Entry Zone: $1.60 – $1.96
Take Profit Targets:
🥇 $2.50 – $2.90
🥈 $3.25 – $3.60
Stop Loss: Just below $1.50
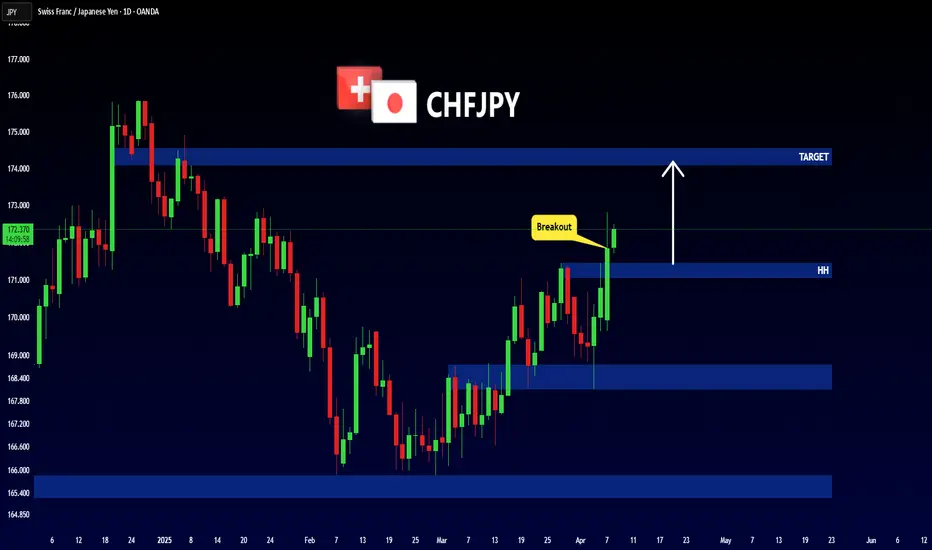
CHFJPY - Important Breakout !Hello Traders !
The CHFJPY failed to create a new lower low !
Currently, The higher high is broken (Break of structure).
So, I expect a bullish move📉
______________
TARGET: 174.100🎯
RSR/USDT: FALLING WEDGE BREAKOUT! 100%+ PROFIT POTENTIAL!!🚀 Hey Traders! RSR Breakout Alert – 100%+ Rally Incoming? 👀🔥
If you’re hyped for big moves and real alpha, smash that 👍 and hit Follow for high-accuracy trade setups that actually deliver! 💹🚀
RSR has just broken out of a falling wedge structure on the daily timeframe—a powerful bullish pattern. The chart’s signaling a potential 100–150% upside move if momentum picks up from here. 📈
📍 Entry Zone: CMP – Add more on dips down to $0.0066
🎯 Target: 100%–150% upside
🛑 Stop-Loss: $0.0054
📊 Trade Plan:
✅ Buy from current levels
✅ Add on dips near breakout support
✅ Ride the breakout wave with tight risk control!
💬 What’s Your Take?
Are you riding this RSR breakout or waiting on confirmation? Drop your thoughts and targets in the comments—let’s ride this wave together! 💰🔥

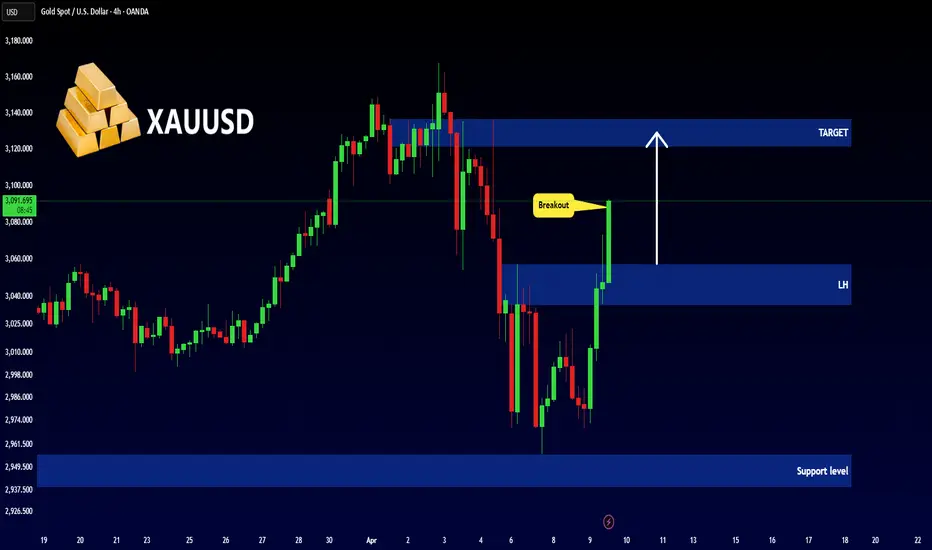
GOLD - NEW BREAKOUT !Hello Traders !
The Gold price failed to create a new lower low !
Currently, The lower high is broken (change of character).
So, I expect a bullish move🚀
______________
TARGET: 3122🎯
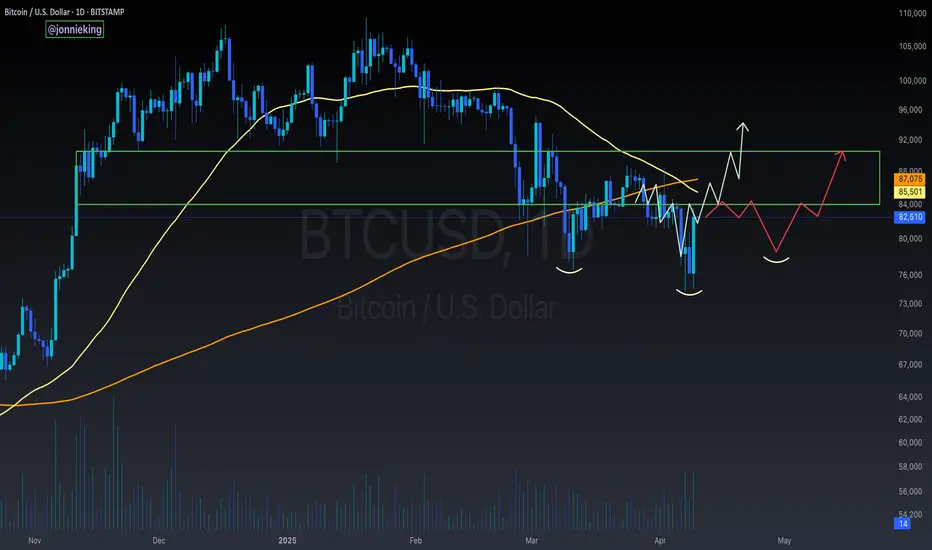
$BTC Not Out Of The Weeds Yet - Must Break $84kIf CRYPTOCAP:BTC can break back above ~$84k then we could continue to follow my OG setup (yellow) and rip,
but since PA dumped slightly below the 50WMA it technically invalidated my inverse h & s idea.
A rejection of $84k would dump us back to ~$78k to form the right shoulder (red) and complete the setup.
nonetheless, i believe we've seen the bottom 👋
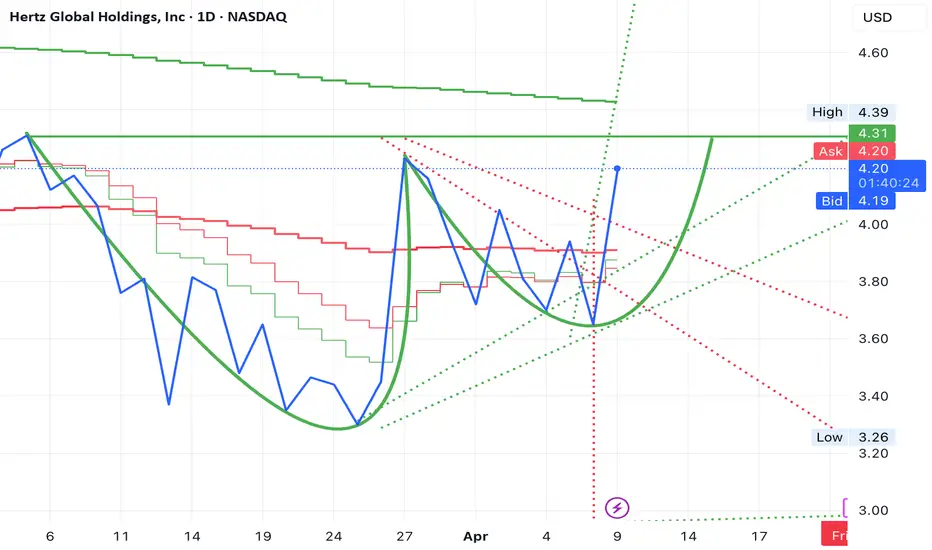
HAPPENING NOW?! HERTZ CUP AND HANDLE BREAKOUT 1D CHART?HERTZ (HTZ) Price rose significantly to $4.26 on the 1 Day chart. Is this a sign of an impending bullish breakout? My personal target opinion for bullish movement is $5.50. Will this be a major bullish turning point for Hertz? Or will it be a easy grab for traders running short positions?
BTC UPDATE: Flash Crash? Or Bullish Retest?🚀 Hey Traders! 👋
If you’re enjoying this analysis, smash that 👍 and hit Follow for high-accuracy trade setups that actually deliver! 💹🔥
📉 BTC just dropped nearly $10K in a single day, sliding from $84K to $74K amidst growing tariff tensions and broader market turmoil.
But here’s the bullish twist—this dump might just be a healthy retest.
BTC recently broke out of a strong inverse head & shoulders pattern, and what we’re seeing now looks like a classic neckline retest.
📌 Key Support: $72K
As long as BTC holds above this level, there’s no reason to panic. Once the dust settles from this bloody Monday, momentum could shift back to the upside.
🟢 This could be a golden accumulation zone—low risk, high potential reward.
❌ Invalidation Level: Weekly close below $72K
💬 What’s Your Take?
Will BTC bounce from this level, or is there more downside ahead? Drop your analysis and predictions below—let’s navigate this together and secure those gains! 💰🔥🚀

Monster Beverage Corp (MNST) – Energizing Global GrowthCompany Snapshot:
Monster NASDAQ:MNST continues to dominate the $60B+ global energy drink market, expanding across 159 countries with a diverse portfolio and strong executive leadership.
Key Catalysts:
Global Market Expansion 🌐
Strategic brands like Predator and Fury targeting emerging markets
New geographies = incremental revenue & brand exposure
Category Leadership & Diversification 🥤
Strong lineup: Monster Energy®, Reign®, Bang®, Java Monster®, NOS®
Broad consumer appeal → fuels market share gains in both premium & value tiers
Industry Tailwinds 📊
Energy drink market projected to grow at 7.6% CAGR (2025–2029)
Monster well-positioned with affordable, recognizable, and global brands
Leadership & ESG Strength 💼💚
Longtime Co-CEOs Rodney Sacks & Hilton Schlosberg driving global strategy
Involvement in charitable events reinforces brand goodwill and consumer trust
Investment Outlook:
✅ Bullish Above: $50.00–$51.00
🚀 Upside Target: $75.00–$76.00
📈 Growth Drivers: Emerging market expansion, brand strength, leadership, and rising category demand
⚡️ Monster – Powering growth from the shelf to the streets. #MNST #EnergyDrinks #GlobalLeader

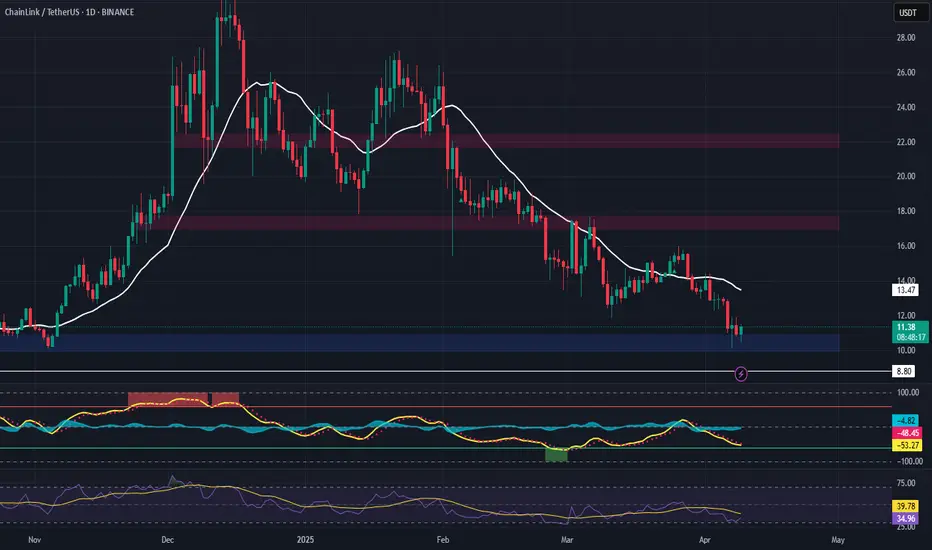
LINK Long Spot Trade Setup – Major Support TestLINK has retraced sharply and is now sitting at a critical support zone ($10.00–$11.00), historically a strong base for reversals. This offers a solid risk/reward opportunity for a potential bounce and test of upper resistance zones.
📌 Trade Setup:
Entry Zone: $10.00 – $11.00
Take Profit Targets:
🥇 $17.00 – $17.70
🥈 $21.70 – $22.40
Stop Loss: Around $8.80