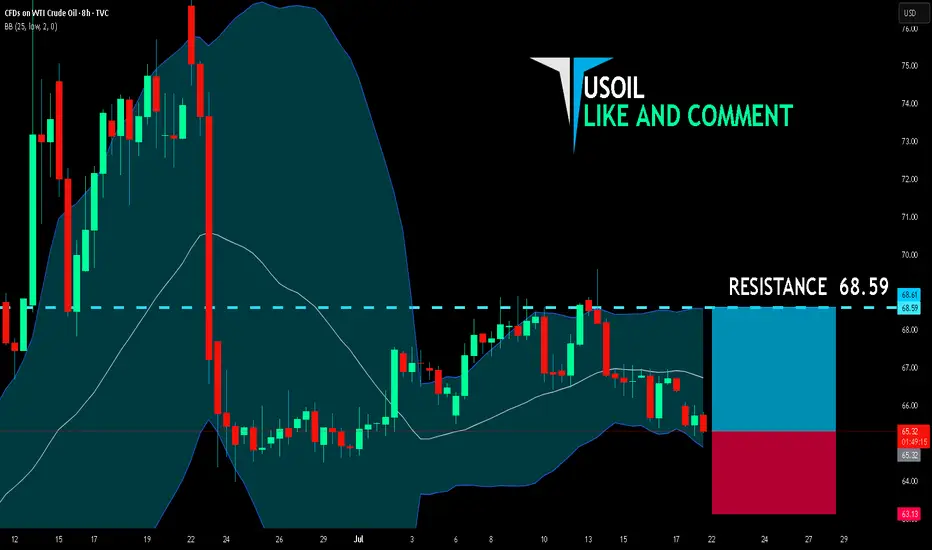
USOIL BULLS ARE STRONG HERE|LONG
USOIL SIGNAL
Trade Direction: long
Entry Level: 65.32
Target Level: 68.59
Stop Loss: 63.13
RISK PROFILE
Risk level: medium
Suggested risk: 1%
Timeframe: 8h
Disclosure: I am part of Trade Nation's Influencer program and receive a monthly fee for using their TradingView charts in my analysis.
✅LIKE AND COMMENT MY IDEAS✅
Bullish Patterns
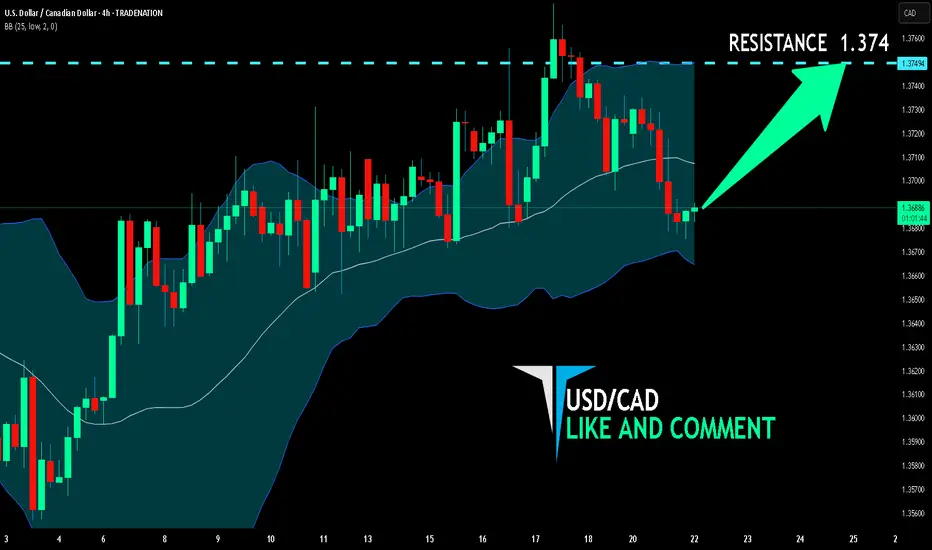
USD/CAD BULLS WILL DOMINATE THE MARKET|LONG
Hello, Friends!
USD/CAD pair is in the uptrend because previous week’s candle is green, while the price is clearly falling on the 4H timeframe. And after the retest of the support line below I believe we will see a move up towards the target above at 1.374 because the pair is oversold due to its proximity to the lower BB band and a bullish correction is likely.
Disclosure: I am part of Trade Nation's Influencer program and receive a monthly fee for using their TradingView charts in my analysis.
✅LIKE AND COMMENT MY IDEAS✅
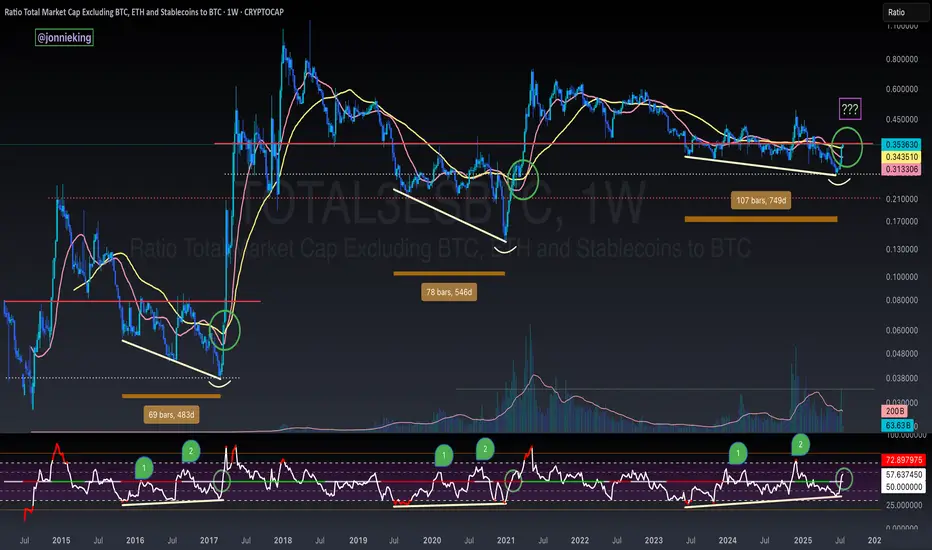
TOTAL3 / BTC - ALT SEASON BREAKOUT - Bullish Divergence SpottedBULLISH DIVERGENCE on CRYPTOCAP:TOTAL3 against CRYPTOCAP:BTC 🏁
You will see every time the RSI passed 50 on the Weekly chart in the post-Halving year it signaled Alt Season 🚀
This coincided with 3 tests of this level at 50, with the 3rd test being the real breakout 🤌🏼
Volume confirms change in trend 🏁
AWAITING CONFIRMATION 🚨
🅾️ Close several Weeks above key neckline resistance (currently here)
🅾️ Bullish Cross on the 20 / 50WMA
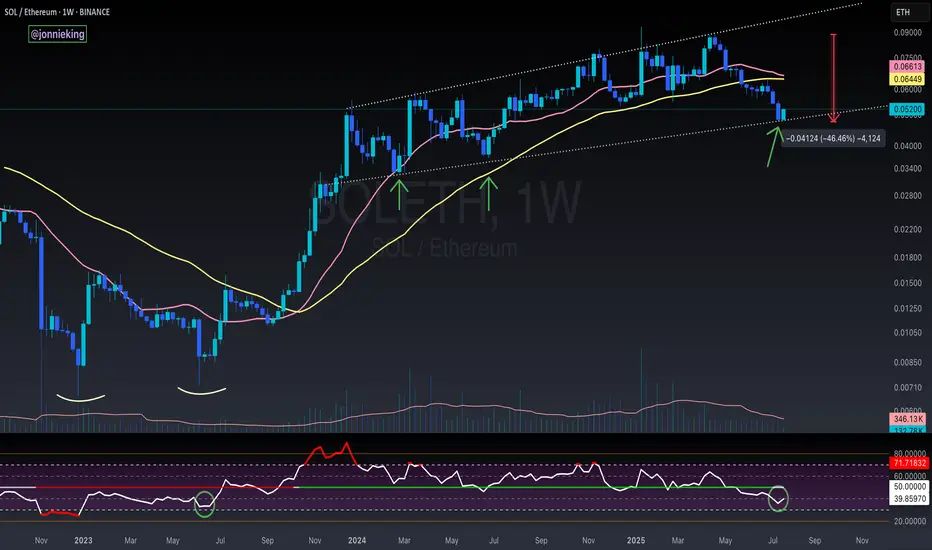
SOL / ETH - Reversal Signs FormingI suspect CRYPTOCAP:ETH has a bit more gas in the tank, but the early signs for the real Alt Season are nearing.
RSI on the weekly is nearing the June 2023 bottom which kicked off the massive bull flag formed on SOL / ETH for the next 2 years.
Still too early to call at this point tho.
Need volume to really burst through in the next week or two.
I’d also like to see BOATS:SOL close the week with a massive bullish engulfing candle.
The bearish cross on the 20 / 50WMA should mark the bottom when it occurs soon.
Ethereum: Breakout Holds Strong | Next Targets $4K, $7K+Last week, three major crypto bills cleared the U.S. House of Representatives—and Ethereum (ETH) is emerging as the biggest winner from this legislative momentum.
ETH recently broke out of a rounding bottom pattern and hasn’t looked back. Momentum continues to build, and it’s now outperforming most other major assets.
📈 Technical Highlights:
✅ Short-term target: $4,000
✅ Long-term potential: $7,000–$8,000
🛡️ Key support: $2,700–$2,800 (bullish as long as this holds)
📣 Takeaway:
Ethereum’s breakout remains intact. Pullbacks into support could offer high-probability setups for swing traders and long-term investors.
#Ethereum #ETHUSD #Crypto #Trading #TechnicalAnalysis #CryptoTrading #EthereumPrice #Altcoins #Bullish #Breakout

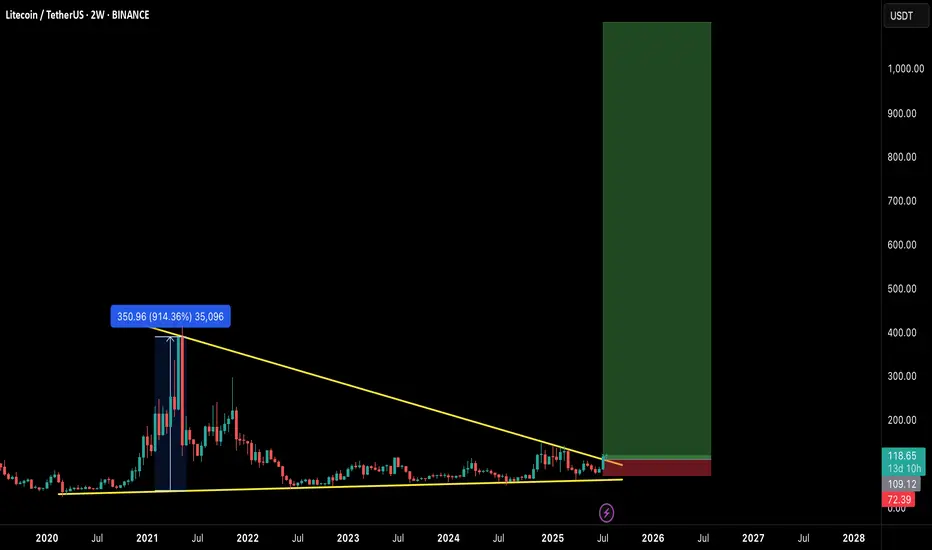
$LTC READY FOR EXPLOSION! THE COMEBACK OF THE OG?Litecoin has quietly formed one of the most massive macro structures in the market — a multi-year falling wedge on the 2-week timeframe, now breaking out with early confirmation.
This could be the start of a generational move, similar to the 2020 breakout. Let's break it down:
🧠 Technical Breakdown:
✅ Falling wedge forming since 2021 — 4 years of compression
✅ Volume and structure support breakout
✅ LTC already gave a 914% rally last time it broke a similar level
📏 Target zone extends above $900–$1000
🛒 Entry Zone:
Current Price: $118
🟢 Buy on breakout or dips near $105–$110 for safer entries
🎯 Target Zones:
TP1: $280
TP2: $400
TP3: $650
TP4: $950+
🛑 Stop-loss:
Breakdown below $72 (last higher low & wedge base)
⚖️ Risk-to-Reward:
High timeframe structure = High conviction play.
Potential R:R > 8x — Rare macro opportunities like this don’t come often.
🧩 Final Thoughts:
LTC may not be the flashiest alt anymore, but this setup is technically undeniable. If BTC enters full bull cycle, LTC could ride the wave explosively.
🔥 This could be a "buy and forget" macro play for 6–12 months.
💬 Let me know your thoughts in the comments & hit that ❤️ if you like macro setups like these!
BUY FIBERGreetings traders, today we are looking for buys on EURUSD. Our first entry is at 1.16288 and second entry will be lower at 1.16046 our target is 1.16854 and stops are below 1.15883. use proper risk management and best of luck.
This trade is based on a fine tuned DAILY approach to the algo. Be careful and risk wisely.

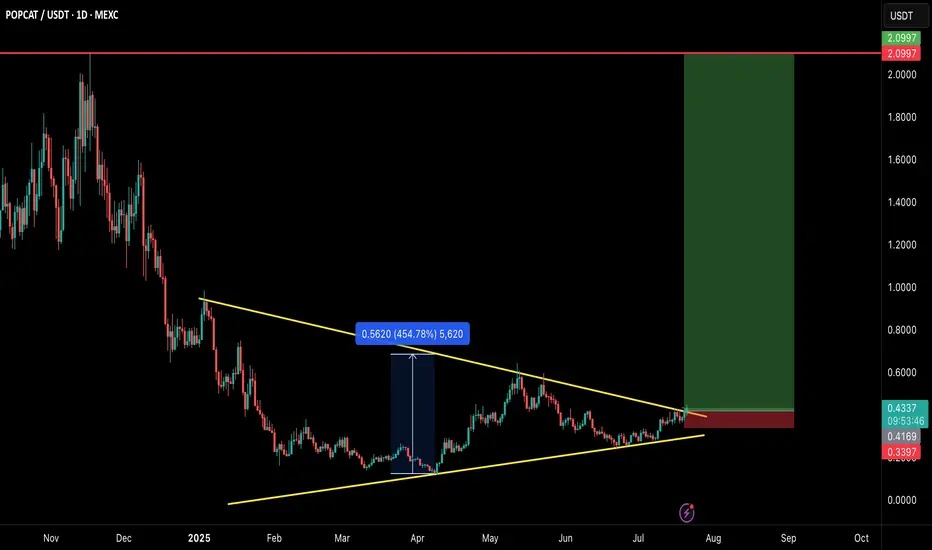
POPCAT/USDT – MEGA BREAKOUT INCOMING!POPCAT is breaking out of a large symmetrical triangle structure that has been developing for several months. This is a textbook bullish reversal setup with explosive potential — and the chart says it all! 👇
🧠 Technical Breakdown:
✅ Clean symmetrical triangle breakout on daily timeframe
🔥 Strong base formation followed by volume breakout
💹 Consolidated above trendline for weeks — breakout looks real
🛒 Entry Zone:
CMP ($0.43) or buy in dips toward $0.40–$0.42
🎯 Targets:
TP1: $0.65
TP2: $1.10
TP3: $1.60
TP4: $2.10
🛑 Stop-loss:
Close below $0.34
📊 Risk/Reward:
Solid RR > 4.0 with high potential if momentum kicks in. Volume and structure both support a strong upside.
📢 Final Thoughts:
This is not just a breakout — it's a multi-month accumulation breakout. If the market stays bullish, POPCAT could go parabolic again just like it did earlier.
🚨 Always use proper risk management and SL!
💬 Drop your thoughts in comments & don’t forget to hit that ❤️ if you find this helpful.
GBP/JPY: A Key Short Setup Forms as Momentum FadesHello traders,
Taking a look at GBP/JPY on the 4-hour timeframe. After a significant run, the price action has stalled, and we're seeing clear signs of fading momentum. This is creating a well-defined consolidation zone, which may present a key opportunity for a short position.
The Technical Picture 📊
1️⃣ Price Consolidation: GBP/JPY is currently trading sideways within a tight range, highlighted on the chart. This period of indecision and balance between buyers and sellers often precedes a significant directional move. The structure suggests a phase of distribution may be underway.
2️⃣ Fading Momentum: The Relative Strength Index (RSI) confirms this loss of momentum. A sustained reading below the 50 midline would signal that sellers are beginning to gain control and that the path of least resistance is shifting to the downside.
The Strategy 🧠
The core idea is to anticipate a bearish breakdown from the identified consolidation zone. A clean break and hold below this range would serve as confirmation that sellers have taken over, providing an opportunity to enter a short position targeting a continuation of the larger bearish move.
Trade Parameters 📉
👉 Entry: 198.895
⛔️ Stop Loss: 201.405
🎯 Take Profit: 192.872
Risk/Reward Ratio: approx. 2.4
This is my personal analysis and perspective, not financial advice. Always conduct your own research and manage your risk accordingly.
Good luck, and trade safe.

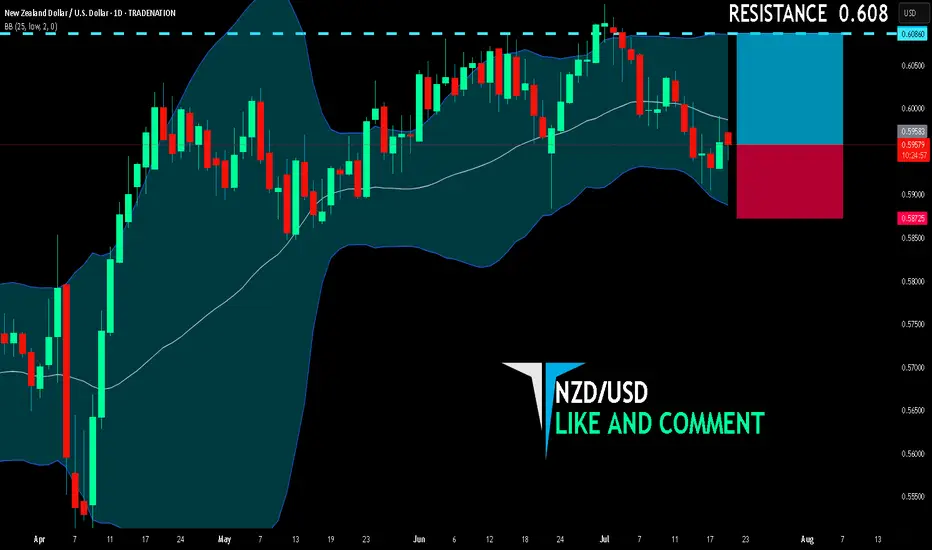
NZD/USD BUYERS WILL DOMINATE THE MARKET|LONG
NZD/USD SIGNAL
Trade Direction: long
Entry Level: 0.595
Target Level: 0.608
Stop Loss: 0.587
RISK PROFILE
Risk level: medium
Suggested risk: 1%
Timeframe: 1D
Disclosure: I am part of Trade Nation's Influencer program and receive a monthly fee for using their TradingView charts in my analysis.
✅LIKE AND COMMENT MY IDEAS✅
Dow Jones is Nearing an Important Support!!Hey Traders, in today's trading session we are monitoring US30 for a buying opportunity around 43,950 zone, Dow Jones is trading in an uptrend and currently is in a correction phase in which it is approaching the trend at 43,950 support and resistance area.
Trade safe, Joe.

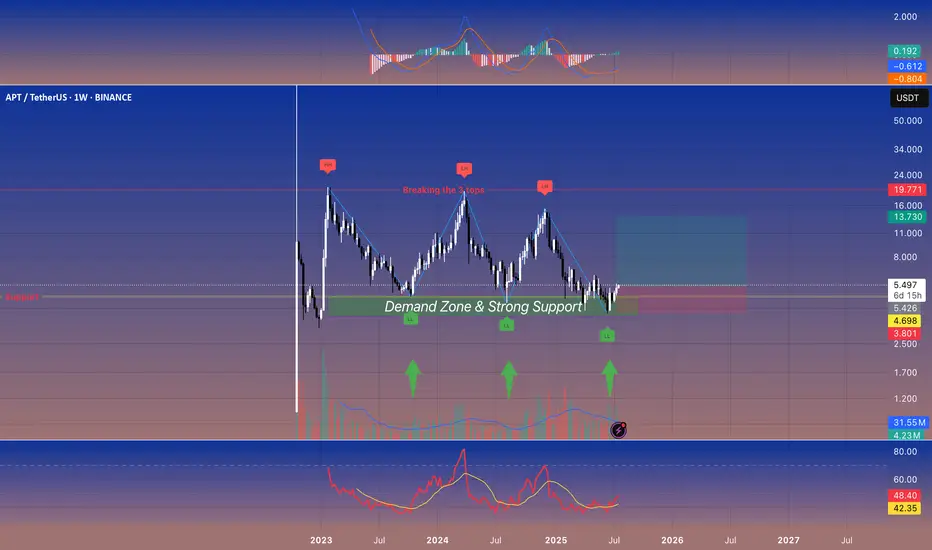
Aptos: The Sleeping Giant🚀 Aptos: The Sleeping Giant 😴🌋
APT keeps bouncing off a rock‑solid \~\$5 demand zone. If it finally pops above \~\$7.5‑8, the giant could wake up in a hurry. 📈
---
👀 Quick‑Glance Weekly Checklist
| 🔍 Focus | What’s Happening |
| ------------------------ | ------------------------------------------------------------------------------------------- |
| **Demand Zone** 🟢 | Repeated wick rejections + volume spurts every dip into **\$5‑5.2** = buyers camping there. |
| **Structure Squeeze** 🔄 | Series of **LH ➡️ LL ➡️ reclaim** – bears push down, bulls yoink it back. |
| **Momentum Curling** 📈 | MACD & RSI‑style oscillators turning up from oversold = reversal vibes. |
| **R/R Sweet Spot** 🍬 | Long near green box, cut below latest LL, reward toward prior LHs. |
---
🎯 Levels on My Radar
1. $5.00‑5.20 – “Do‑not‑break” support ⚔️
2. $6.00‑6.50 – First speed‑bump zone 🛑
3. $7.50‑8.00 – “Break the 3 tops” 🚪➡️ *Door to trend shift*
---
🛠️ Trade Idea (NFA, DYOR)
Scale‑in: nibble inside the green demand band 🍣
Stop‑out: just under the last LL – keep it tight ✂️
Take‑profit: peel some at **\$6s**, leave a moon‑bag for \$7.5‑8 🌖
---
⚡ Why I Care
APT’s been the kid in the back row while other alts moon. If that stacked high cluster cracks, short fuel + fresh eyeballs could send it sprinting. 🏃♂️💨
---
💬 Want intraday alerts or lower‑TF setups? Drop a comment! Let’s see if this giant wakes up or keeps snoozing. 🛌🔔
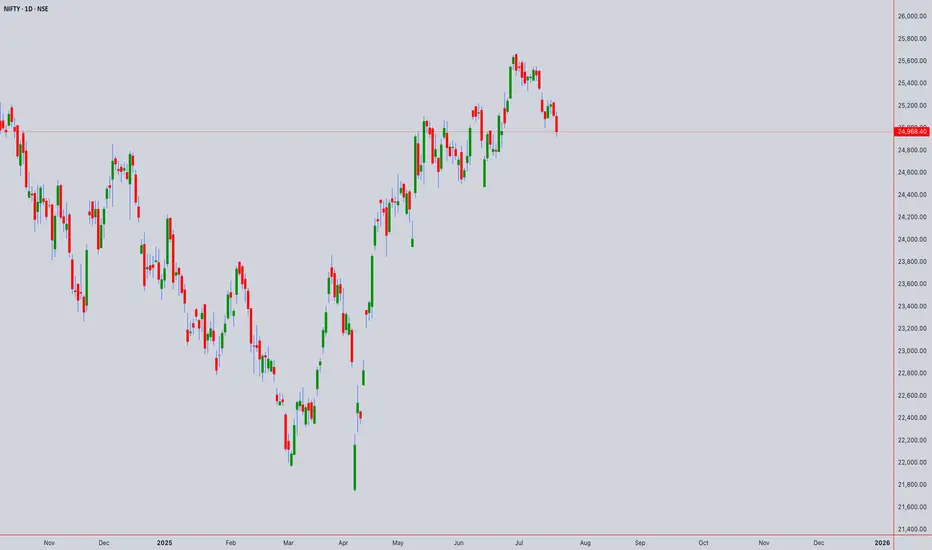
Technical Analysis: NIFTY50 (Closing: ₹24,968.40 on 18-Jul-2025)*Analysis as of 21-Jul-2025 (Monday)*
1. Candlestick Patterns
Daily: A bearish engulfing pattern formed on 18-Jul-2025, closing below the prior candle’s low. Signals short-term reversal risk.
Weekly: Doji formation (indecision) near all-time highs. Weekly close below ₹25,000 warns of exhaustion.
Intraday (4H): Bearish pin bars at ₹25,100 resistance. Watch for follow-through selling below ₹24,900.
2. Harmonic Patterns
Daily: Potential Bearish Bat pattern in development:
XA: ₹23,200 → ₹25,200 (100%)
B: 61.8% retracement at ₹24,400 (pending)
Confirmation below ₹24,400 targets ₹23,800 (0.886XA).
3. Elliott Wave Theory
Weekly: Final waves of Wave 5 (impulse) likely complete at ₹25,200.
Daily: Starting ABC corrective wave:
Wave A: ₹25,200 → ₹24,800 (if breaks ₹24,900)
Wave B: Rally to ₹25,000–25,100 (short opportunity)
Wave C: Target ₹24,300 (1.618xA).
Intraday (1H): Minute wave iii down in progress below ₹24,950.
4. Wyckoff Theory
Phase: Potential distribution near highs:
Upthrust (18-Jul high ₹25,120) failed to hold.
Spring Level: ₹24,900. Break confirms downtrend (test supply).
Downside target: ₹24,500 (fall after distribution).
5. W.D. Gann Analysis
Square of 9:
Key support: √24,968 ≈ 158.0 → 158² = 24,964 (critical pivot).
Close below 24,964 opens ₹24,650 (next square).
Time Cycles:
21-Jul is 180° from 21-Jan 2025 high. Watch for trend change.
Gann Angle: 1x1 angle from Jul-2025 high at ₹25,200 → breaks below imply ₹400/day decline.
6. Ichimoku Kinko Hyo (Daily)
Tenkan: ₹24,950 (resistance)
Kijun: ₹24,800 (support)
Cloud: Lagging span below price; cloud thinning (bearish momentum).
Signal: Price below Kijun → trend weakness.
7. Key Indicators
RSI (Daily): 62 → declining from overbought (70). Bearish divergence.
Bollinger Bands (4H): Price testing lower band (₹24,900). Break targets ₹24,600 (2σ lower).
VWAP (1H): ₹25,050 → intraday resistance.
Moving Averages:
Death Cross (50-DMA/200-DMA): Not triggered, but 5-DMA (₹25,020) crossed below 20-DMA (₹25,050).
Timeframe Summary
Timeframe Key Levels Bias Pattern/Thesis
5M/15M Res: ₹24,990 Bearish Scalp shorts below VWAP (₹25,050)
30M/1H Res: ₹25,050 Sup: ₹24,900 Bearish Bearish EW wave iii; RSI < 50
4H Res: ₹25,100 Sup: ₹24,800 Neutral Break below ₹24,800 confirms Wyckoff distribution
Daily Res: ₹25,200 Sup: ₹24,400 Bearish Bearish Bat + ABC correction
Weekly Res: ₹25,500 Sup: ₹24,000 Neutral Doji warns of reversal; hold ₹24,400 key
Actionable Outlook
Intraday (21-Jul):
Short below ₹24,900 (SL: ₹25,050) → Target ₹24,800.
Break below ₹24,800 extends to ₹24,650.
Swing (1–2 Weeks):
Sell rallies near ₹25,100 (SL: ₹25,250) → Target ₹24,400.
Weekly close > ₹25,200 invalidates bearish view.
Critical Supports: ₹24,800 (Wyckoff spring) → ₹24,400 (Harmonic/EW target) → ₹24,000 (psychological).
Key Resistances: ₹25,050 (VWAP) → ₹25,200 (ATH) → ₹25,500 (Gann square).
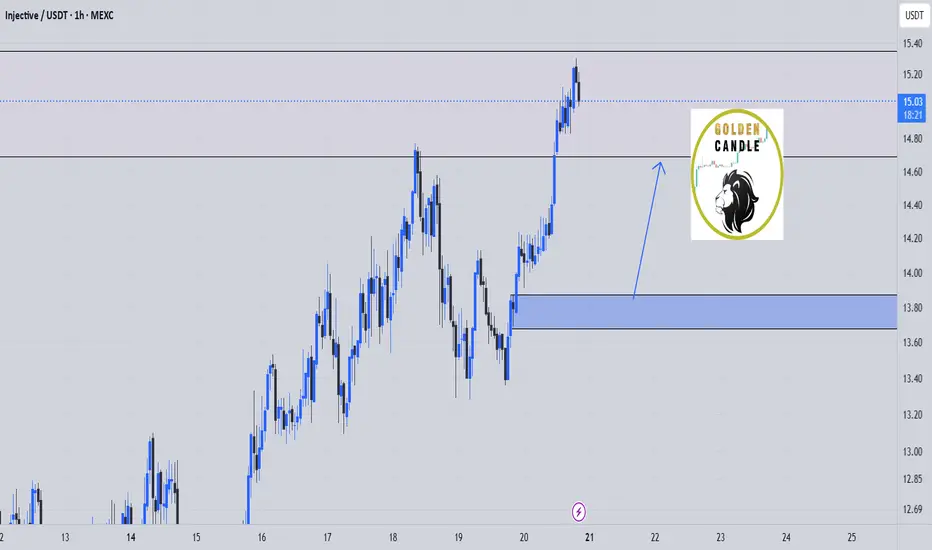
inj buy midterm"🌟 Welcome to Golden Candle! 🌟
We're a team of 📈 passionate traders 📉 who love sharing our 🔍 technical analysis insights 🔎 with the TradingView community. 🌎
Our goal is to provide 💡 valuable perspectives 💡 on market trends and patterns, but 🚫 please note that our analyses are not intended as buy or sell recommendations. 🚫
Instead, they reflect our own 💭 personal attitudes and thoughts. 💭
Follow along and 📚 learn 📚 from our analyses! 📊💡"
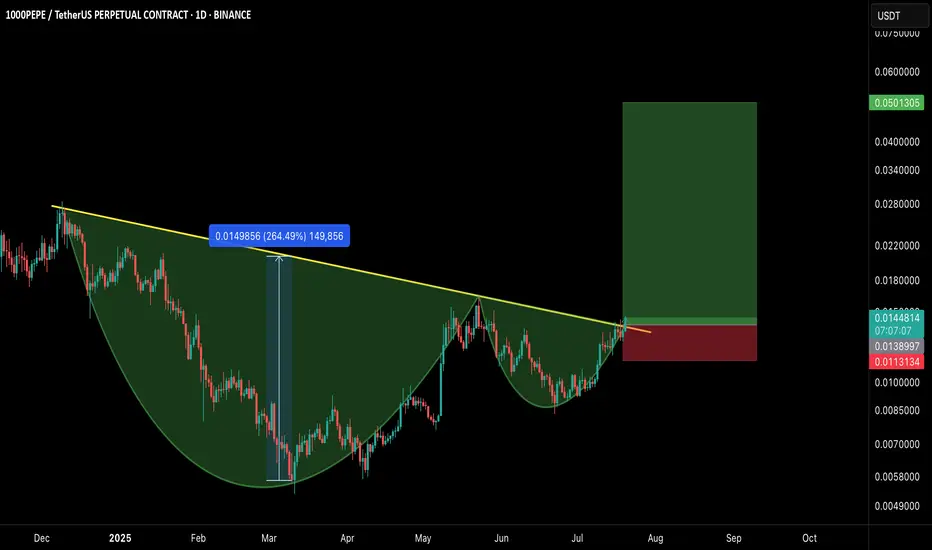
1000PEPE/USDT – CUP & HANDLE BREAKOUT!Hey Traders!
If you’re finding value in this analysis, smash that 👍 and hit Follow for high-accuracy trade setups that actually deliver!
A classic Cup and Handle formation just broke out with strong bullish confirmation, signaling the potential start of a massive trend reversal on the higher timeframe.
📊 Pattern Breakdown
✅ Cup & Handle pattern forming over 7+ months
📐 Breakout above neckline with volume confirmation
📈 Measured move target points towards $0.0501+
🛒 Long Entry:
CMP or on retest near $0.0128–$0.0138
🎯 Targets:
TP1: $0.022
TP2: $0.028
TP3: $0.035
TP4: $0.050
🛑 Stop-loss:
Below handle low — around $0.0113
📌 Risk-to-Reward:
Insane potential here with a 3.5R+ setup even with conservative targets.
📢 Final Thoughts:
This is a textbook reversal pattern breaking out after long accumulation. If BTC remains stable or bullish, meme momentum could supercharge this move.
DYOR + SL is a must!
Looking Over Gold Expectations for the coming Week!Last week had a solid play of moves. Ultimately closing out around 50% of its overall movement. Looking for price to continue with more bullish activity as we come into a new week. Keeping in tune to find areas I can take advantage and get active.

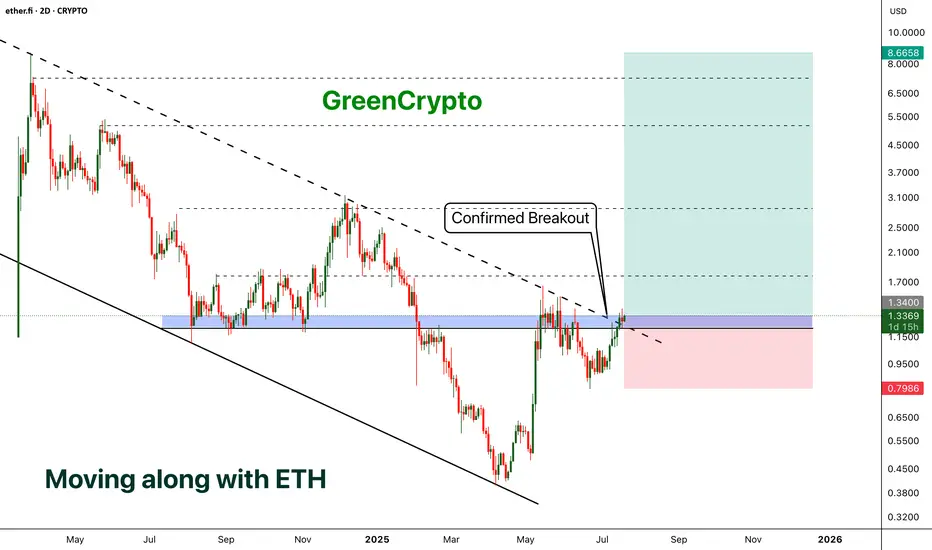
ETHFI - Moving along with the ETH- ETHFI has finally broken out from the descending channel pattern and now price is above the trending resistance line.
- We can expect a minor reversal (chances are less ) and parabolic move from here.
- I'm expecting at-least 500+% profit from this opportunity
Entry Price: 1.3384
Stop Loss: 0.7965
TP1: 1.7657
TP2: 2.5436
TP3: 4.5055
TP4: 5.6136
TP5: 8.5626
Max Leverage 5x.
Don't forget to keep stoploss.
Support us by Liking and following.
Thanks and Cheers!
GreenCrypto
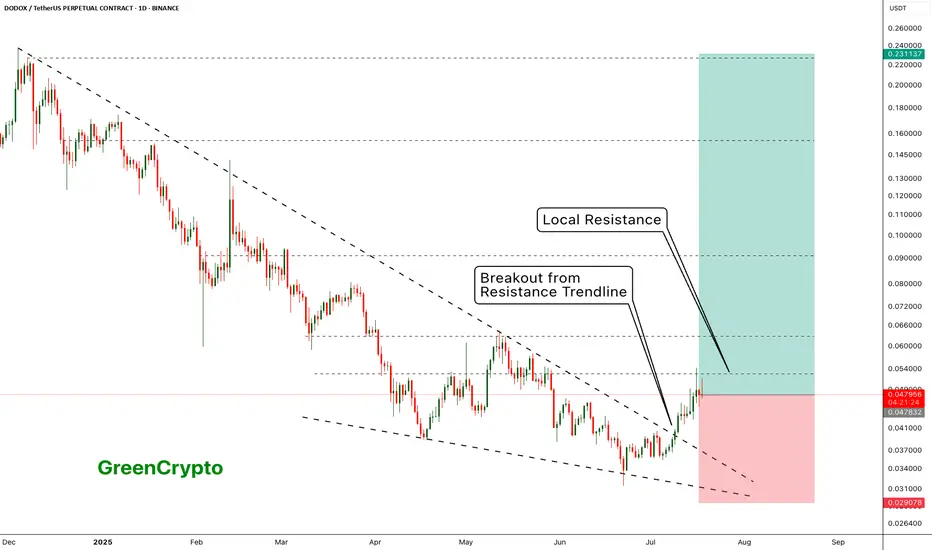
DODOX - Resistance is holding it back - Huge Potential- DODOX has successfully broken out from the resistance trendline
- Now its being pushed back back the weak local resistances
- I see a huge upward potential here.
Entry Price: 0.048271 ( Or you can wait for it breakout from the local resistance of 0.063051)
Stop Loss: 0.029078
TP1: 0.062621
TP2: 0.079766
TP3: 0.103243
TP4: 0.151853
TP5: 0.222332
Max Leverage 5x.
Don't forget to keep stoploss
Cheers!
GreenCrypto
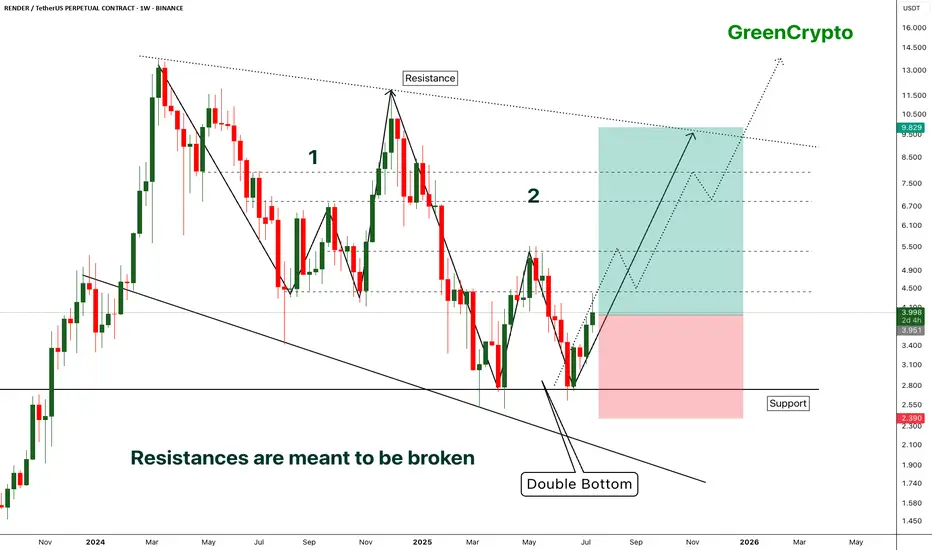
RENDER - [Double bottom] - Resistances are meant to be broken- RENDER has successfully bounced back from the support by forming the double bottom pattern.
- Double bottom pattern is bullish pattern, when it forms at the strong support it becomes extremely bullish. this is one of such scenario.
- Im expecting some minor resistance at the local resistance around 4.3
- A successfull breakout this local resistance will push the price further high.
Entry Price: 3.941
Stop Loss: 2.378
TP1: 4.413
TP2: 5.350
TP3: 6.887
TP4: 8.092
TP5: 9.810
Max Leverage 5x.
Don't forget to keep stoploss.
Support us by Liking and following.
Thanks and Cheers!
GreenCrypto
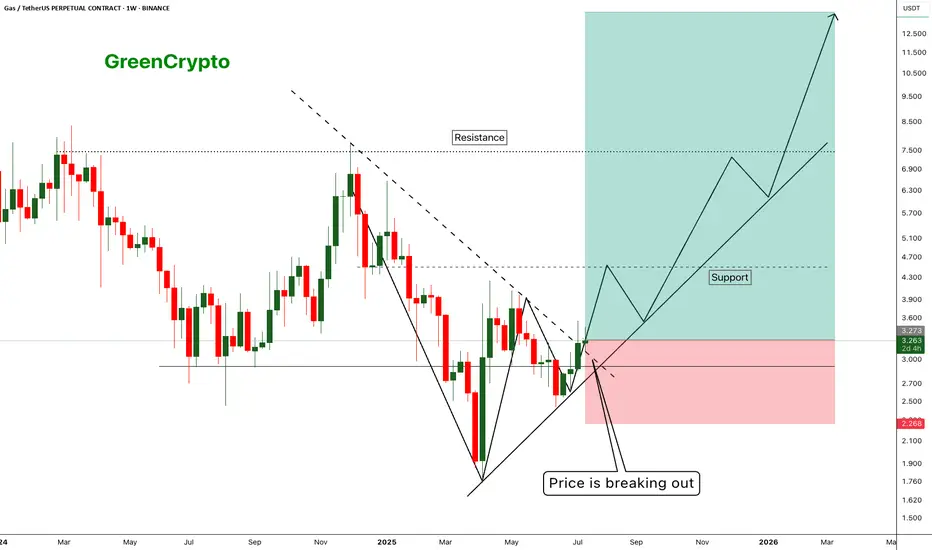
GAS - Huge Risk:Reward Trade 1:10 - Is there any Gas Left ?- Gas has finally managed to breakout from the resistance trendline and now trading just above the resistance
- I'm expecting this trend to continue along the support line shown in the chart.
Entry Price: 3.281
Stop Loss: 2.271
TP1: 3.944
TP2: 4.589
TP3: 6.775
TP4: 8.412
TP5: 13.512
Max Leverage 5x.
Don't forget to keep stoploss.
Support us by Liking and following.
Thanks and Cheers!
GreenCrypto
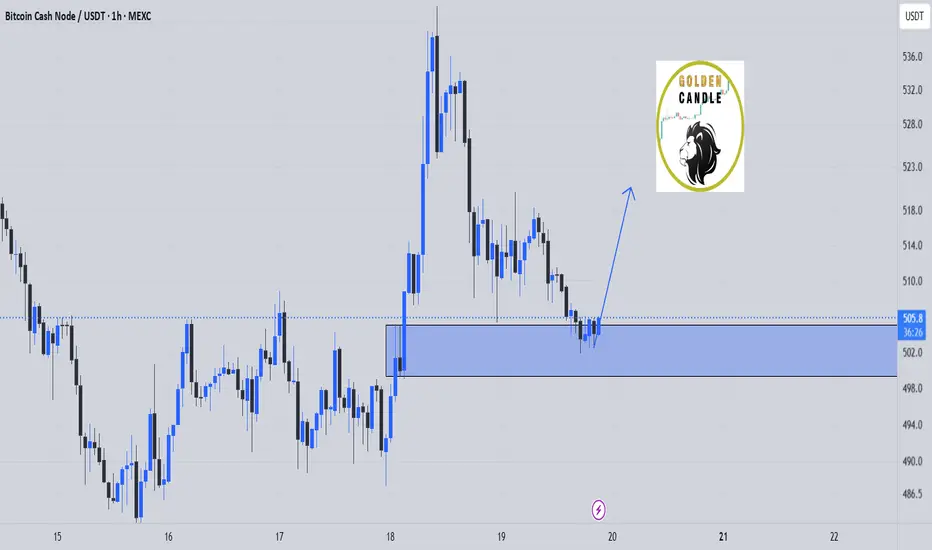
buy bch midterm"🌟 Welcome to Golden Candle! 🌟
We're a team of 📈 passionate traders 📉 who love sharing our 🔍 technical analysis insights 🔎 with the TradingView community. 🌎
Our goal is to provide 💡 valuable perspectives 💡 on market trends and patterns, but 🚫 please note that our analyses are not intended as buy or sell recommendations. 🚫
Instead, they reflect our own 💭 personal attitudes and thoughts. 💭
Follow along and 📚 learn 📚 from our analyses! 📊💡"
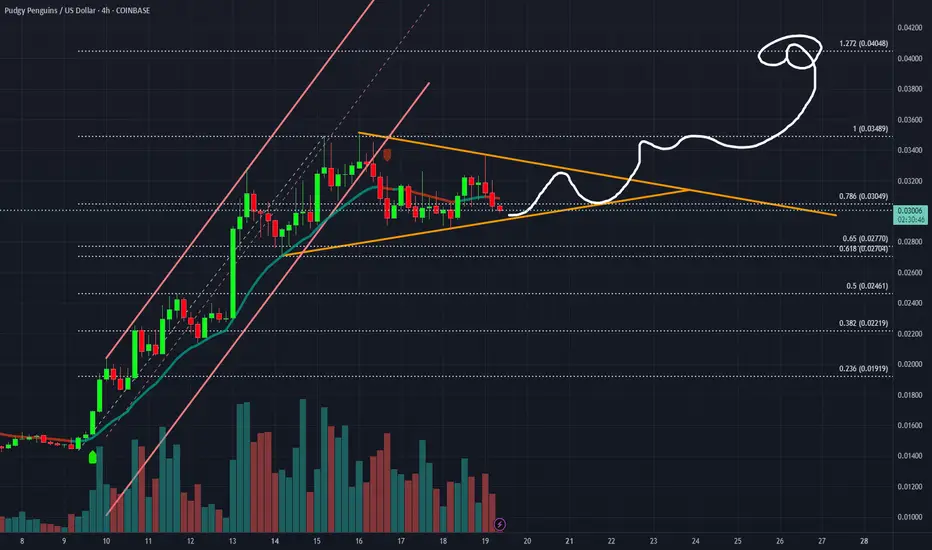
$PENGU Pudgy PenguinsWithout a breakout to the DOWNside, CSECY:PENGU is still looking bullish for at least a hit to .04.
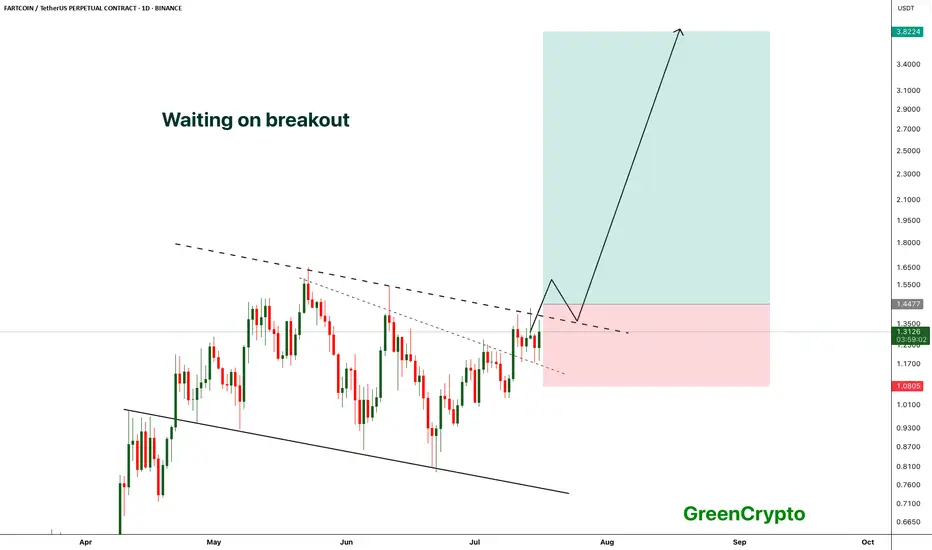
FARTCOIN - Breakout from the channel- FARTCOIN is waiting to breakout from the channel, a confirmed breakout would push the price to new all time high
- we have long trade opportunity once the price breaks above the resistance trendline
Entry Price: above 1.44
Stop Loss: Below 1.08
TP1: 1.6464
TP2: 1.8923
TP3: 2.2450
TP4: 2.9973
TP5: 3.8224
Max Leverage: 5x
Don't forget to keep stoploss
Cheers
GreenCrypto