IQV - BUY ON DIPS IQV - CURRENT PRICE : 184.08
From May to July, IQVIA (IQV) staged a strong upward rally, supported by rising volume. Following this advance, the stock underwent a healthy retracement, consolidating recent gains without breaking its long-term uptrend. Take note that the up trendline is still intact.
Currently, price action shows signs of support around the Fibonacci 38.2% retracement level , coinciding with both the Ichimoku Cloud and the 50-day EMA . This confluence suggests the retracement phase may be complete, presenting a good opportunity to apply a Buy on Dips strategy as the stock prepares for its next upward leg.
ENTRY PRICE : 183.50 - 184.50
TARGET : 205.00 and 215.00
SUPPORT : 166.00
Bullishoutlook

SHOP - BULLISH SCENARIO since 12 MAY 2025 SHOP - CURRENT PRICE : 145.15
SHOP is bullish as the share price is above 50-day EMA. Price action on 12 MAY 2025 is considered starting of bullish scenario because supported by several key indicators :
Share price gap up
Price broke out 50-day EMA
Price moving above ICHIMOKU CLOUD
RSI moving above 50
From 1 August (near 50-day EMA support) to 6 August, the stock recorded a strong upward rally. Following this advance, prices entered a corrective phase and retraced approximately 50% of the prior upswing. According to Dow Theory, such a retracement is considered a normal and healthy correction within an ongoing uptrend. Retracements in the range of one-third to two-thirds of the prior move are typical, with the 50% level often serving as a natural equilibrium point where buyers re-enter the market. Sustaining above the 50% retracement level would reinforce the bullish structure, while a recovery from this zone could pave the way for a retest of the recent highs. However, a decisive break below the 61.8% retracement may imply weakening momentum and a deeper corrective phase.
Take note that until now the share price is still above 50-day EMA and ICHIMOKU CLOUD while RSI also moving steadily above 50 level. There is also rising support line - strengthening bullish outlook.
ENTRY PRICE : 141.00 - 145.50
TARGET : 159.00 and 175.00
SUPPORT : 50-day EMA (CUTLOSS below 50-day EMA on closing basis)

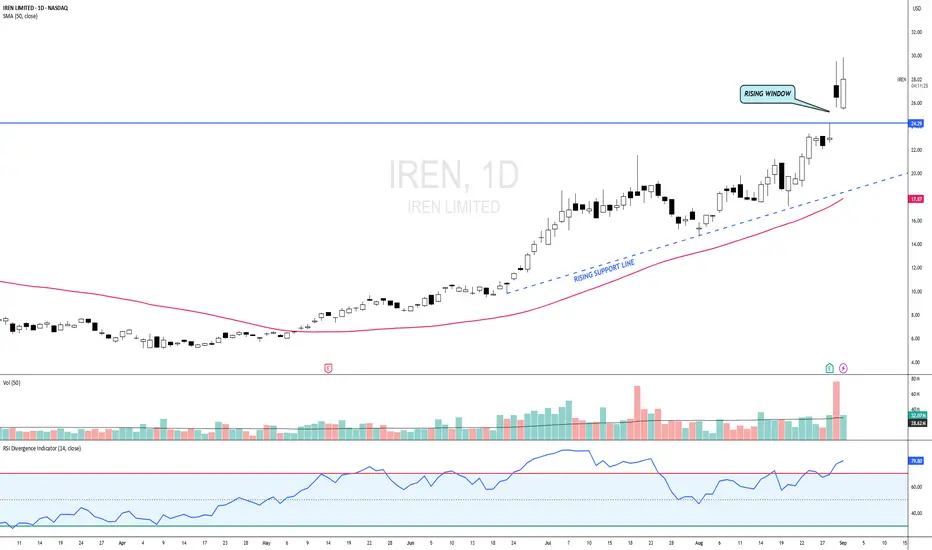
IREN - BULLISH RISING WINDOW at ALL TIME HIGH ZONEIREN - CURRENT PRICE : 27.00 - 28.00
The stock is bullish as the share price is above 50-day SMA. This bullish scenario is strengthened by the rising support line. Yesterday the stock made a rising window with high trading activity - indicating bullish continuation trend.
In JAPANESE CANDLESTICK THEORY, a rising window's low should acts as strong support level. As such, as long as IREN share price maintain above 24.29 the outlook remain bullish. Technically 25.00 until 28.00 will be a good entry point for buying.
ENTRY PRICE : 25.00 - 28.00
TARGET : 31.00 and 34.00
SUPPORT : 24.00 (CUTLOSS below 24.00 on closing basis)
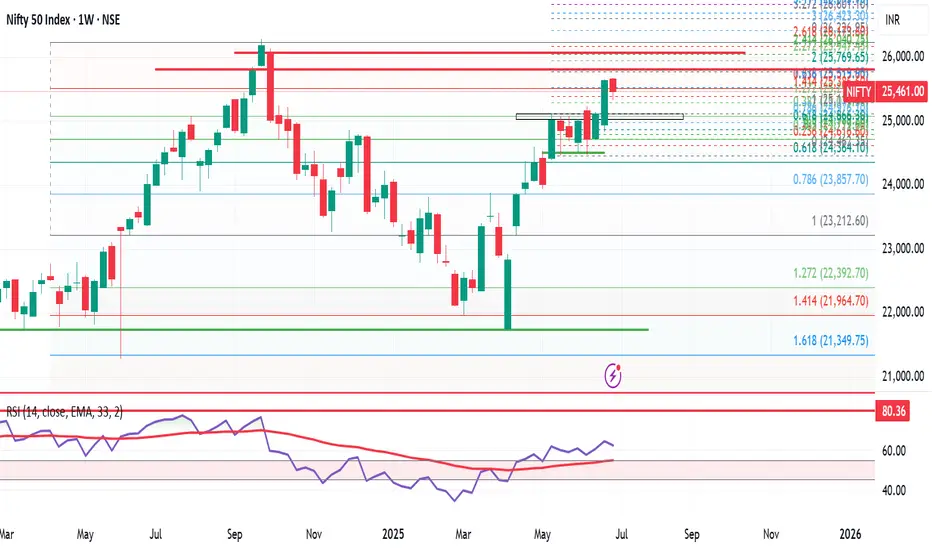
Nifty Wkly Update: Market Cools Off,But Bulls May Regain ControlNifty closed the week at 25,461, down 176 points from last week's close. It touched a high of 25,669 and a low of 25,331—a clear sign of consolidation and short-term correction.
As I highlighted last week, it was a smart move to book partial profits or trail your stops, especially after the strong upmove. And here we are—a healthy pullback, exactly what we anticipated.
But things are about to get interesting...
Reliance, the heavyweight of Nifty, is turning bullish on the monthly chart—a strong signal for potential upside. As long as Reliance remains bullish, it's wise to focus on bullish opportunities only.
Nifty Outlook for Next Week:
Expected Range: 25,000 – 25,900
Strategy: Buy on dips while Reliance stays strong.
Sentiment: Cautiously bullish
Global Cue: S&P 500 Hits All-Time High!
The S&P 500 closed at a record 6,279, up nearly 100 points from last week. If it breaks above 6,284, we could see a rally toward:
6,376
6,454
6,500
6,568 (key level to watch)
However, a break below 6,177 could pull it back to 6,050/6,040.
My take: S&P 500 is in beast mode, and as it climbs, it’s likely to drag Nifty higher too. The broader market is turning bullish—momentum is shifting in favor of the bulls.
Final Thought:
Bulls are loading their guns, and bears might want to take a nap for the next 10–15 days. The trend is your friend—for now, let the bulls enjoy the ride!
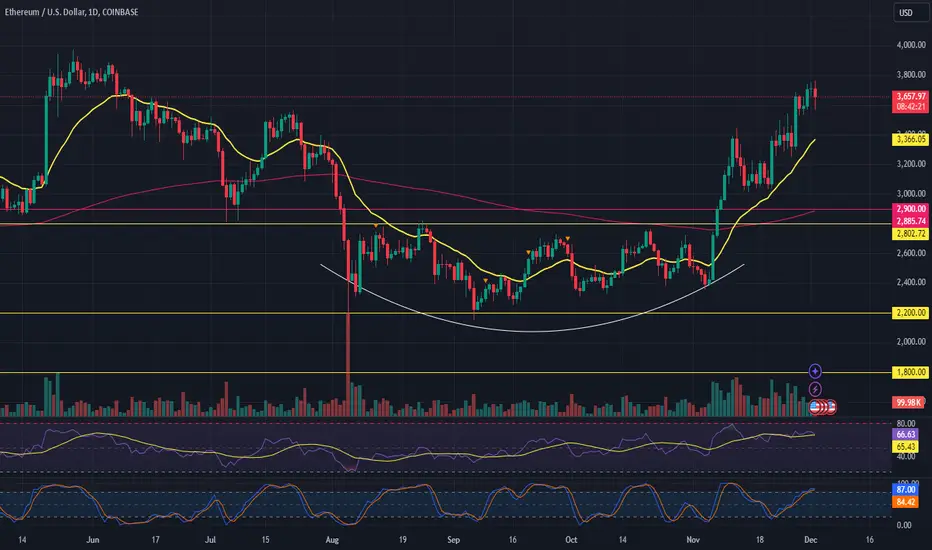
Ethereum (ETH) Bullish Technical Outlook Technical Overview:
Consolidation Phase: Ethereum has experienced a prolonged consolidation throughout 2024, but recent momentum points toward increasing bullish control, suggesting a potential breakout.
Shallow Pullbacks: Recent shallow pullbacks indicate seller exhaustion, with buyers stepping in at progressively higher levels, reinforcing bullish sentiment.
Key Levels to Watch:
Support: $3,000 (critical level for maintaining bullish outlook)
Resistance: $4,100-$4,200 (short-term target)
Long-Term Targets: $4,800-$5,000 (all-time highs), $8,000 (potential in 2025)
Outlook:
Short-term: A retest of the $4,100-$4,200 resistance zone is likely before the end of December, as momentum continues to favor the bulls.
Medium to Long-term: With Ethereum remaining above the $3,000 support, expectations for new all-time highs around $4,800-$5,000 are in play, with the possibility of reaching $8,000 in 2025 if the bullish trend accelerates.
#Ethereum #ETH #BullishOutlook #CryptoMarket #Breakout
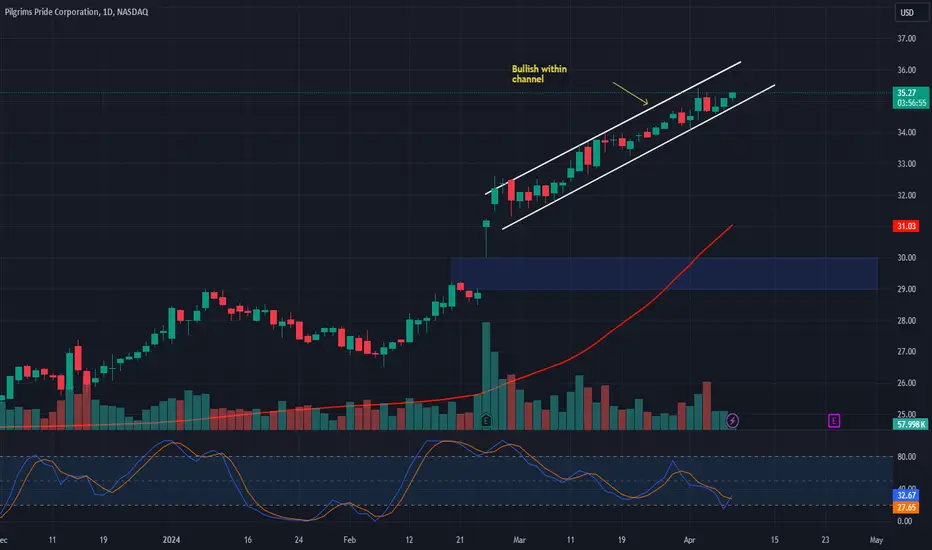
🐔💼 Pilgrim’s Pride Corporation (PPC) Update! 📈🌟📊 Key Points:
New Leadership: Ivan Siqueira appointed as president of Pilgrim’s Europe to enhance synergy and growth.
E-commerce Growth: PPC experiences a 48% sales increase in 2022, with e-commerce now constituting 23% of revenue from branded products.
Mexico Business: PPC's Mexico business shows improved results despite market challenges, benefiting from strong brands and key customer relationships.
📈 Outlook and Targets:
Bullish Sentiment: Positive developments drive bullish sentiment for PPC.
Upside Target: Set at $50.00-$52.00, reflecting confidence in future growth.
Entry Point: Bullish outlook above the $29.00-$30.00 mark.
🚀 Potential for Growth: With strategic leadership appointments, e-commerce growth, and resilient business performance in Mexico, PPC is positioned for continued success and potential stock appreciation. 📈🐔 #PPC #BullishOutlook 🌟📊
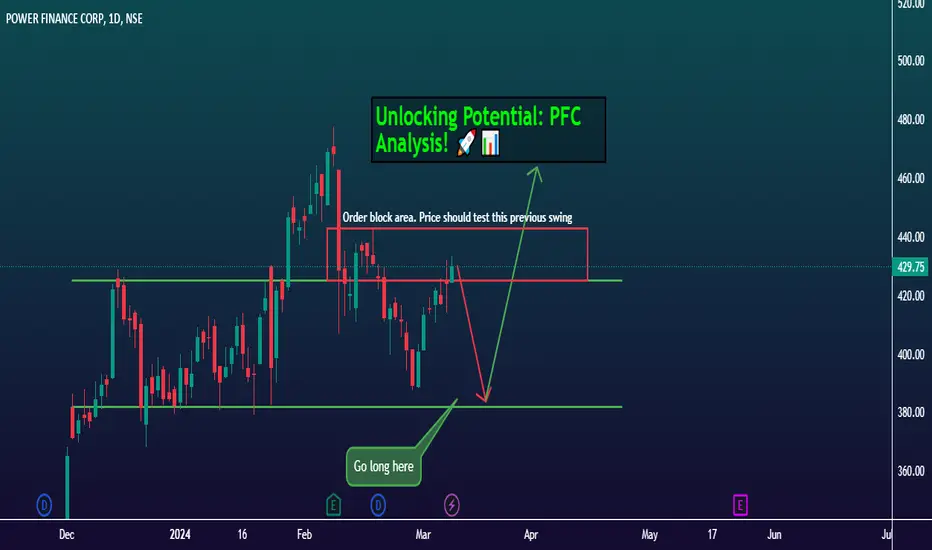
Unlocking Potential: Power Finance Corporation Analysis! 💼📈Traders, let's delve into Power Finance Corporation today ! 🌟 In the daily timeframe, we're witnessing a range-bound movement, with the price testing previous swing highs. 🔄 Anticipate a breakout above this level(red box), potentially targeting Rs. 450 and beyond. But before that it may come around at Rs.400 to go up further. PFC appears poised for bullish action! 🚀 Options traders, explore 400 CE or below 400 CE options with ample liquidity. Let's capitalize on this opportunity! 💼📊
Thank you. See you again in the next post!
Best regards,
Alpha Trading Station