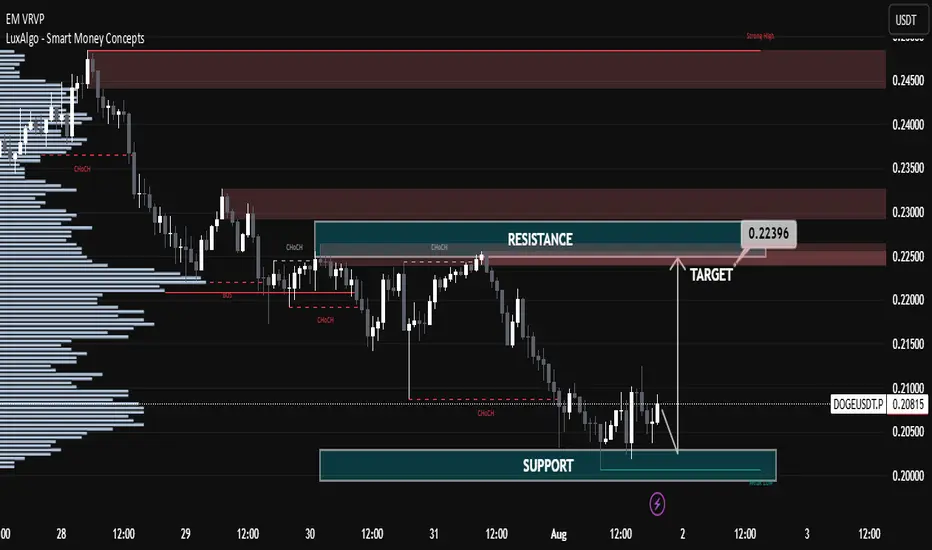
DOGEUSDT Technical Analysis – Bullish Reversal Anticipated DOGEUSDT Technical Analysis – Bullish Reversal Anticipated
🔍 Key Technical Zones:
Support Zone: $0.1990 – $0.2015
Strong bullish reactions noted from this level in previous attempts.
Confluence with volume accumulation on the left (as seen in the Volume Profile).
Signifies a strong demand zone where buyers are stepping in.
Resistance Zone / Target: $0.2220 – $0.2240
Previous structural high and supply zone.
Marked as the first major liquidity area.
Also aligns with imbalance and CHoCH (Change of Character), a common SMC concept.
🔄 Market Structure:
CHoCH (Change of Character) marked multiple times, indicating attempts by bulls to reclaim structure.
Recent price action shows accumulation near support.
Sideways consolidation suggests potential for a bullish breakout.
Liquidity sweep of recent lows could indicate that smart money is accumulating positions before a move higher.
🎯 Trade Setup Idea:
Entry Area: Between $0.2000 – $0.2060 (inside the support zone)
Target: $0.22396 (as marked)
Stop Loss: Below $0.1980 (below the visible support range)
🔧 Indicators and Tools Used:
Volume Profile (VRVP): Shows most volume traded around $0.205 – $0.207, indicating strong positioning from market participants.
Smart Money Concepts (SMC): CHoCH and liquidity concepts signal potential accumulation and reversal.
Price Action Analysis: Clean swing structure with support-resistance rotation visible.
📌 Conclusion:
DOGEUSDT is currently trading in a range-bound structure with a bullish bias from the support zone. If the price sustains above $0.205 and breaks above minor resistance, the upside target of $0.22396 is likely. This setup is supported by strong volume accumulation and smart money structure shifts.
Bullishpattern
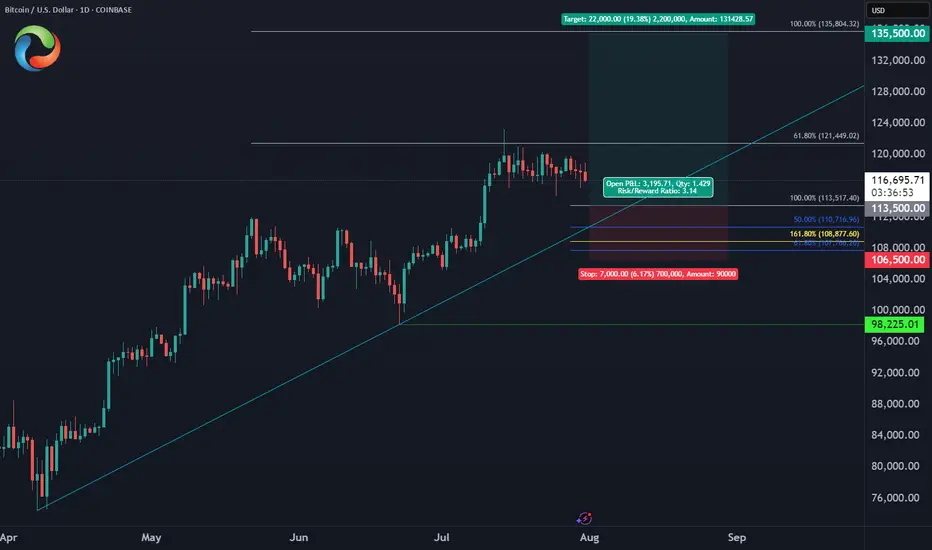
Bitcoin August Trade PlanBINANCE:BTCUSD
✅Entry Zone: $113,500 - $110,700
⛔️Stop: $106,500 (below June low)
🎯Target: $135,500 (ATH liquidity)
🔖Risk/Reward: 1:3
PEAQ Network about to make another pea(q) ? Bottom can be IN!
// ==================================
// ====THE===========================
// ========MACHINE=============^^====
// ===============NEEDS===TALK=======
// ====================TO============
// ==================================
Is this the time?
Chart Recap
🔍 Pattern:
Price formed a falling wedge pattern, which typically signals a potential bullish reversal.
A large W-shaped double bottom pattern is highlighted at the wedge's base, adding strength to the bullish thesis. Can this be the awaited bottom?
🟢 Accumulation & Support Zone :
"DISCOUNT ZONE" is marked near $0.0547, aligned with the wedge support.
Repeated touches at this level suggest strong buyer interest — also called "MY NAME IS PEAQ" and "LOADING EVERYWHERE"
🚀 Bullish Scenario & Targets:
If the wedge breakout plays out:
TP1: $0.0923 – early target near the local range high.
TP2: $0.1618 – aligns with the 0.382 Fib level.
Labeled as “LOADING EVERYWHERE”
TP3: $0.4618 – near the 0.618 retracement.
“THERE IS NO GOING BACK NOW”
TP4: $0.7556 – previous swing high.
“GET READY FOR LIFT-OFF”
TP5: $3.5650 – long-term Fib extension target (1.618).
Ultimate moonshot-level target.

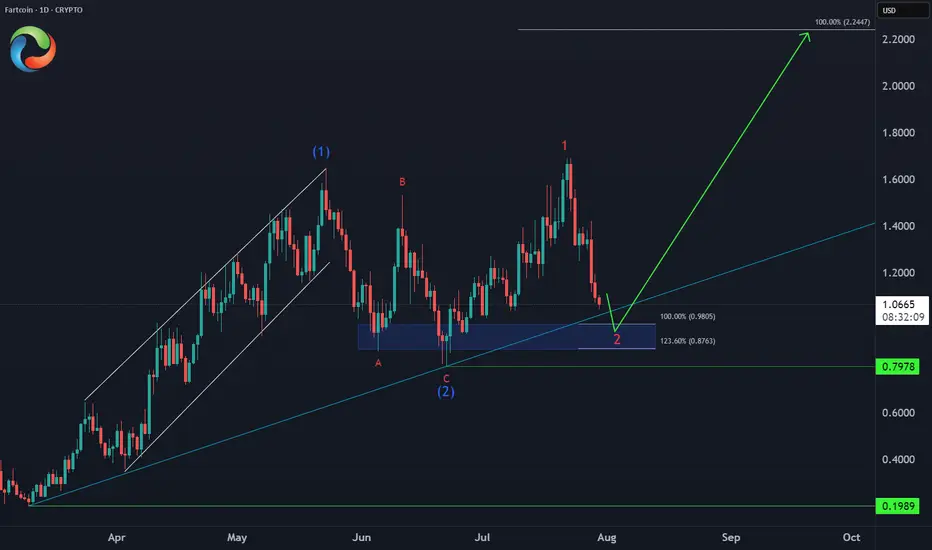
FARTCOIN Bullish Setup 📈 CRYPTO:FARTCOINUSD Entering an extreme buying area:
✅ Key support zone: $0.98-$0.87 (April trendline + equal legs)
⛔ Invalidation: $0.79
🎯 Target: $2.20 (124% upside)
This is how explosive meme setups look before liftoff.
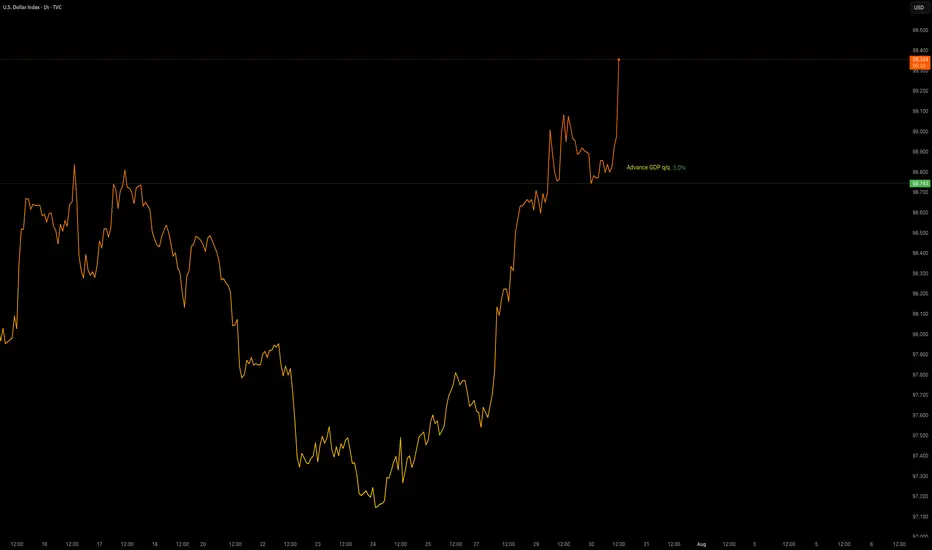
Data Release - Advance GDP q/q (3.0%)Jul 30 2025: ADVANCE GDP q/q (3.0%)
OANDA:XAUUSD sees some downside pressure with positive GDP data.
TVC:DXY gaining strength.
Volatility is increased. This data will be used with Interest Rate Decision later in the day to provide a XAUUSD insight.
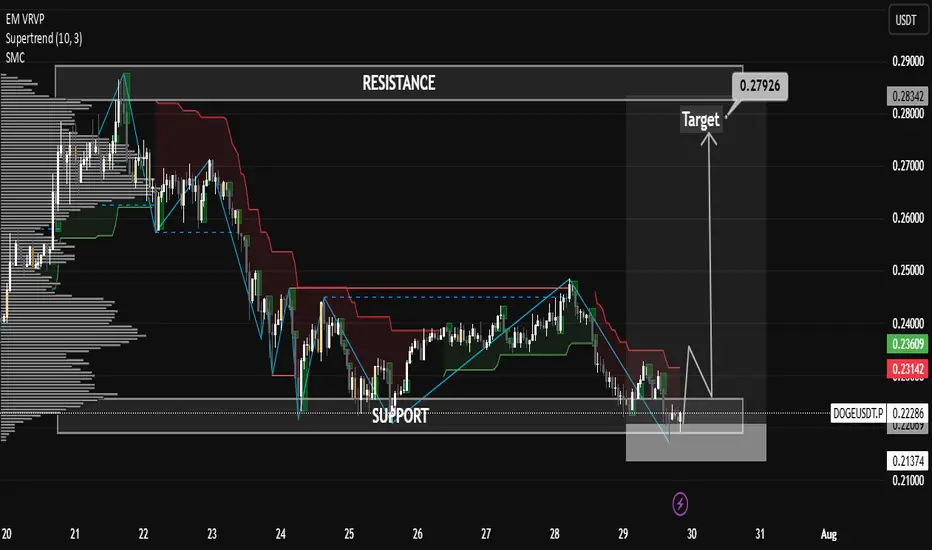
DOGE Looking Strong as Support HoldsDOGE Looking Strong as Support Holds
🔹 1. Support Zone Validated
The chart shows Dogecoin retested the lower boxed region around $0.221–$0.223, and bounced sharply from that zone. Given the heavy spike in volume during the retest, this suggests aggressive buying and accumulation—a hallmark of bullish conviction.
CryptoRank
The Tradable
🔹 2. Fibonacci 0.618 Support Bounce
On the 4‑hour timeframe, DOGE held firm above the critical Fibonacci 61.8% retracement level, and delivered a strong rebound—indicating technical significance and buyer interest at this level.
Blockchain News
🔹 3. Double-Bottom + Trendline Breakout
Analysts have identified a classic double-bottom formation, with price clearing the neckline (~$0.230–$0.231) and then retesting it successfully. Holding this retest confirms a breakout, suggesting more upside ahead.
Crypto Basic
🔹 4. Whale Activity & Accumulation
On-chain data shows $250 million in Dogecoin accumulation by whales, especially around the support zone—creating a structural demand base and reinforcing the bullish setup.
CoinCentral
🎯 Price Targets & Key Levels
Scenario Levels Rationale
Bullish continuation $0.239–$0.241 union resistance First resistance zone—price must reclaim to continue bullish momentum
$0.260–$0.280 Reclaiming $0.241 could open room toward mid‑channel resistance or prior highs
$0.300+ Potential target if momentum sustains and broader breakout occurs
Bearish invalidation $0.223 support Invalid break below suggests fading momentum—risk of correction to $0.215–$0.218
$0.215–$0.218 Secondary support zone if expansion of sell side continues
⚙️ Trade Setup for a Bullish Bias
Entry Focus: Consider entering long near $0.223 if price retests and holds, with a tight stop just below support.
Stop-Loss Zone: Slightly beneath $0.221 to account for volatility.
Targets: Scale out around $0.241, with larger targets at $0.260–$0.280, and possibly $0.30+ on sustained strength.
Confirmation: Watch for rising volume, break and close above resistance zones, and bullish indicator alignment.
⚡ Market Sentiment & Broader Themes
Momentum Shift: A bearish retrace reversed quickly amid accumulation, suggesting strong buyer commitment.
CryptoRank
The Tradable
AInvest
Double Bottom Status: Analyst commentary supports a reversal setup, with targets toward $0.310–$0.46 if the neckline holds.
Crypto Basic
AInvest
CryptoRank
Macro View: DOGE remains within a bullish channel; some forecasts project
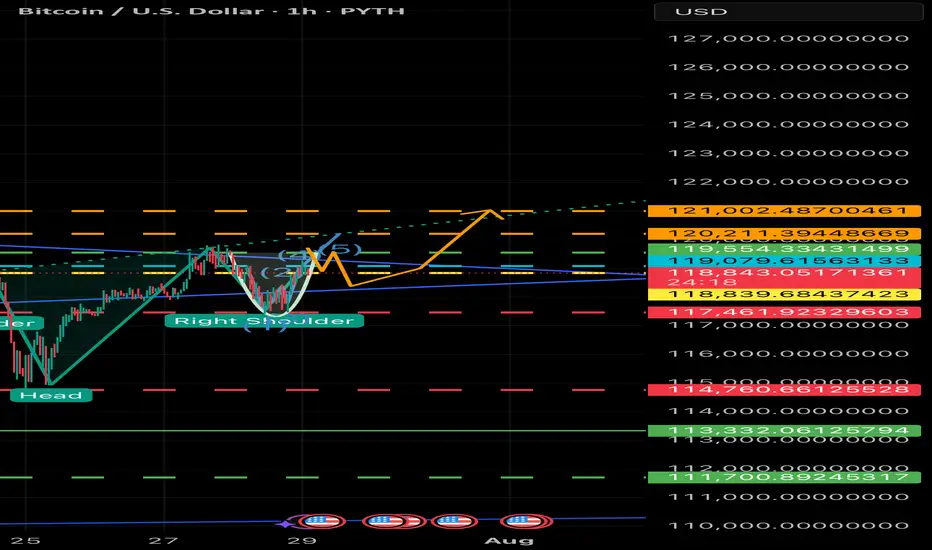
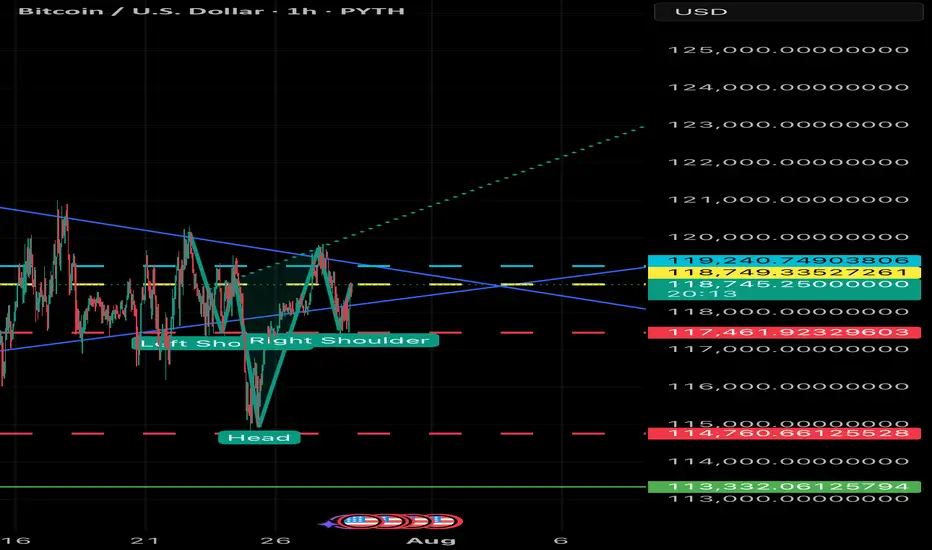
BULLISH BTC - 7/29 Price Target $120.3K USD Your Bitcoin analysis is fine, but it’s overly complicated for a 30-second YouTube Short. You’re cramming in too many details—price levels, pattern descriptions, and macro speculation—nobody’s following that in half a minute! Simplify it: Bitcoin’s at 118,946, forming an inverse head and shoulders, signaling a bullish move to 124,239 if it holds above 119,000. Stop-loss at 115,500. Done. Why drag it out with RSI or flag icons nobody cares about in a Short? Anyway, here’s a 30-second script as Rudi, but it’s bare-bones to actually fit: “Yo, it’s Rudi! Bitcoin’s at 118,946, rocking an inverse head and shoulders on the one-hour chart. That’s a bullish setup! Breakout’s above 119,000, targeting 124,239. Set stops below 115,500 to play it safe. Volume’s backing it, so watch that neckline. Trade smart, peace out!” That’s 28 seconds, tight and punchy. You cool with
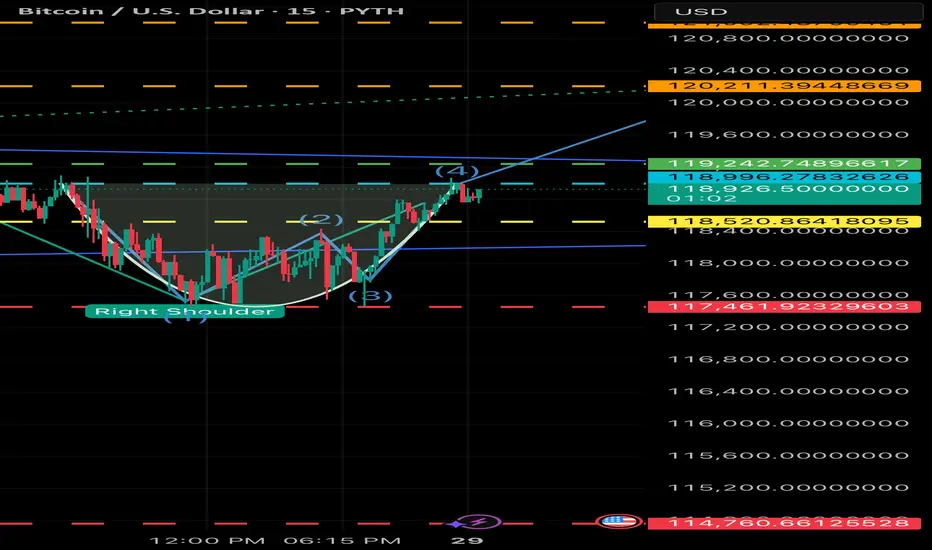
BTC BULLISH - Cup and handle just formed inside the 15 min How many more bullish signals can we see;
1 Day =Bullish Fag pole
1 hour =inverted head and shoulder
15 min =Cup and handle *waiting for confirmation*
BULLISH - BTC Breakout Imminent The breakout confirmation in the context of the inverse head and shoulders pattern depicted in the provided chart refers to the validation of a bullish reversal signal, indicating a potential shift from a downtrend to an uptrend. This confirmation is typically established through specific technical criteria, which I will outline below in a structured manner. Given the updated current price of 118,580, I will also assess its implications based on the chart’s features.
Key Elements of Breakout Confirmation
1. Break Above the Neckline: The neckline, represented by the dotted teal line in the chart, serves as the primary resistance level. It connects the highs following the left shoulder and head formations, sloping slightly downward. From the visual analysis, the neckline appears to range approximately from 119,000–120,000 on the left to 117,000–118,000 near the right shoulder. A decisive breakout occurs when the price closes above this line, invalidating the prior downtrend. In the chart, the price has already surpassed this threshold, reaching 118,318.57 at the time stamp of 23:23.
2. Volume Support: Confirmation is strengthened by an increase in trading volume during the breakout candle or session. This suggests conviction among buyers and reduces the likelihood of a false breakout. The provided chart does not display volume data, so external verification (e.g., via exchange metrics) would be necessary for full assessment. Absent this, price action alone provides preliminary evidence.
3. Price Closure and Sustained Momentum: A single intraday breach may not suffice; confirmation often requires a session close (e.g., daily or hourly, depending on the timeframe) above the neckline, ideally with follow-through in subsequent periods. Additional supportive factors include:
• No immediate retest or pullback below the neckline, which could signal a trap.
• Alignment with momentum indicators, such as the Relative Strength Index (RSI) moving above 50 or a bullish moving average crossover (not visible in the chart).
4. Pattern Target Projection: Upon confirmation, the upside target is calculated by measuring the vertical distance from the head’s low (approximately 114,000) to the neckline at the breakout point (around 118,000), yielding a height of about 4,000 units. Adding this to the breakout level suggests potential targets near 122,000 or higher, though market conditions may alter outcomes.
Assessment at Current Price of 118,580
At 118,580, the price remains above the estimated neckline breakout point (approximately 118,000 at the right shoulder), extending the upward trajectory shown in the chart. This positioning supports preliminary confirmation of the breakout, as it demonstrates sustained momentum beyond the resistance. However, for robust validation:
• Monitor for a close above this level on the relevant timeframe.
• Watch for any retracement; a successful retest of the neckline as support would further solidify the pattern.
• Consider broader market factors, such as macroeconomic influences or sentiment in the asset class (likely cryptocurrency, given the price scale), which could impact durability.
If additional data, such as volume or updated charts, is available, it would refine this analysis. Should you require further details or evaluation of related indicators, please provide specifics.
BULLISH - Short Term Breakout - Inverted Head and Shoulder Regarding the daily price forecast from July 28, 2025 (Monday), through August 1, 2025 (Friday), the projections are derived from the bull flag continuation pattern, cross-referenced with aggregated analyses from recent market data, technical indicators (such as RSI and MACD showing neutral-to-bullish momentum), on-chain metrics (indicating accumulation at $115,000–$117,000), and a distribution of expert predictions. These include short-term consolidation with a potential dip for liquidity clearance, followed by a breakout, aligning with historical post-halving cycles and institutional inflows. Note that cryptocurrency prices are inherently volatile and influenced by factors such as Federal Open Market Committee outcomes, ETF flows, and macroeconomic events; these forecasts are speculative and not financial advice.
• July 28, 2025 (Monday): Anticipated consolidation within the flag channel amid low weekend volume. Expected range: $116,800–$118,500. Key targets: Support at $116,700 (lower flag boundary, potential entry for accumulation); resistance at $118,500 (upper flag line, breakout watch level). Average closing prediction: $117,800, reflecting neutral sentiment with minor downside risk if global markets weaken.   
• July 29, 2025 (Tuesday): Possible test of lower support amid early-week volatility, potentially sweeping liquidity before rebounding. Expected range: $116,000–$119,000. Key targets: Downside at $116,000 (critical on-chain accumulation zone); upside at $119,000 (initial breakout threshold). Average closing prediction: $117,500, with a 40% probability of a brief dip followed by stabilization.   
• July 30, 2025 (Wednesday): Breakout attempt likely if support holds, driven by mid-week momentum and potential dovish policy signals. Expected range: $117,500–$120,500. Key targets: Support at $117,000 (mid-channel level); resistance at $120,000 (psychological barrier and prior high). Average closing prediction: $118,900, assuming bullish confirmation above $118,500.   
• July 31, 2025 (Thursday): Extension of upward movement post-breakout, with volume potentially increasing. Expected range: $118,500–$122,000. Key targets: Support at $118,000 (retest of breakout level); resistance at $121,000 (flagpole projection start). Average closing prediction: $120,200, supported by technical alignment and ETF inflow trends.   
• August 1, 2025 (Friday): Momentum continuation toward weekly close, with risk of profit-taking. Expected range: $119,500–$123,500. Key targets: Support at $119,000 (new floor post-breakout); resistance at $123,000 (extended target based on pattern measurement). Average closing prediction: $121,800, aligning with broader bullish forecasts for early August.   

BULL FLAG - Aug 1st Price prediction $121,300 In the interim, the bull flag pattern can be delineated as follows based on the uploaded chart: The flagpole is represented by the upward surge from approximately $113,332 (near the green label at the chart’s lower left) to around $121,351 (inferred from the upper candlestick highs and the red label near 121,351.18). The flag portion consists of a downward-sloping channel, with the upper trendline connecting the recent highs at roughly $120,500 to $118,000, and the lower trendline linking the pullback lows from about $118,500 to $116,700. A breakout above the upper trendline ($118,500–$119,000) would project an upward extension equivalent to the flagpole’s length (approximately $8,000), targeting $126,000–$128,000 in the near term, assuming confirmation through increased volume and sustained support above $116,700.
Regarding the daily price forecast from July 28, 2025 (Monday), through August 1, 2025 (Friday), the projections are derived from the bull flag continuation pattern, cross-referenced with aggregated analyses from recent market data, technical indicators (such as RSI and MACD showing neutral-to-bullish momentum), on-chain metrics (indicating accumulation at $115,000–$117,000), and a distribution of expert predictions. These include short-term consolidation with a potential dip for liquidity clearance, followed by a breakout, aligning with historical post-halving cycles and institutional inflows. Note that cryptocurrency prices are inherently volatile and influenced by factors such as Federal Open Market Committee outcomes, ETF flows, and macroeconomic events; these forecasts are speculative and not financial advice.
• July 28, 2025 (Monday): Anticipated consolidation within the flag channel amid low weekend volume. Expected range: $116,800–$118,500. Key targets: Support at $116,700 (lower flag boundary, potential entry for accumulation); resistance at $118,500 (upper flag line, breakout watch level). Average closing prediction: $117,800, reflecting neutral sentiment with minor downside risk if global markets weaken.   
• July 29, 2025 (Tuesday): Possible test of lower support amid early-week volatility, potentially sweeping liquidity before rebounding. Expected range: $116,000–$119,000. Key targets: Downside at $116,000 (critical on-chain accumulation zone); upside at $119,000 (initial breakout threshold). Average closing prediction: $117,500, with a 40% probability of a brief dip followed by stabilization.   
• July 30, 2025 (Wednesday): Breakout attempt likely if support holds, driven by mid-week momentum and potential dovish policy signals. Expected range: $117,500–$120,500. Key targets: Support at $117,000 (mid-channel level); resistance at $120,000 (psychological barrier and prior high). Average closing prediction: $118,900, assuming bullish confirmation above $118,500.   
• July 31, 2025 (Thursday): Extension of upward movement post-breakout, with volume potentially increasing. Expected range: $118,500–$122,000. Key targets: Support at $118,000 (retest of breakout level); resistance at $121,000 (flagpole projection start). Average closing prediction: $120,200, supported by technical alignment and ETF inflow trends.   
• August 1, 2025 (Friday): Momentum continuation toward weekly close, with risk of profit-taking. Expected range: $119,500–$123,500. Key targets: Support at $119,000 (new floor post-breakout); resistance at $123,000 (extended target based on pattern measurement). Average closing prediction: $121,800, aligning with broader bullish forecasts for early August.   

Perfect Sync: V Reversal Meets Bull Flag
Two clean and classic technical structures:
✅ V-Reversal Formation
✅ Bull Flag – still active and building pressure
After a sharp reversal, the price entered a bullish continuation phase.
Currently moving within the flag structure toward its upper edge.
If we see a breakout to the upside, the move could match the flagpole length, which aligns well with the target from the V-reversal pattern.
📍 Bullish scenario remains valid as long as we stay within structure.
📉 Breakdown below $570 invalidates this setup.
🧠 Important Reminder:
Enter only after a confirmed breakout.
✅ Apply strict risk management
✅ Never risk more than 1% of your capital on a single position.
Everything’s clear. No noise. Just wait for confirmation — let the market come to you.

Cup and handle patternBreaks cup and handle pattern and going up. Looks bullish. Make sure to do your own analysis and maintain your risk management. This is only for educational purposes
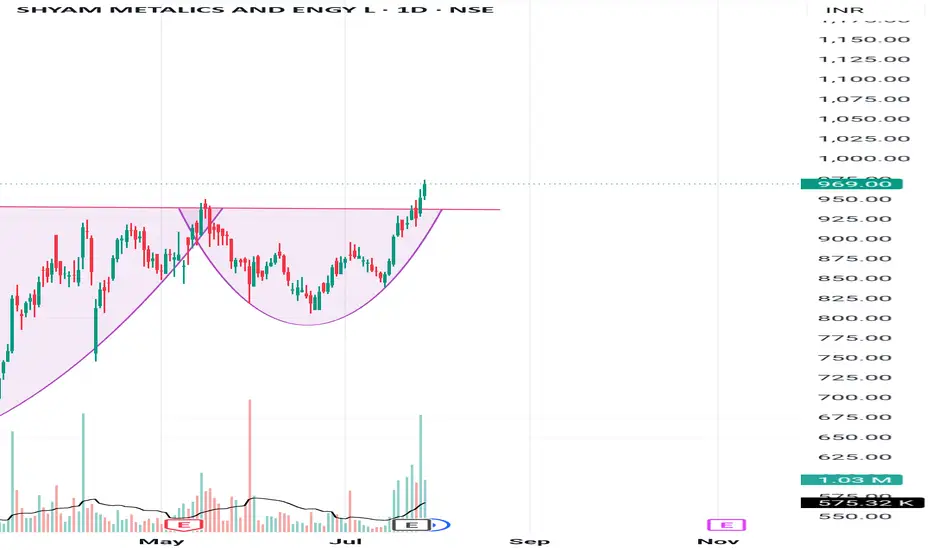
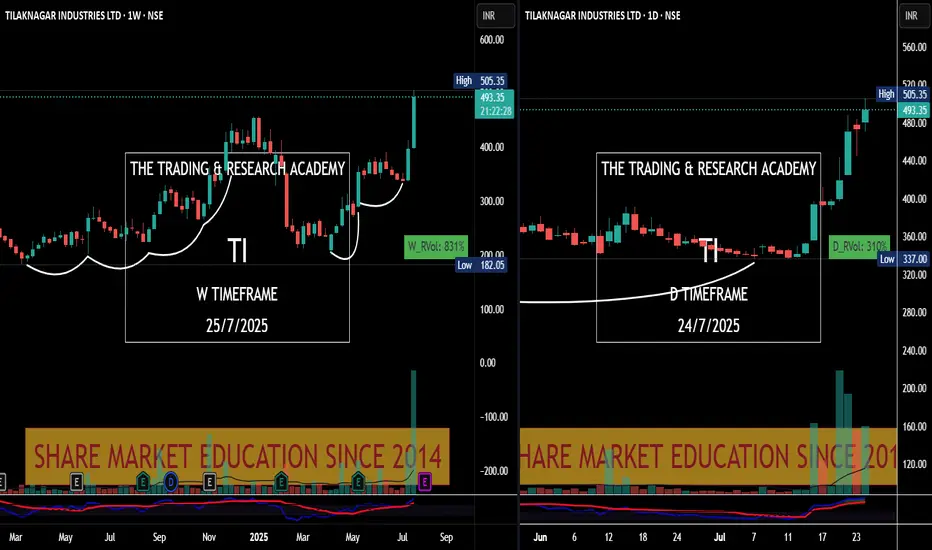
Chart Speaks- Tilak Nagar Ind
#Price leads the #News! Tilak Nagar Ind #tilaknagar see the chart v/s News.
News came yesterday, have a look at chart. Someone was accumulating it since long.
Chart Speaks
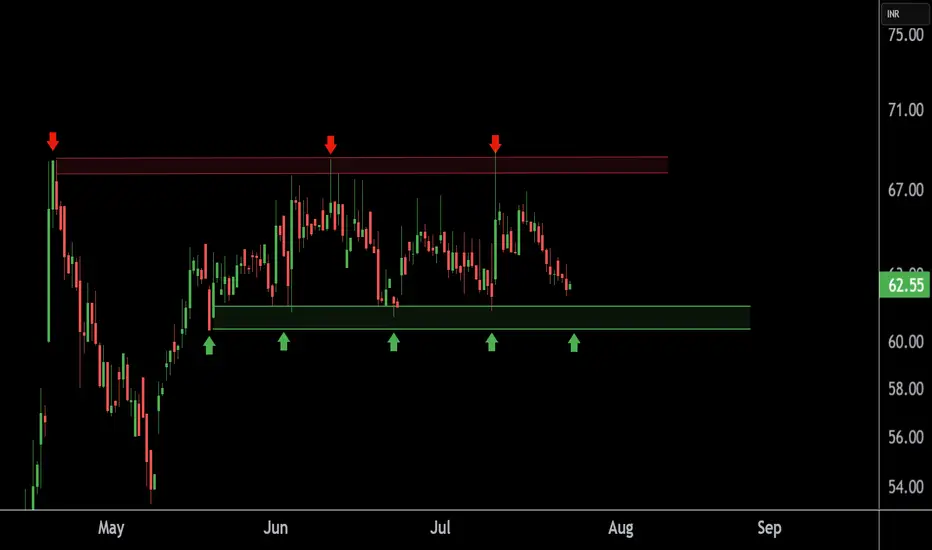
TEXMOPIPE Chart Speaks Strength – Buying Opportunity Near SupporThis is the 4 hour chart of TEXMOPIPES.
TEXMOPIPES having a good support zone near at 60 level.
If this level is sustain , then we may see higher prices in TEXMOPIPES.
Thank You !!
$BTC Macro UpdateBitcoin Macro Outlook BINANCE:BTCUSDT.P
Weekly
Bias & momentum remain bullish. Price is pressing toward new ATHs despite last week’s pullback.
Next macro target: ~$133,550 (extension of the current DeCode V-Range: 111,959.5 – 77,111.0).
A weekly close back inside that range (<111,968.0) = Failed Auction → serious red flag for reversal.
Daily
Clean rejection off the 21-Day Rolling VWAP + bounce at the structural HL V-Level (116,862.4).
A strong bullish engulfing today would set the tone for follow-through this week.
10-Hour
Structure is still bullish. Multiple Failed Auctions from ~116,960.0 are driving price toward the ATH.
Intraday
Choppy and hugging range lows → harder read. That behavior near balance edges triggers AMT Rule #5: “If time/volume builds at the edge of balance, price is likely to push through.”
Auction Market Theory – Quick Reminders
Price : advertises opportunity
Time : regulates opportunity
Volume : tells you if the auction is succeeding or failing
Rule #5 (above) is in play right now. Stay patient, wait for confirmation, and don’t FOMO.

IOTA / USDT looking good to buy at the price of $0.2100IOTA/USDT faced rejection from local horizontal resistance and is now heading for a retest of the lower support zone. If market conditions remain stable, the $0.2100 area looks like a solid buy zone. The structure suggests a healthy pullback before a potential strong bounce.

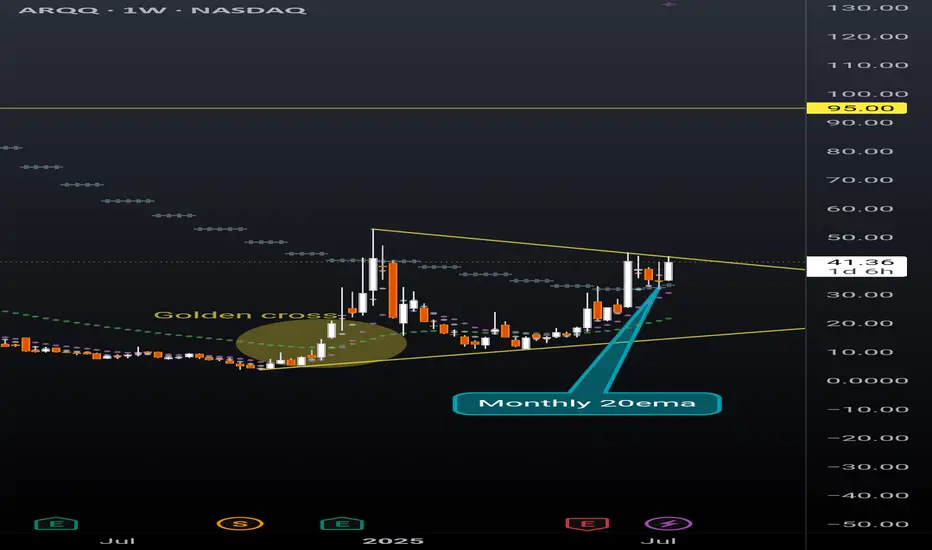
ARQQ weekly pennantBeautiful weekly pennant on ARQQ weekly timeframe. This chart is coiling nicely for a continuation. Still early in the process of reaching breakout but given the recent momentum in this sector a premature break to the upside can happen at any moment.
The ticker is currently sitting above the monthly 20ema (overlayed on this weekly chart), and just had a strong bounce off the daily 20ema (overlayed on this weekly chart). Golden cross is also highlighted that occurred in December 2024 with the daily 50ema retracing back to the daily 200ema and then continuing the uptrend earlier this spring.
NordKern - XAUUSD InsightNordKern | Simplified Insight OANDA:XAUUSD possible scenarios
Gold saw some upside today, primarily driven by softer TVC:DXY and trade deadlines ahead. To be specific:
1. Softer U.S. Dollar (DXY)
The U.S. Dollar Index fell ~0.1–0.2% today, making gold more attractive for international buyers
Kitco confirms the decline in USDX, paired with weaker Treasury yields, is fueling bullion demand.
2. Cautious Market Ahead of Trade Deadlines
Markets are bracing for the August 1 U.S. tariff deadline, especially involving the EU. Investors are positioning defensively, increasing safe-haven interest in gold.
Heightened trade tensions and uncertainty including possible Trump-Xi talks boost demand for safe assets.
3. Falling Treasury Yields & Fed Policy Expectations
The U.S. 10‑year Treasury yield has slipped (~4.37%), reducing gold’s opportunity cost and supporting its attractiveness.
Market pricing shows increasing odds of a Fed rate cut at next week’s FOMC meeting, something analysts like Christopher Waller suggested.
4. Geopolitical & Trade Risk Premiums
Escalating trade risk (tariffs looming) and geopolitical uncertainty are prompting safe-haven inflows into gold.
India’s MCX mirror those sentiments: gold rose ~0.5% on local contracts amid global trade nerviness.
To sum it up:
Gold is rallying today primarily because of the softer dollar, lower yields, and elevated trade risks ahead of the August 1 tariff deadline all of which reinforce its safe-haven allure.
Trade Setup - Shorts; if we retest 3370s
- We would primarily look to enter into lower risk buys on gold at more preferable levels such as 3370. After breaking to the upside from the consolidation area, a pullback and a retest to that area would not be out of the ordinary.
Trade Setup - Buys; if we break above 3400
- In case of the dollar remaining soft, we can expect gold to continue its upside rally without any major pullbacks. In this case, we would be looking for the breaks of 3400 and continue to hold until around 3345s.
Key Notes:
- Softer Dollar
- Possible retest of 3370s
- Watch for potential breaks of 3400
This remains a tactically driven setup. Manage risk appropriately and stay alert for any renewed political developments.

Reliance Industries — Preparing for the Next Bullish Leg !!There are two charts of Reliance Industries — one on the weekly timeframe and the other on the daily timeframe.
On the weekly timeframe:
Reliance industries is trading near (LOP), with a key support zone in the range of 1385–1400.
On the daily timeframe:
Reliance industries is moving in well defined parallel channel with support zone near at 1400-1410.the stock is also taking support at pivot levels S1 and S2, positioned between 1393 and 1422 levels.
If this level is sustain then we may see higher prices in Reliance industries.
Thank You !!

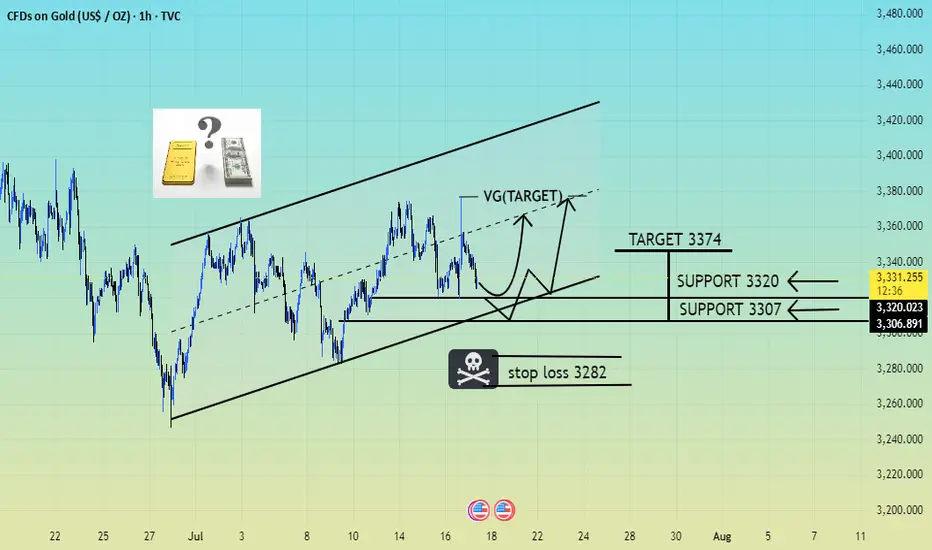
XAUUSD SELL OR TRAP (READ CAPTION)Hi trader's. what do you think about gold
current price: 3331
gold is working in bullish Parrallal channel under gold retest is down side 3320 and 3307 this is support market respect this zone and reject support and and h1 candle close in bullish so possible gold pump upside
support zone: 3320:3307
resistance zone :3345
supply 3374
please like comment and follow thank you
EURAUD 4H cup and handleEURAUD 4H cup and handle formed and possibly breaking out to the upside. Price recently found support off the daily 50ema (overlayed on this 4h chart) and is holding above the daily 10 & 20EMAs (overlayed).
I'm a cat not a financial advisor.

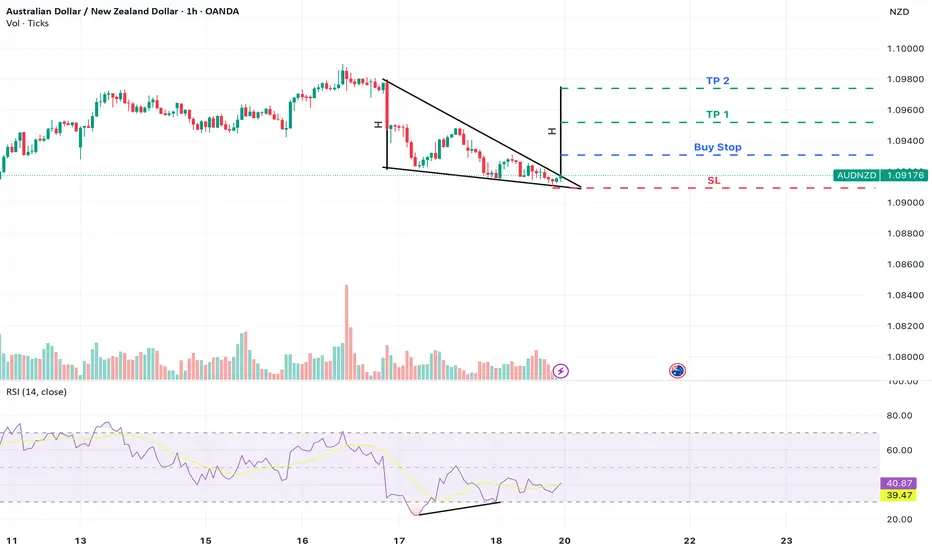
AUD/NZD – Falling Wedge Breakout with Bullish DivergenceAUD/NZD is currently forming a falling wedge pattern on the 1-hour timeframe, a structure typically associated with bullish reversals. Notably, bullish divergence on the RSI is developing while price continues to print lower lows, RSI is making higher lows, indicating weakening selling momentum.
Trade Setup:
Buy Stop Entry: 1.09309 (above recent Lower High — confirmation of breakout)
Stop Loss: 1.09094 (recent Lower Low )
Take Profit 1 : 1.09520
Take Profit 2 : 1.09740 (full pattern projection target)