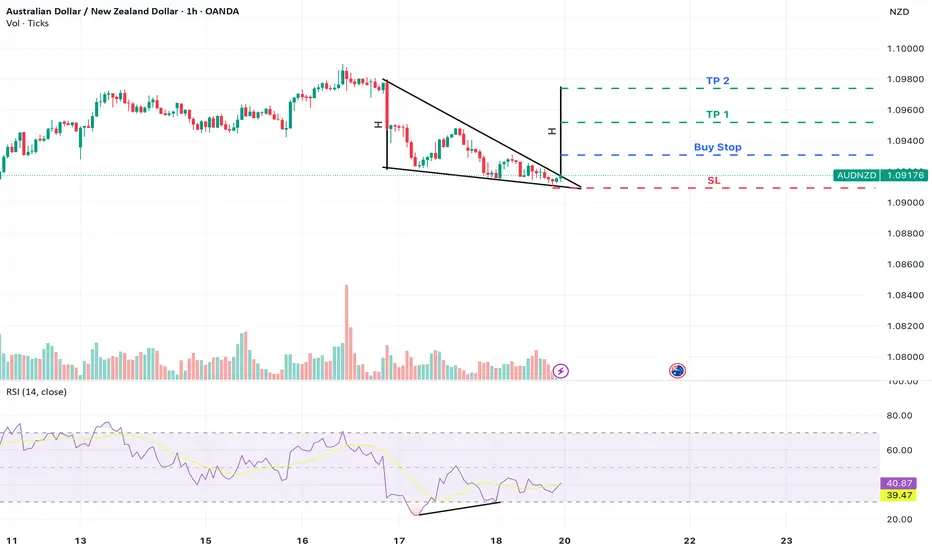
AUD/NZD – Falling Wedge Breakout with Bullish DivergenceAUD/NZD is currently forming a falling wedge pattern on the 1-hour timeframe, a structure typically associated with bullish reversals. Notably, bullish divergence on the RSI is developing while price continues to print lower lows, RSI is making higher lows, indicating weakening selling momentum.
Trade Setup:
Buy Stop Entry: 1.09309 (above recent Lower High — confirmation of breakout)
Stop Loss: 1.09094 (recent Lower Low )
Take Profit 1 : 1.09520
Take Profit 2 : 1.09740 (full pattern projection target)
Bullishpattern
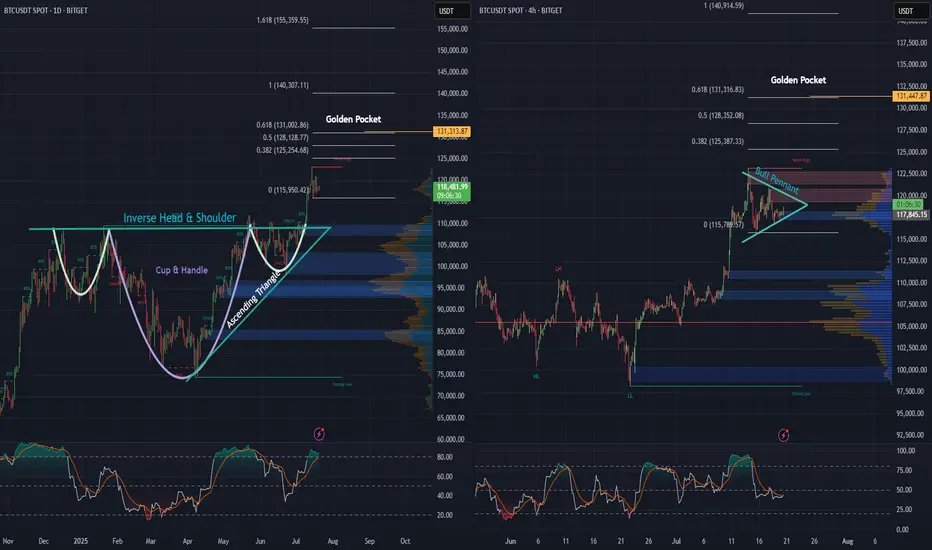
BTC daily, and 4 hr. Bullish Patterns Stack Up!Looking at the Daily and 4-hour charts for BTC, we can see multiple bullish formations unfolding.
An inverse head and shoulders - daily
A cup and handle - daily
An ascending triangle - daily
Price action looks strong, as we’ve begun the breakout from the neckline on the inverse H&S, as well as the cup and handle and ascending triangle simultaneously, and momentum is building fast.
Also, on the 4-hour chart, there’s a pretty substantial bull pennant taking shape. A breakout here could be the next leg up, and the push needed to keep momentum alive.
Zooming out, when we apply the trend-based Fibonacci extension, it reveals a $131,000 golden pocket, on both the the daily as well as the 4 hr. And that could be a major upside target if these bullish structures hold.
Stay tuned to see if BTC continues its move and sets a new all-time high.
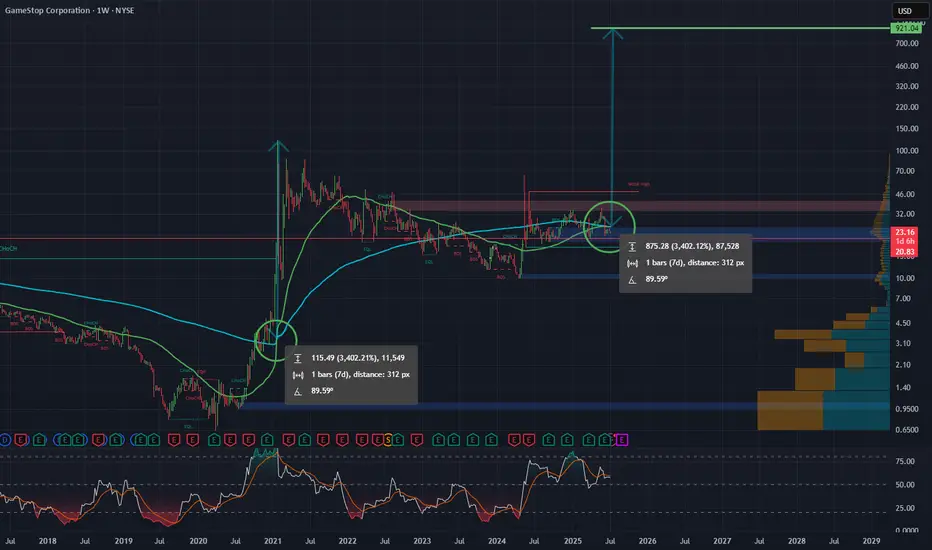
Golden Cross on GME WeeklyGME Chart Breakdown, Déjà Vu or Destiny? Something big just lit up the weekly chart, the 50 MA has pierced through the 200 MA, forming that golden cross traders dream about. On the weekly timeframe. Not a drill.
Now, let’s rewind. The last time this pattern appeared? January 2021. The infamous squeeze. Back then, GME didn’t just nudge upward, it catapulted nearly 4000%, going from a $3 floor to $120 in a blink.
Fast forward to today, new golden cross, new setup, and a $23 floor. If history rhymes even remotely, we’re staring down a hypothetical $1000 per share move. Yes, one thousand.
Is lightning about to strike twice? Stay tuned to find out!
Double Bull Flags on an Ascending Triangle breakout on the dailyDaily, double Bull Flag, on top of an Ascending Triangle Breakout. Golden Pocket on the Fib Ext is $588 🥂

Is it finally time for a rally?Looking at NVIDIA (NVDA) on the weekly chart over the past two years, a significant gap up becomes apparent around April, which persisted for much of the year. Considering the recent news and the stock's pullbacks lately, this may be the moment for NVDA to resume its upward grind. The coming weeks will reveal its direction.
Additionally, it's worth noting the formation of a massive bull pennant on the weekly chart. If history repeats itself and this pattern holds, the next 2 to 6 weeks could prove to be a thrilling period for NVDA.

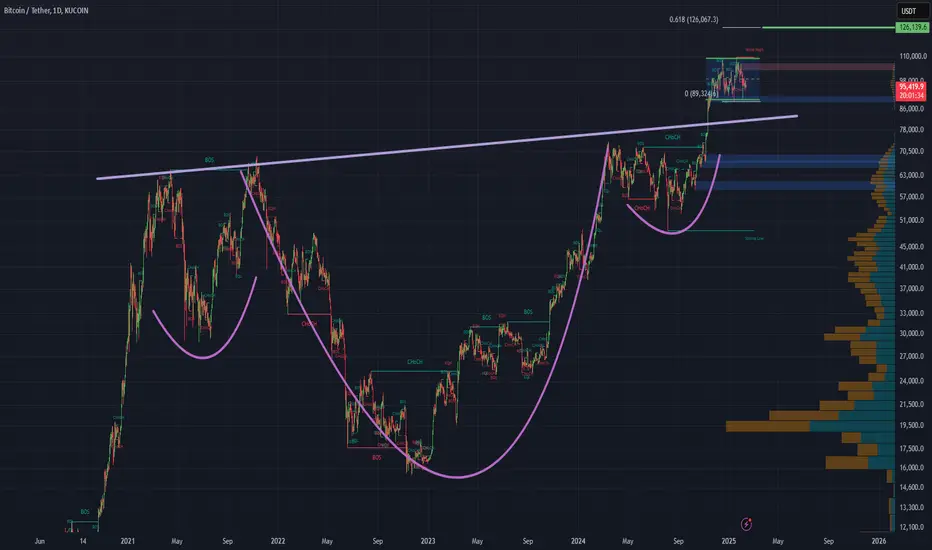
Bitcoin: Promising Patterns and Potential BreakoutBitcoin's recent price action has been nothing short of captivating for traders and analysts alike. On the daily chart, we've observed the formation of an Inverse Head & Shoulders and a Cup & Handle pattern, both of which have now transitioned into a Bull Flag. These bullish signals suggest a strong potential for upward movement.
Zooming into the 4-hour and 1-hour charts, we can see prominent Ascending Triangles taking shape. These patterns are often harbingers of significant breakouts, and it appears that Bitcoin is winding up for a substantial move.
Moreover, when utilizing a Trend-based Fibonacci Extension on the daily timeframe, the golden pocket points to a target of $126k, with the next pocket at $185k. This aligns with historical data and technical indicators, suggesting that Bitcoin might be poised to rewrite history once again.
Stay tuned as we monitor these developments and anticipate what could be a historic breakout for Bitcoin!
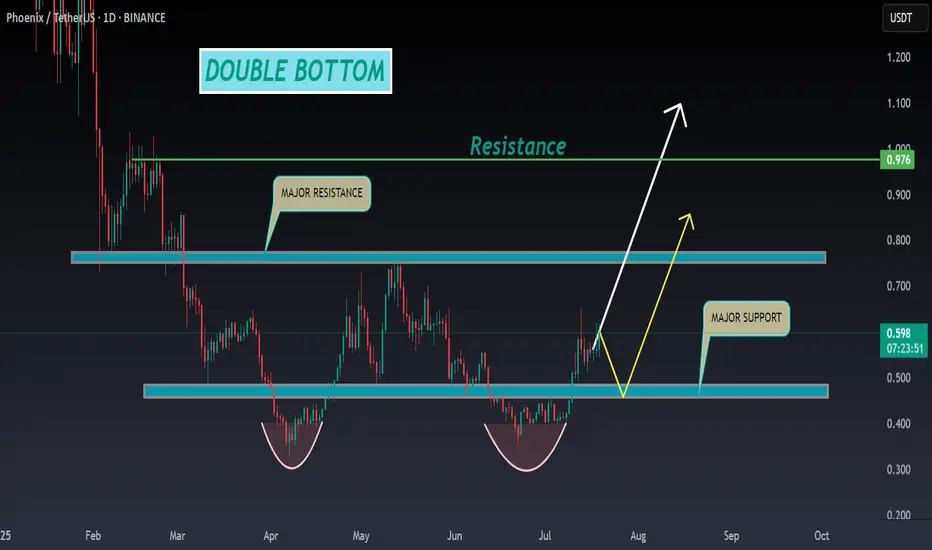
PHB ANALYSIS🔮#PHB Analysis :
📈📈 #PHB is making perfect Double Bottom Pattern. We can see a good pump if #PHB breakout the major resistance zone with good volume and sustains the higher price after breakout 🚀🚀
📊 Current Price: $0.595
⏳ Target Price: $0.780
⁉️ What to do?
- We can trade according to the chart and make some profits in #PHB. Keep your eyes on the chart, observe trading volume and stay accustom to market moves.💲💲
#PHB #Cryptocurrency #Pump #DYOR #Breakout
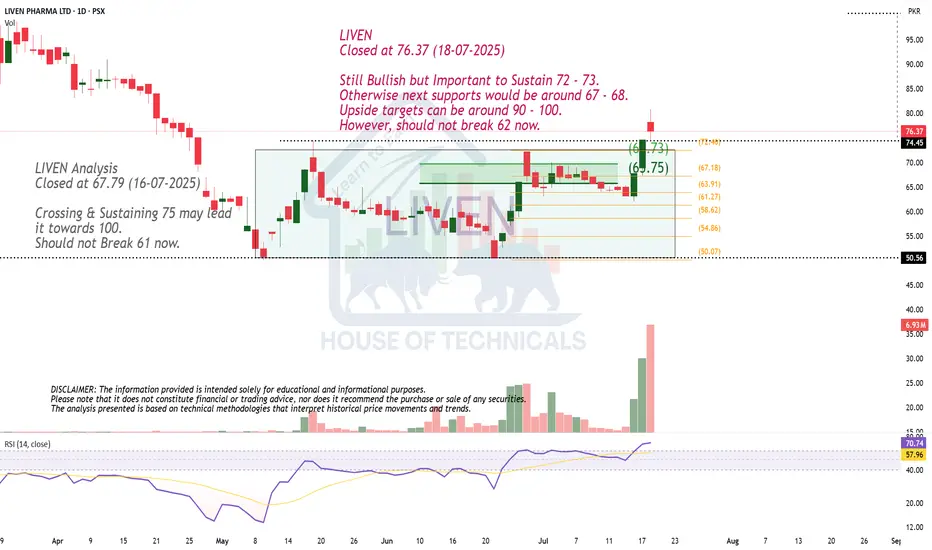
Still Bullish but ..LIVEN
Closed at 76.37 (18-07-2025)
Still Bullish but Important to Sustain 72 - 73.
Otherwise next supports would be around 67 - 68.
Upside targets can be around 90 - 100.
However, should not break 62 now.
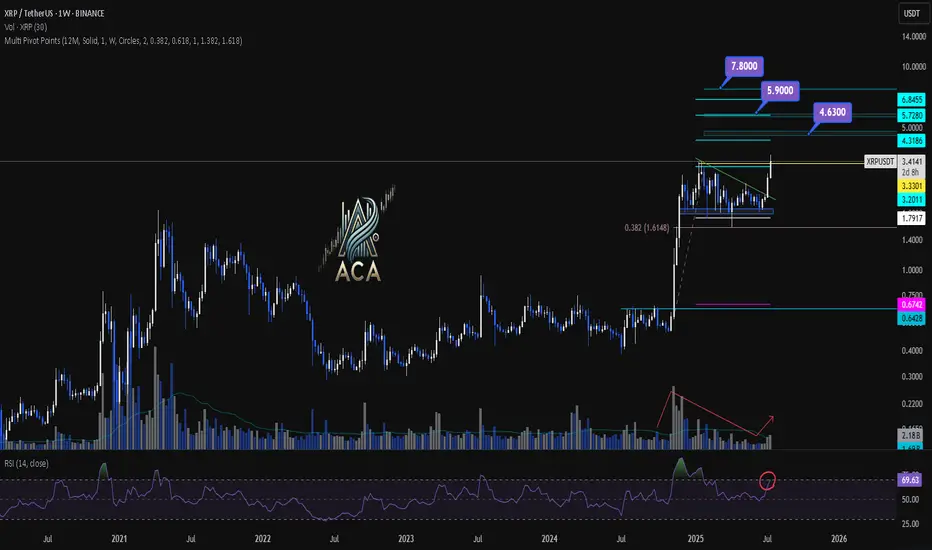
XRPUSDT Weekly Chart Analysis | Next Bullish MoveXRPUSDT Weekly Chart Analysis | Major Resistance Levels Align for Next Bullish Move
🔍 Let’s break down the XRP/USDT weekly setup, highlighting key technical signals and major upside targets for the next rally.
⏳ Weekly Overview
The weekly chart shows consolidation just below a major resistance, with price action tightening and preparing for a breakout. A recent correction found support near the 0.382 Fibonacci retracement level, which has acted as a springboard for renewed momentum. Notably, the R2 pivot point level aligns closely with this area, strengthening its importance as a decision zone for bulls.
🔺 Upside Targets & Confluences:
- First Target: $4.63 — This coincides with the R2 monthly pivot point and aligns with key Fibonacci extension targets, offering strong confluence for a reaction zone.
- Second Target: $5.90 — Our most realistic medium-term target, also backed by cluster resistance from both pivot analysis and fib projections.
- Final Target: $7.80 — This is the major Fibonacci extension level, marking the highest projected upside if momentum persists.
📊 Key Technical Highlights:
- Pivot Point R2 & Fibonacci Confluence: The R2 level reinforces a critical resistance, overlapping with the $4.63 Fibonacci target.
- Fibonacci Retracement: Price respected the 0.382 retracement during the latest correction, signaling healthy trend continuation.
- Volume Confirmation: An uptick in volume confirms that buyers are stepping in, supporting the bullish momentum.
- RSI Signal: RSI is entering the overbought zone, which typically indicates a strong surge in buying pressure and can mark the start of a momentum move.
🚨 Conclusion:
XRP is setting up for a major breakout as key technical levels align. Watch for a sustained move above $4.63 to unlock the $5.90 area, with a final potential push towards $7.80 if bulls maintain control. Volume expansion and an overheated RSI are both classic signs of an incoming momentum wave—keep your eyes on these levels for validation of the setup.
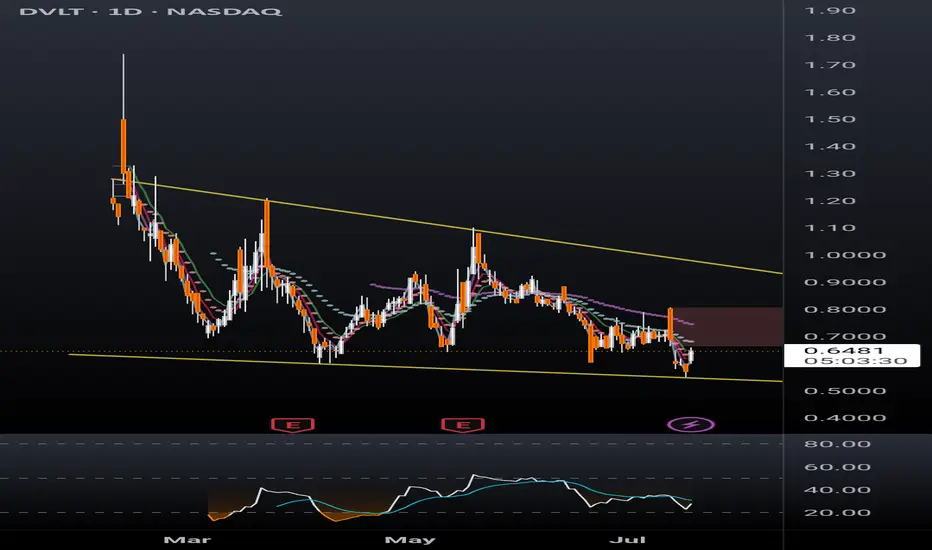
DVLT falling wedge, TP $1+DVLT a relatively new ticker is already drawing a lot of attention. Up 13% today after hitting new all time low yesterday, sure to catch a lot of eyes from retail investors. With recent news releases such as a licensing agreement with IBM, a lawsuit against naked short selling, and US patent allowances, target prices have been announced ranging from $3 to $11/share.
Disclaimer, this ticker is PRONE TO HEAVY DILUTION, however in order to remain listed on NASDAQ the SP will have to hit $1 and remain there. This being the case, the company must have something in the books to break upward out of this falling wedge and give shareholders a reason to stay with the company long term.
I'm just a cat not a financial advisor.
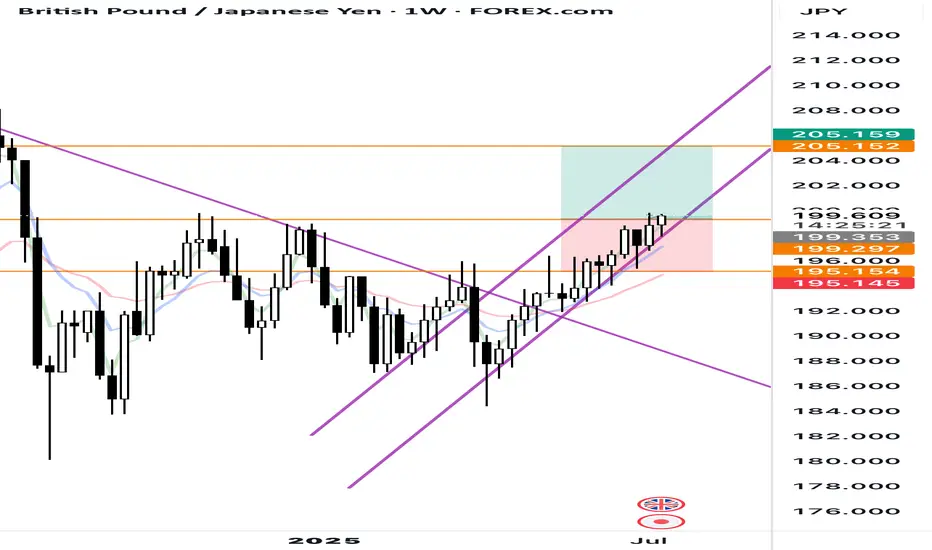
GBPJPY long outlook Looks like we just broke resistance area now heading up to next resistance area level.
I have set some support and resistance lines to project my outlook .
What do you it’s think?
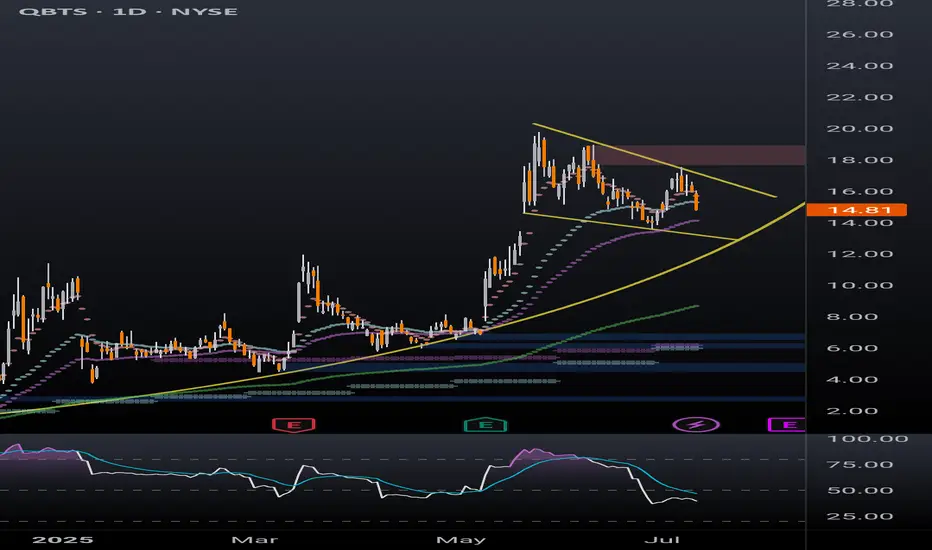
QBTS bull flag dailyBetter look at quantum computing ticker QBTS bull flag on the daily timeframe. Previous post looked at the weekly timeframe to highlight the bullish momentum. Lots of retail money piled into this one in the last few months, a breakout of this bull flag will likely be followed by a parabolic move.
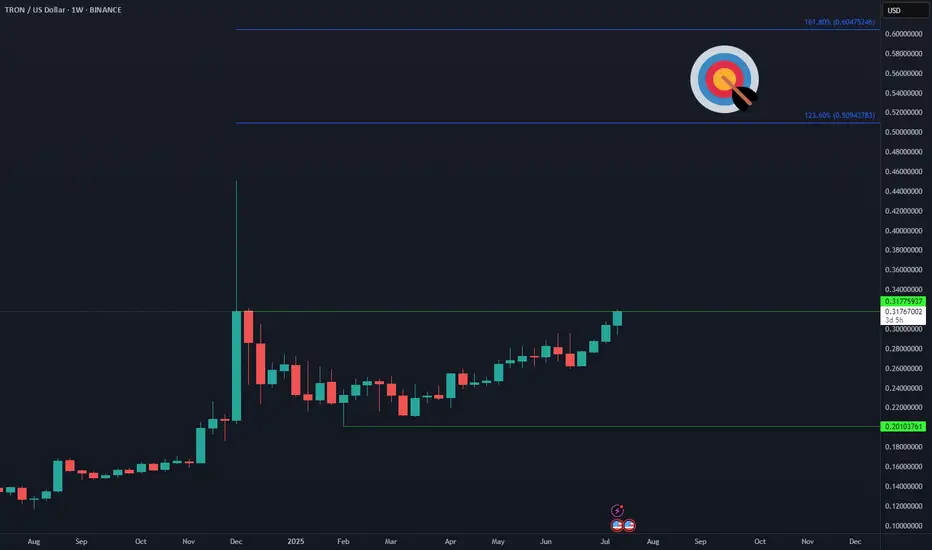
TRON TRX Eying New ATH📈 After 6 months of sideways accumulation, CRYPTOCAP:TRX is finally picking up momentum. A weekly close above $0.317 could trigger acceleration toward the next targets at $0.50–$0.60 🚀
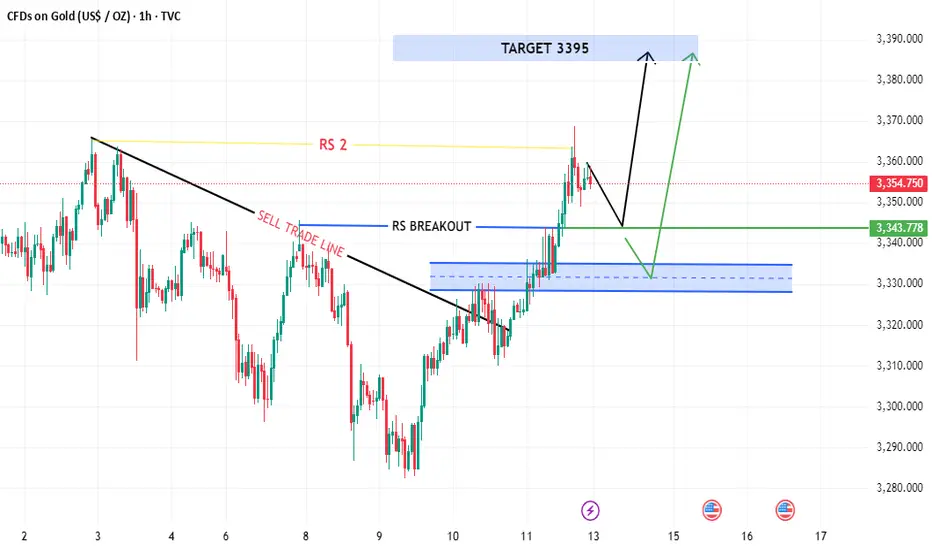
XAUUSD NEXT MOVE (READ CAPTION)Hi trader's. what do you think about gold market
current price : 3354
gold Friday breakout sell trade and gold breakout resistance 3345 and close above 3345 and gold just retest downside then he taking support and pump upside gold breakout 3365 then gold next move 3395
support zone: 3343:3330
resistance zone :3365
target 3395
stop loss: 3310
please like comment and follow thank you
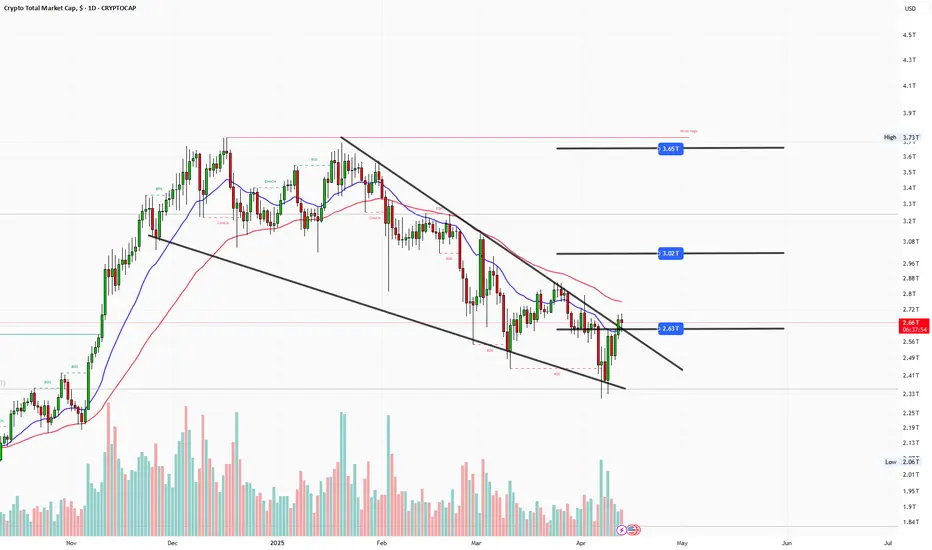
Total crypto MC - 1DThe total crypto market capitalization on the daily timeframe has formed a Falling Wedge pattern, which is typically a bullish reversal pattern. The price has broken out above the upper resistance line of the wedge, confirming the breakout. Currently, the price is undergoing a retest of the breakout level, which now acts as support. If this support holds successfully, it is expected that the market will experience an upward move in the near term, signaling potential bullish momentum.
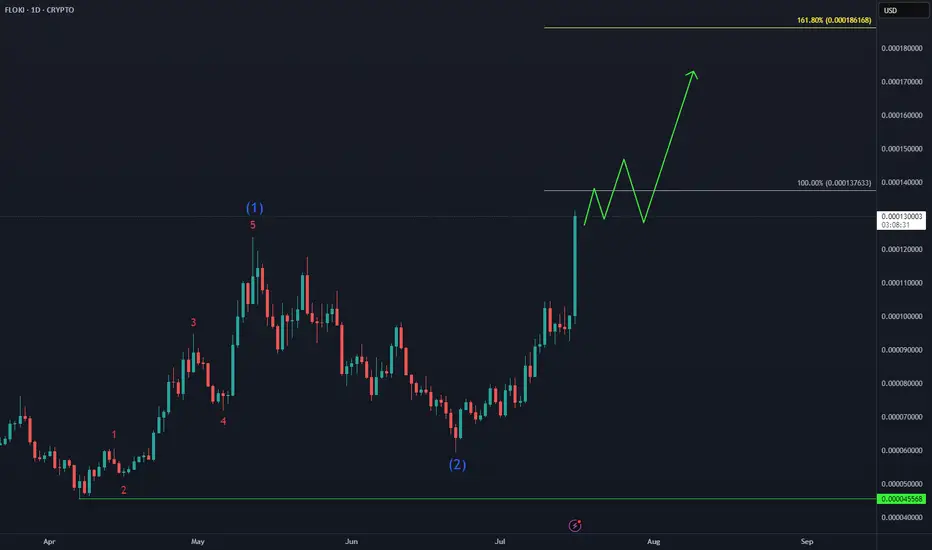
FLOKI Isn’t Missing the Party🚀 CRYPTO:FLOKIUSD Price has broken above the May peak, confirming a bullish continuation. With momentum building, price is now eyeing the next upside target near $0.00018.
#elliottwave #memecoins #altseason
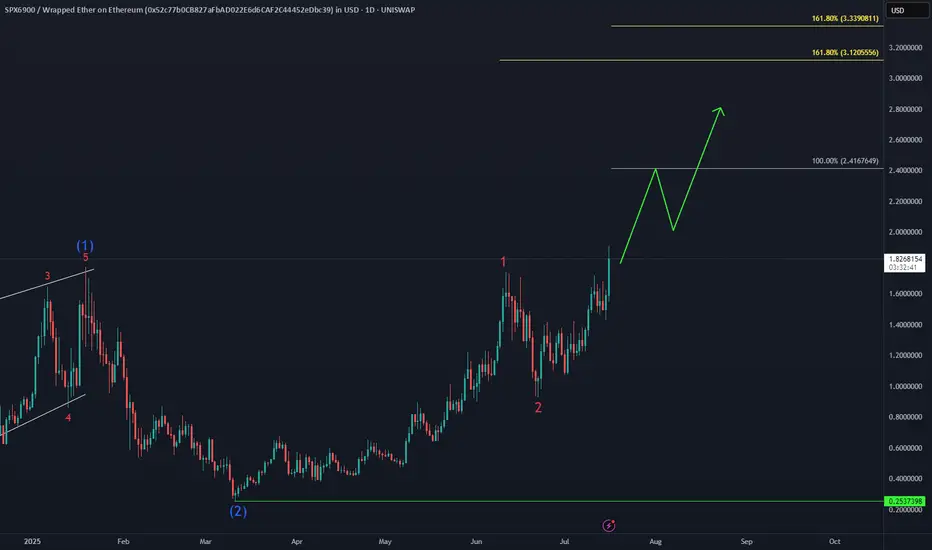
#SPX6900 Bullish SequenceThe Gate Is Open – Send It 🚀🚀🚀
UNISWAP:SPXWETH_52C77B.USD just smashed into a new all-time high, unlocking the next bullish targets at $2.4 and $3.1.
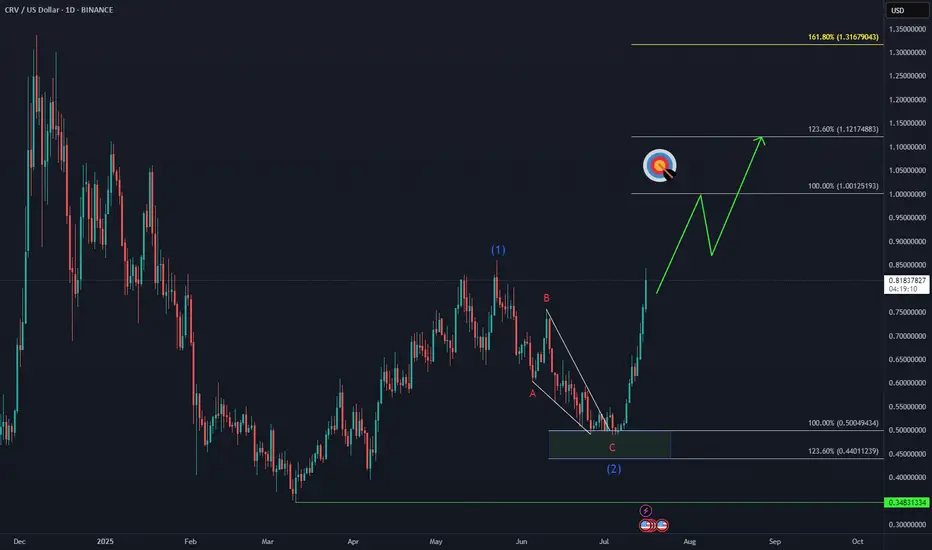
CRV Marching Toward Target📈 CRYPTO:CRVUSD is approaching a key breakout level, with bulls aiming to surpass the May peak and reach the $1.00 initial target.
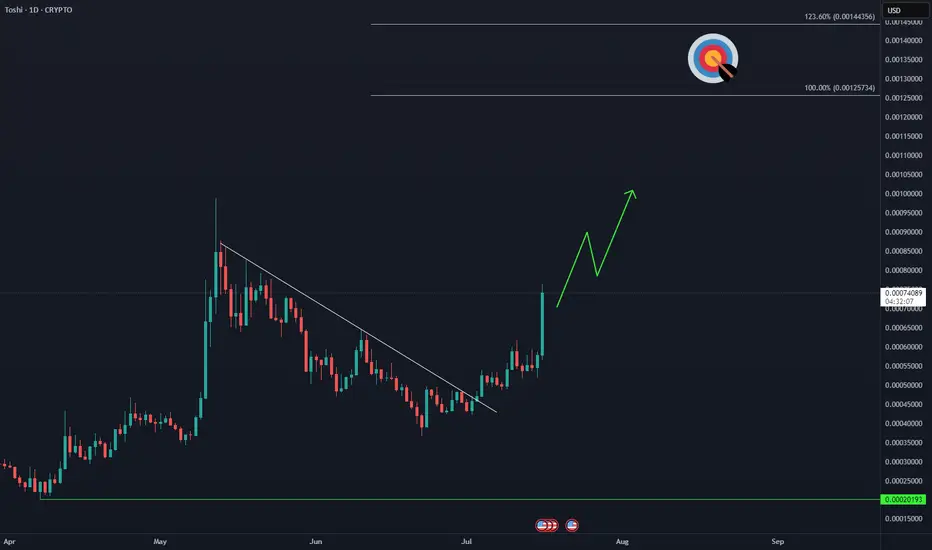
TOSHI Bulls on the Move🚀 COINBASE:TOSHIUSD is showing signs of acceleration, aiming to break above the May peak and extend toward the $0.0012 target zone.
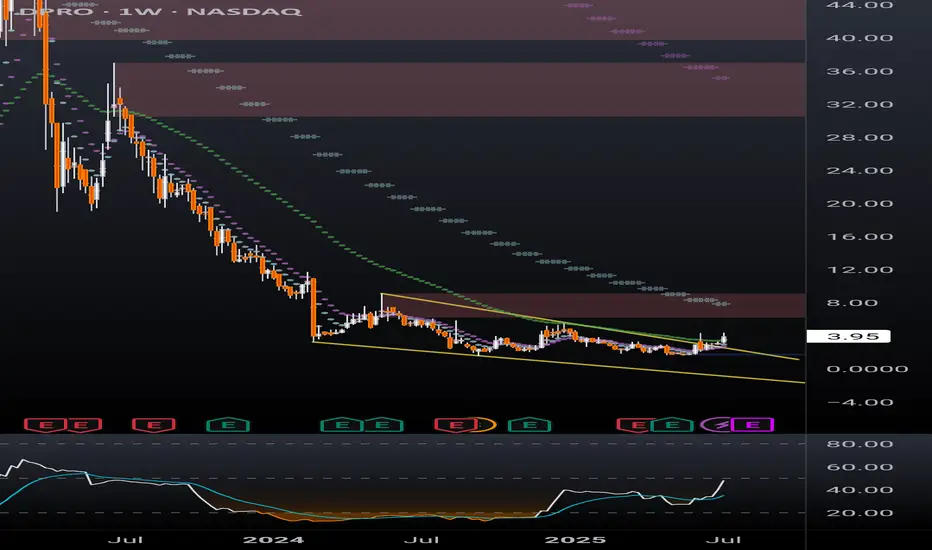
DPRO falling wedge breakoutDPRO has broken out of a falling wedge on the weekly. Ticker will respond well to Trump's "Big Beautiful Bill" which includes over $30 billion for defense/military spending. The drone company is already making progress with US military projects and is setting up for a strong rally.
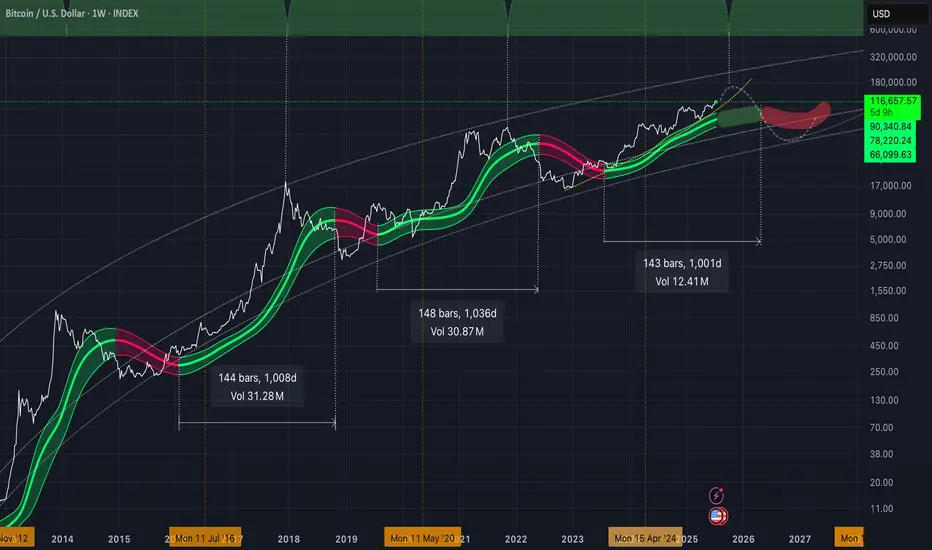
Gaussian suggesting the last leg to the upside!As we approach close to the ~1000 days of bull market conditions above the green GC. Volatility to the upside should be coming before peaking at some point probably in October. Make sure to sell some coins before we get back to the core of the Gaussian. We could be seeing the price tank from 40k-50k later next year. Cheers!
When does Bolran start?Read carefullyhello friends👋
💰Many of you are asking when Bolran will start or if it will start at all, we decided to explain it to you in a full post.
Well, you can see the Ethereum chart moving in a channel, and with a drop, it created a big fear that a fall is coming, and meanwhile, the buyers returned the price to above 2000 dollars with a strong and unexpected return.
✅️Now the price is stuck in the specified box between 2200 and 2500, and if this range is maintained, the price will easily move up to the range of 3200 in the first wave, and if it fails to maintain this range, the price will fall below 1500 dollars.
🧐Now, in our opinion, due to the rapid return of the price from the channel, this failure is a fake channel and the range will be maintained, and we are likely to see Ethereum rise in the coming weeks.
🤔You know that Ethereum is the leader of altcoins, and if it grows, important altcoins will grow, which is the beginning of Bolran, and there are important altcoins that can be used for good profit.
🌟You can join us if you like.🌟
🔥Follow us for more signals🔥
*Trade safely with us*

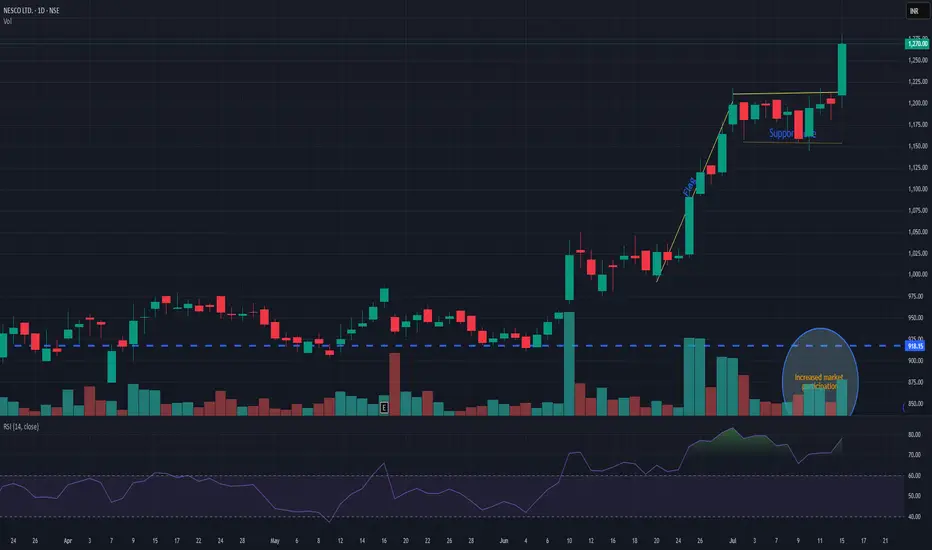
NESCONESCO giving flag pattern breakout with decent volume. Support is seen nr 1180. while pole initiation can be seen near 1010. Currently trading near 1270. It has a potential for new momentum. Keep it on radar.