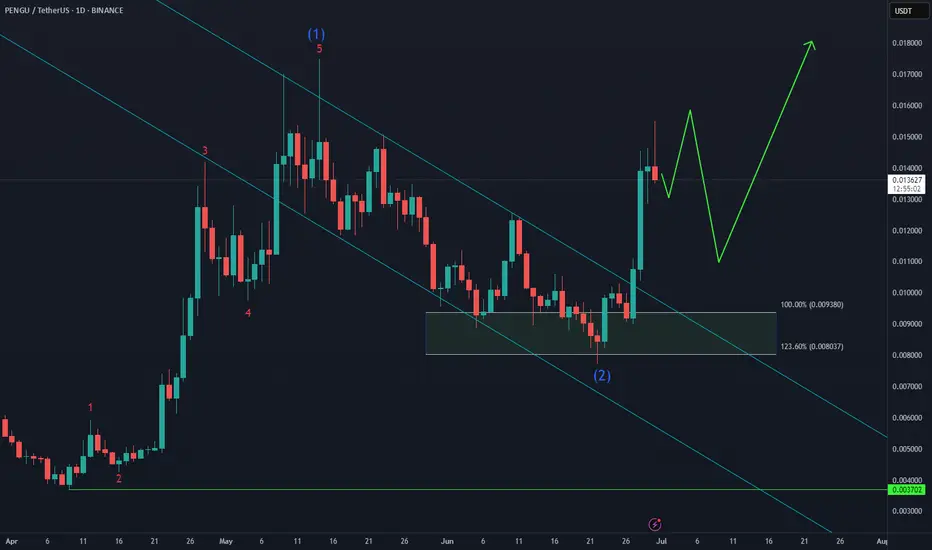
Pudgy Penguins PENGU Bullish Reversal Taking Shape🐧 Pudgy Penguins BINANCE:PENGUUSDT has bounced twice from the $0.009–$0.008 buying zone, showing resilience despite the choppy structure. As long as the June low holds, the setup favors a higher low formation next month, potentially setting the stage for the next impulsive leg higher.
Momentum is building — now it’s about follow-through and confirmation.
Bullishpattern
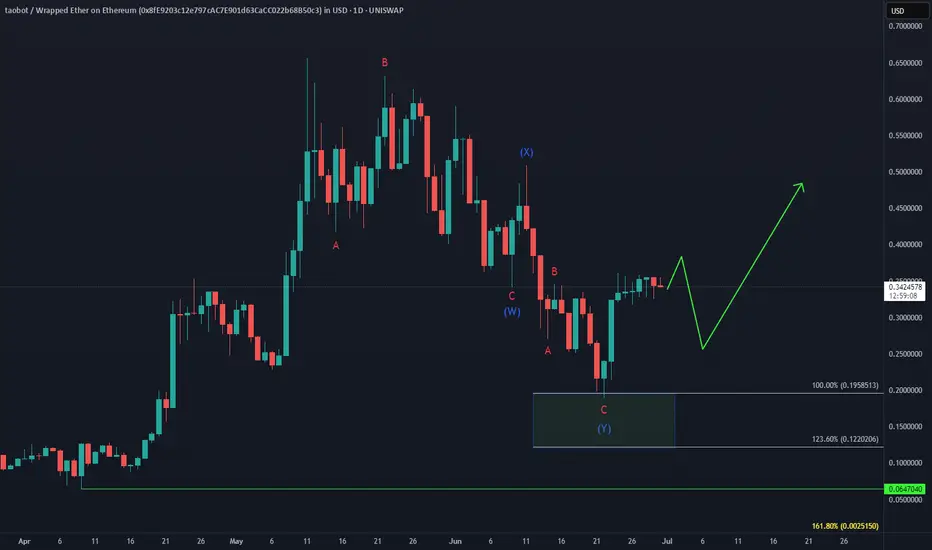
TAOBOT Bullish ReversalWill UNISWAP:TAOBOTWETH_8FE920.USD outperform BINANCE:TAOUSD ?
After the failed early June bounce, price completed a double correction into the $0.195–$0.12 equal legs zone, triggering a sharp 90% reaction higher.
As long as $0.19 holds, the setup favors continuation to the upside, with a break above the May peak in focus.
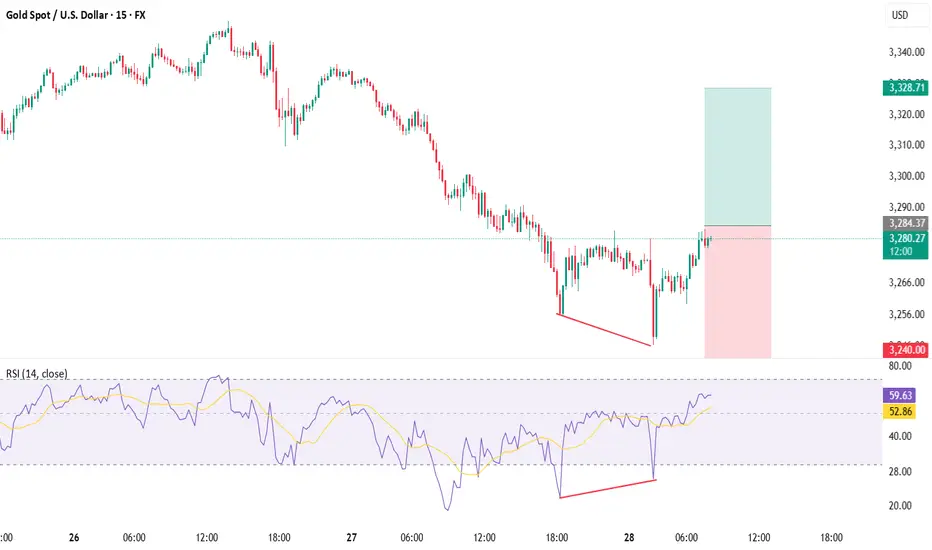
XAUUSD📉 The Setup: Bullish Divergence on XAUUSD (15m/30m)
Buy only on Breakout
🔍 Observation:
On the 30-minute timeframe, price made a lower low while the RSI indicator printed a higher low — classic sign of bullish divergence 🔄.
💡 Translation: Bears are losing steam! Bulls may be preparing to charge in! 🐂⚡
📊 Trade Plan – Long Entry

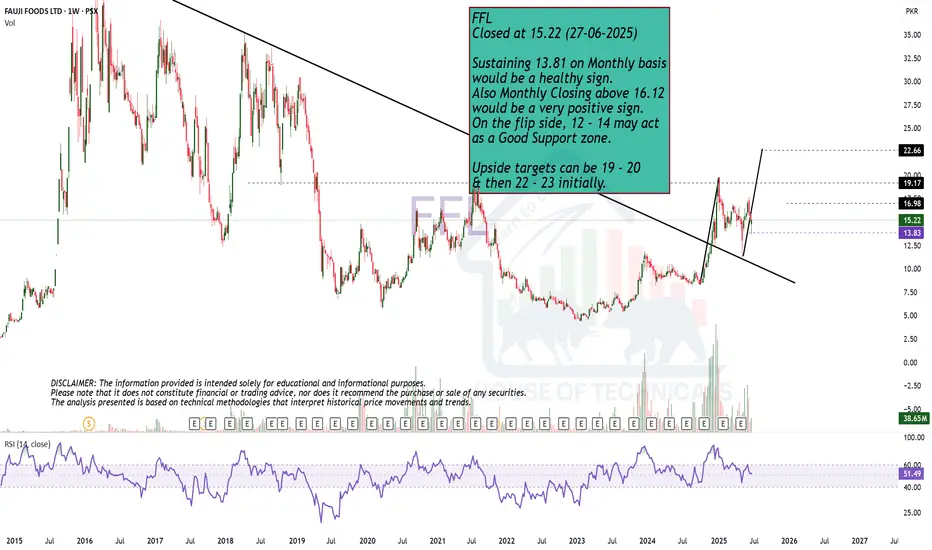
Strong Stock!FFL
Closed at 15.22 (27-06-2025)
Sustaining 13.81 on Monthly basis
would be a healthy sign.
Also Monthly Closing above 16.12
would be a very positive sign.
On the flip side, 12 - 14 may act
as a Good Support zone.
Upside targets can be 19 - 20
& then 22 - 23 initially.
EUR/JPY Analysis – Flag Breakout Signals Further UpsideHello Traders,
It's been a while. I trust you are good.
Kindly find below my analysis of EURJPY currency pair.
Overview:
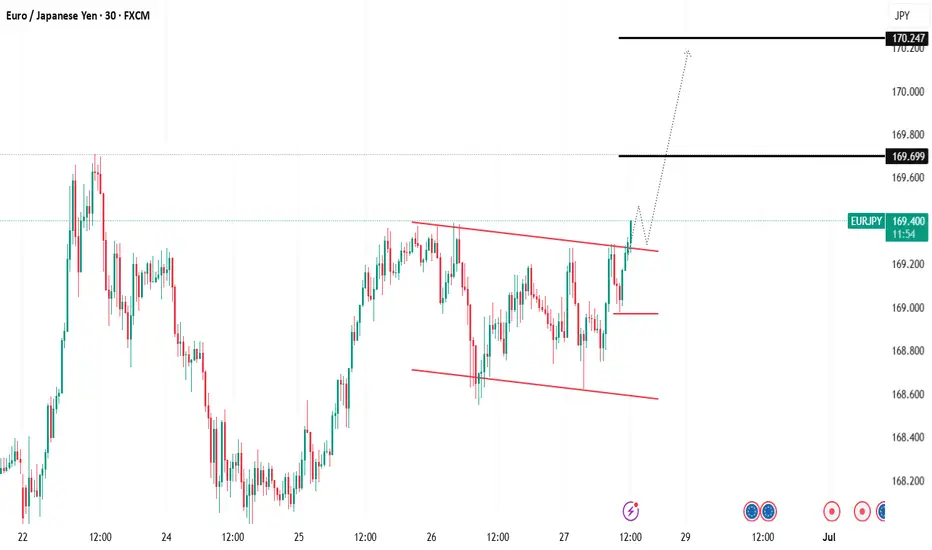
EUR/JPY has been consolidating within a bullish flag pattern, characterized by lower highs and lower lows over the past few trading sessions. Price action has now broken above the flag’s resistance, indicating a possible continuation of the broader bullish trend.
Idea:
The breakout above the bullish flag suggests that bulls are regaining control. Price is currently hovering around 169.370, having just cleared the wedge’s resistance line.
Key levels to monitor:
1. Support Zone: Around 169.200–169.300
2. Resistance Level: 169.699
Trade setup:
Entry: On a successful breakout or break and retest of 169.200–169.300.
Stop Loss: Below 168.816 (beneath the flag's support and recent swing low).
Targets: TP1: 169.699, TP2: 170.000–170.200
Conclusion:
EUR/JPY has broken out of a bullish flag pattern, signaling momentum shift in favor of buyers. If price sustains above the breakout zone or clears 169.699 resistance, we may see an extended rally toward the 170.000 mark. Trade with caution.
Cheers and happy trading.
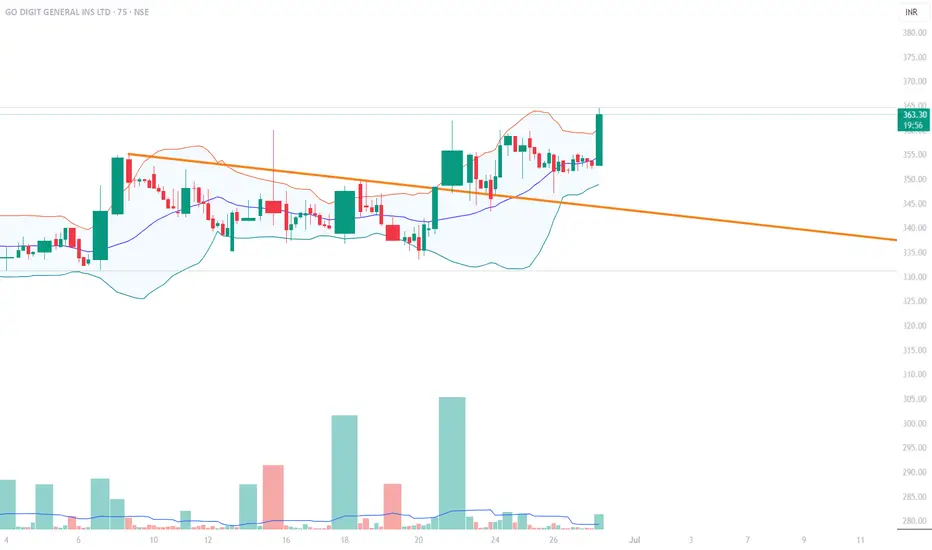
GODIGIT!GODIGIT READY FOR BLAST! SHARP CONSOLIDATION AND BREAKOUT READY TO MAKE A UPWARD MOVE! STOPLOSS 345 AND TARGET 400!
Pls note all the messages posted are for study and guidance purpose
Please consult your financial advisor before investing ⚠
Two Possible #BTC Scenarios: July ATH or September Bull Run?#BTC
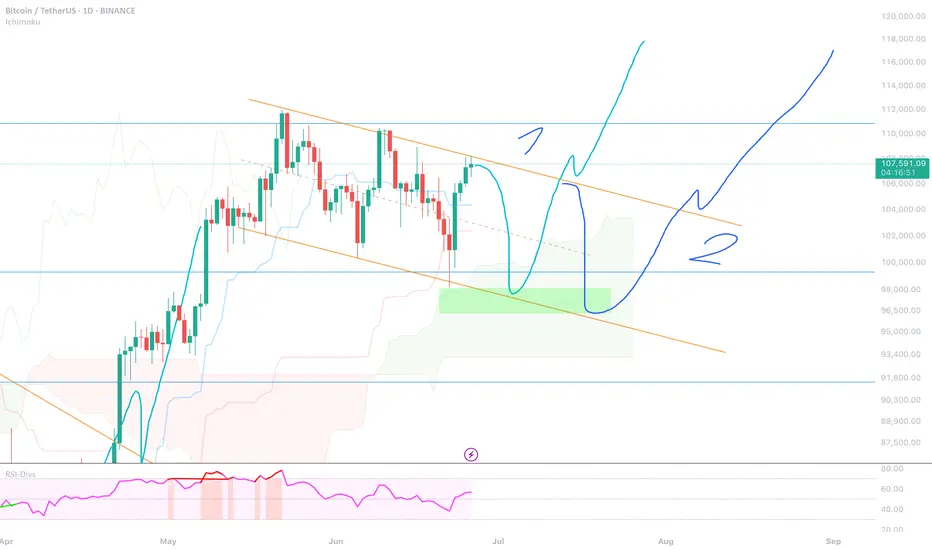
#1First Scenario: A pullback to $98K first, followed by a breakout from the Bull Flag pattern targeting $120K and a new ATH by the end of July.
#2Second Scenario: Another pullback, some consolidation to build strength, then a move to a new ATH and a full-fledged bull run into September. In this case, we might rally straight up to $130K without major corrections.
NC HAMMER CRYPTOOn my videos posted on another platform that starts with a Y. You can see once it breaks the wedge it typically has a bullish outcome. Good luck and have fun with it.
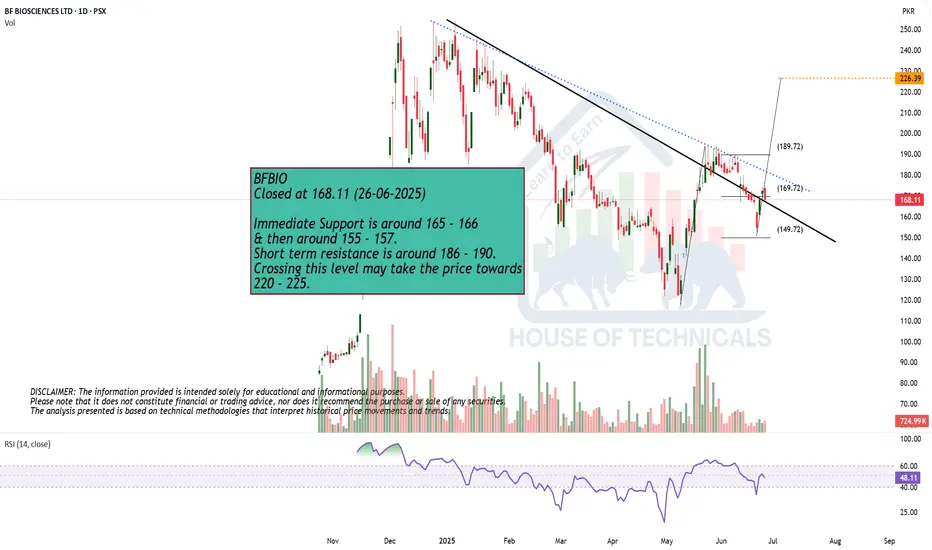
Play on LevelsBFBIO
Closed at 168.11 (26-06-2025)
Immediate Support is around 165 - 166
& then around 155 - 157.
Short term resistance is around 186 - 190.
Crossing this level may take the price towards
220 - 225.
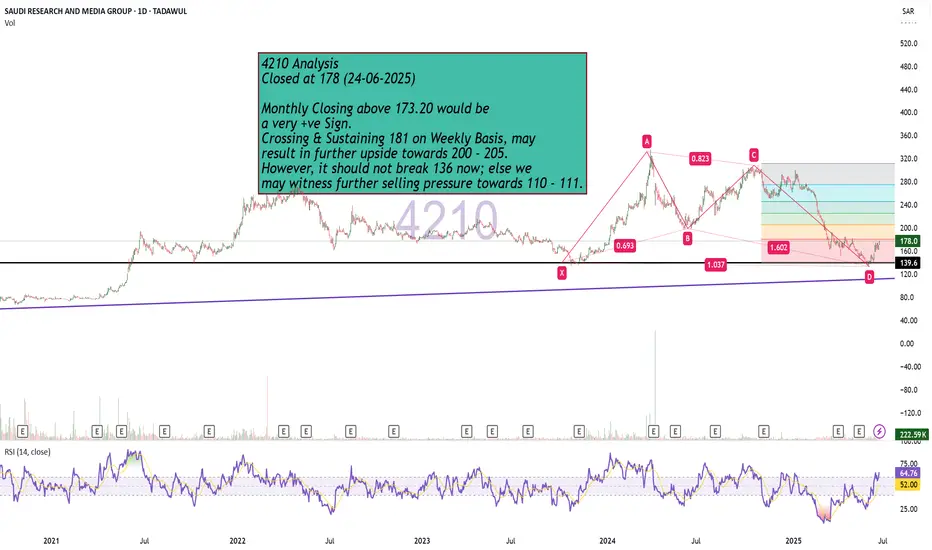
Bullish Monthly Candle Expected?4210 Analysis
Closed at 178 (24-06-2025)
Monthly Closing above 173.20 would be
a very +ve Sign.
Crossing & Sustaining 181 on Weekly Basis, may
result in further upside towards 200 - 205.
However, it should not break 136 now; else we
may witness further selling pressure towards 110 - 111.
BALAJI AMINES PURE REVERSAL ON CHART.Balaji Amines Ltd. is a leading Indian chemical manufacturing company, primarily engaged in the production of methylamines, ethylamines, and their derivatives, along with specialty chemicals and pharma excipients. It holds a strong position in the aliphatic amines segment and is even the sole producer of certain specialty chemicals in India.
INVERSE HEAD & SHOULDER BREAKOUT AND CONSOLIDATION AT PULLBACKS SHOWS STRONG MOMENTUM FOR UPWARDS
A breakout above 1486 could trigger momentum toward 1524 and beyond towards 1775-1906
On the downside, keep an eye on support near 1330–1358.

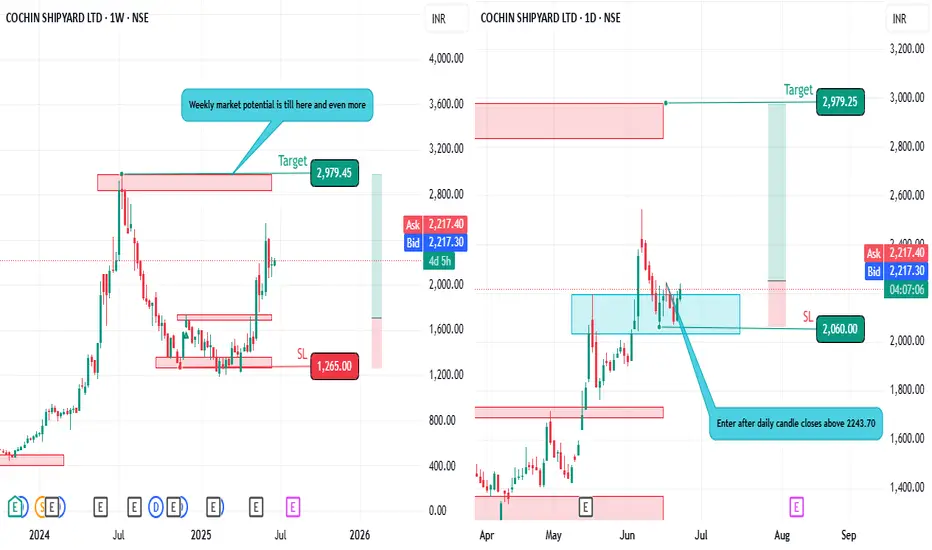
Good move is expected soonhi fellas,
The Weekly trend of cochin shipyard is solid and bullish.
At daily timeframe there is a swing whose target can be till the weekly resistance level as mentioned in the chart.
The risk : reward ratio is 1:3.87
Enter after the daily candle closes above 2243.70
SL and target is mentioned in the chart.
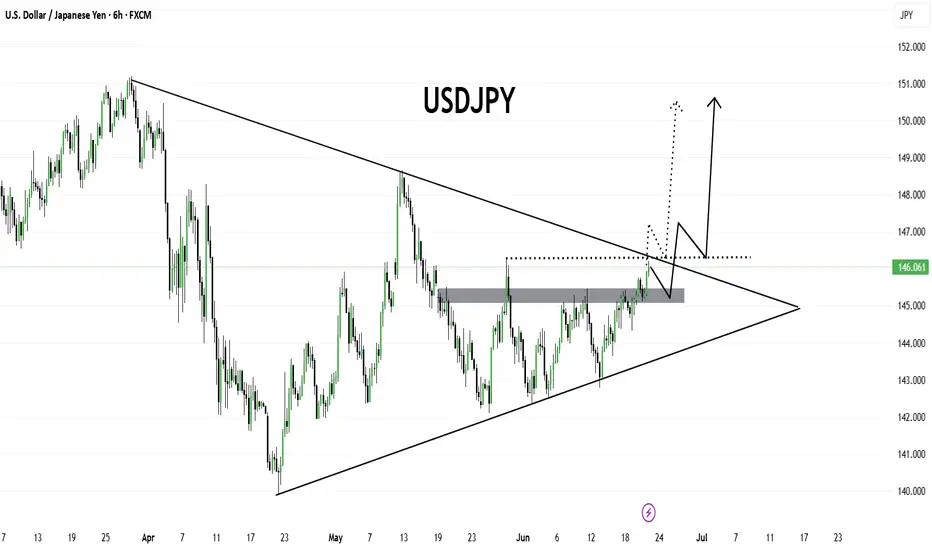
USDJPYUSDJPY is currently approaching a major breakout zone as it nears the apex of a symmetrical triangle pattern. The pair has broken above the key horizontal resistance area around 145.80–146.00, which previously acted as a strong supply zone. Price is now challenging the descending trendline resistance.
A confirmed breakout and retest of the triangle and resistance zone may open the door for a bullish continuation toward 147.50, and potentially 150.00+, as marked on the chart. However, if the breakout fails, we may see a pullback toward the 145.00–144.80 support region before any further upside.
This setup highlights a potential breakout-retest-continuation scenario. Traders should watch for price action confirmation near the trendline for further direction.
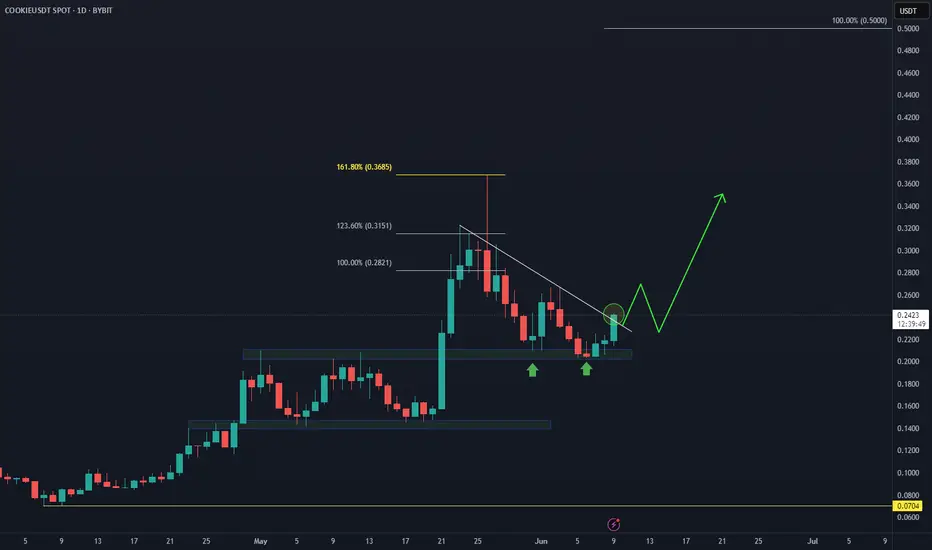
COOKIE Holds Above $0.2—What’s Next?📊 BINANCE:COOKIEUSDT has bounced off the support area at $0.2, signaling the start of a potential upside move that could take it toward $0.5.
🚀 Will momentum carry it higher, or is another test of support coming first?
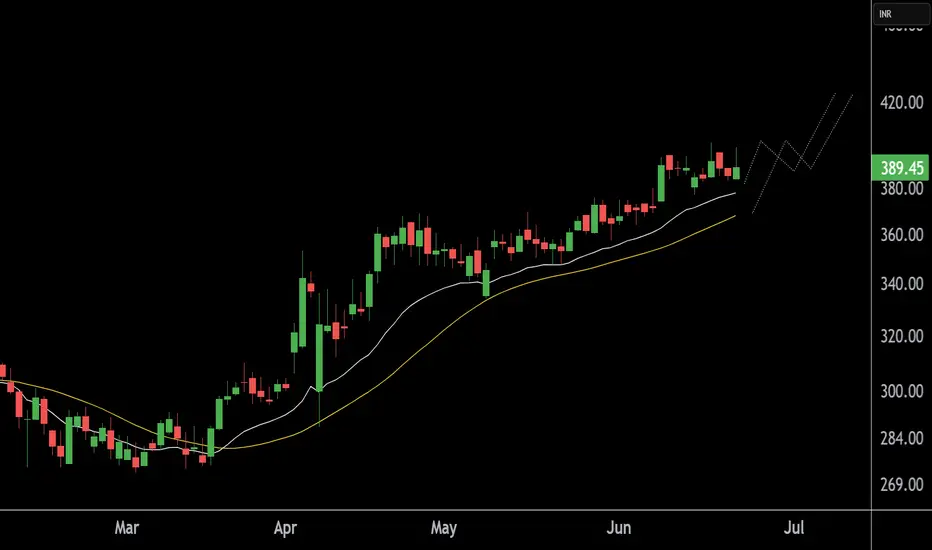
CSBBANK at Best Support !!This is the Daily Chart of CSBBANK.
CSBBANK is currently showing momentum while taking support from the EMA and SMA at 380 and 368 range.
If this level is sustain , then We may see higher prices in CSBBANK
Thank You !!
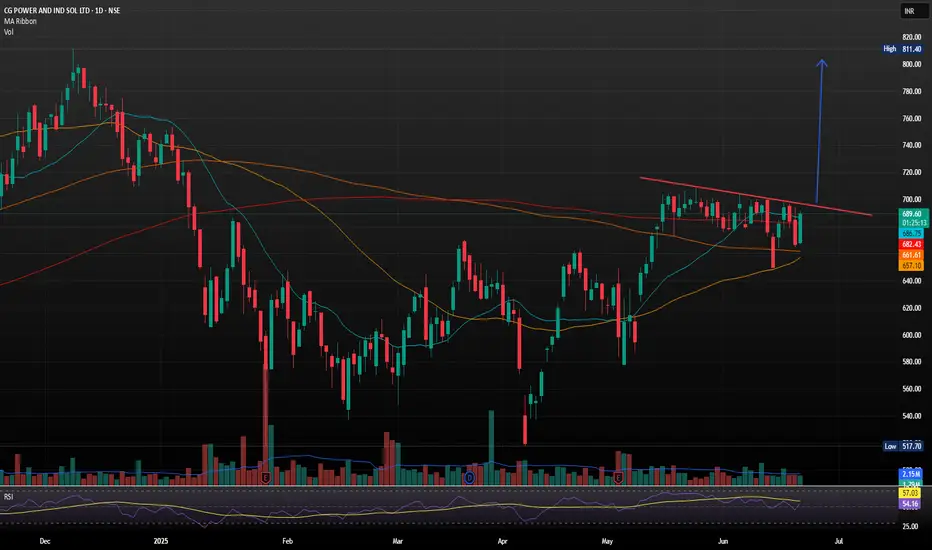
CG Power and Industrial Solutions with Strong Bullish Flag SetupCG Power and Industrial Solutions just landed its largest-ever single order a 641 crore contract from Power Grid Corporation of India Ltd (PGCIL) for high-voltage transformers and reactors
The company, now under the Murugappa Group, reported consolidated FY25 revenues of 9,909 crore. However, annual profit dipped to 972.98 crore from 1,427.61 crore in FY24, despite a strong Q4 showing with a 17% YoY rise in net profit to 274.26 crore.
- Inverse Head & Shoulders Breakout: The stock recently broke out of an inverse H&S pattern, a classic bullish reversal signal, with strong volume confirmation. Holding above 690 could push it toward 750 TO 800.
Support & Resistance Levels
- Support: 663–679 demand zone
- Resistance: 694, 704 and 712
Trend Summary
- Short-Term: Neutral to bullish
- Medium-Term: Bullish bias if it sustains above 690
- Volatility: Elevated, so expect sharp swings
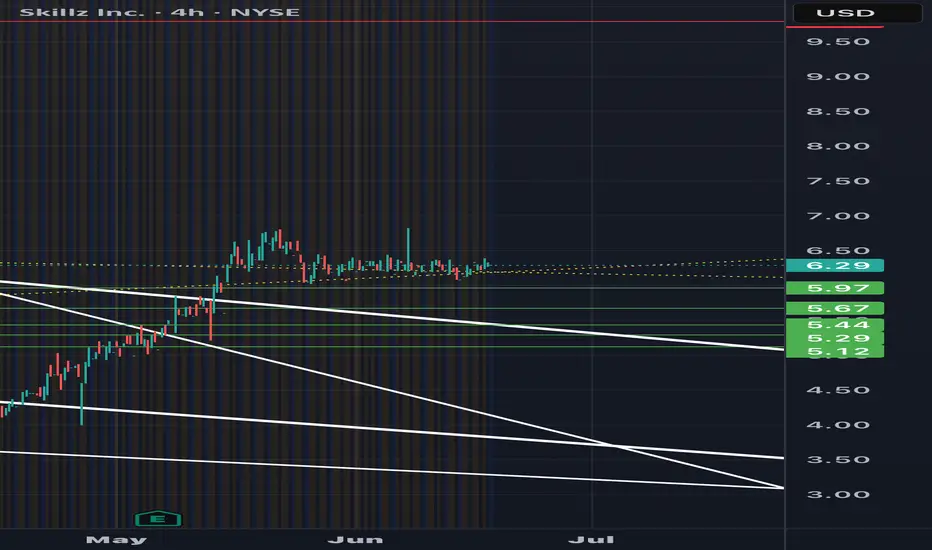
Sklz is about tonser 7$Coiling up buying momentum rising, all this needs is a volume spike.
200 shares 7.48$ and 200 shares in .10+ increments till 8$ this is a STRONG buy based on rsi macd
15min 1hr 4hr 1 day COILED for bull run
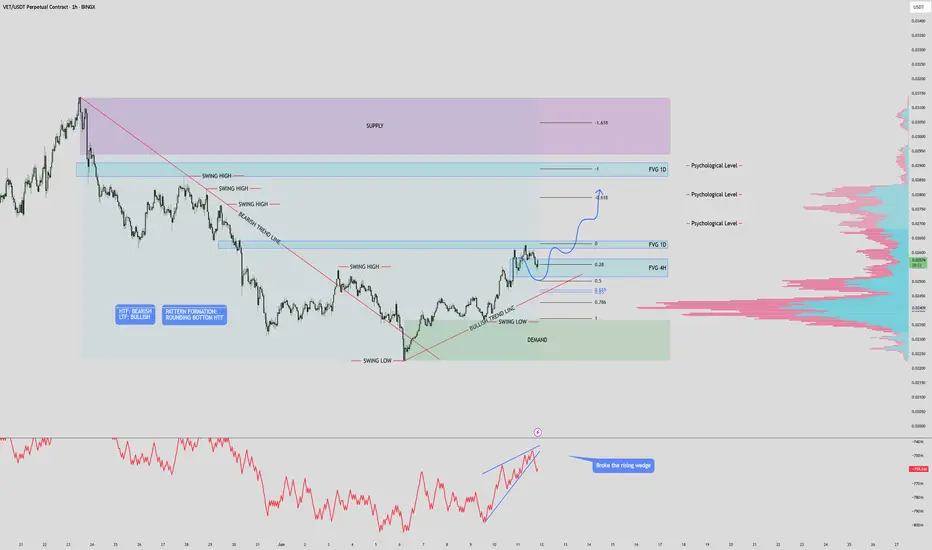
$VET USD 1HR INCOMING PUMP?Structure & Zones
Price is trading between a clear supply zone above and a demand zone below, offering defined areas for reaction.
Two unfilled FVGs on the 1D timeframe above current price could act as magnet zones for price continuation.
A 4H FVG just beneath current price is nearly filled — potential area for a bullish bounce.
Three psychological price levels are marked and align with Fibonacci and FVG targets, likely to act as resistance zones if price pushes higher.
Trend & Pattern
High timeframe (HTF) remains bullish, supported by the formation of a rounding bottom — a strong reversal structure suggesting accumulation.
Lower timeframe (LTF) is showing short-term bearishness as price pulls back and retests key support/trendline.
Price is holding above a bullish trendline, maintaining structure unless a breakdown occurs.
Volume & Momentum
The OBV indicator shows a broken rising wedge, signaling a possible momentum slowdown or short-term correction.
Anchored volume profile reveals high volume beneath price — indicating that previous trading activity supports current levels and adds bullish confluence.
Outlook & Trade Consideration
Bias remains bullish overall, supported by HTF structure and unfilled FVG targets above.
A potential pullback into the 0.5–0.618 fib retracement zone or into the 4H FVG could present long entry opportunities.
On continuation, price may target the daily FVGs and psychological levels as resistance or take-profit zones.
Watch for a rejection at fib/psych levels or breakdown below the bullish trendline to reassess bias.
ETH | BULLISH Pattern | $3K NEXT ??Ethereum has established a clear bullish pattern in the daily as we're seeing an inverse H&S:
The war issues across the globe must also be considered. So far, it's been bullish for crypto but this can also change overnight since it's a very volatile situation - and crypto being a very volatile asset.
For the near term, I believe ETH is due for another increase - at least beyond the current shoulder. This is IF we hold the current support zone:
It seems to be a bit of a slow burn with ETH for this season's ATH. In the ideal world, we'd either:
📢 consolidate under resistance (bullish)
📢make a flag (bullish)
📢OR smash right through the resistance.
But there's likely going to be heavy selling pressure around that zone.
__________________________
BINANCE:ETHUSDT

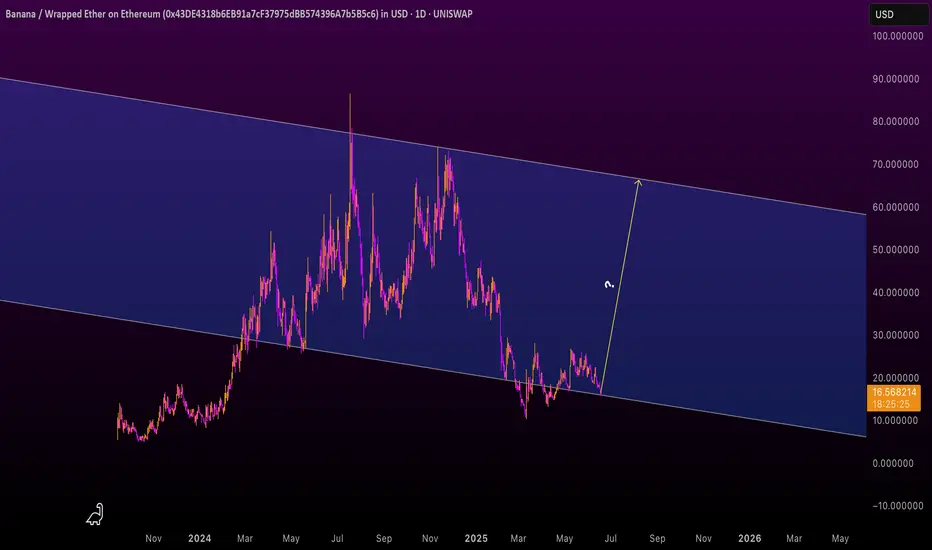
$banana PARALLEL CHANNEL ON BANANA GUN$banana parallel channel on banana gun.
Have we bottomed?
Do we now go to the top of the parallel channel?
I think we go there in june.
Q3 aka july, aug, sep going to be consolidation
Q4 we begin the bull run.
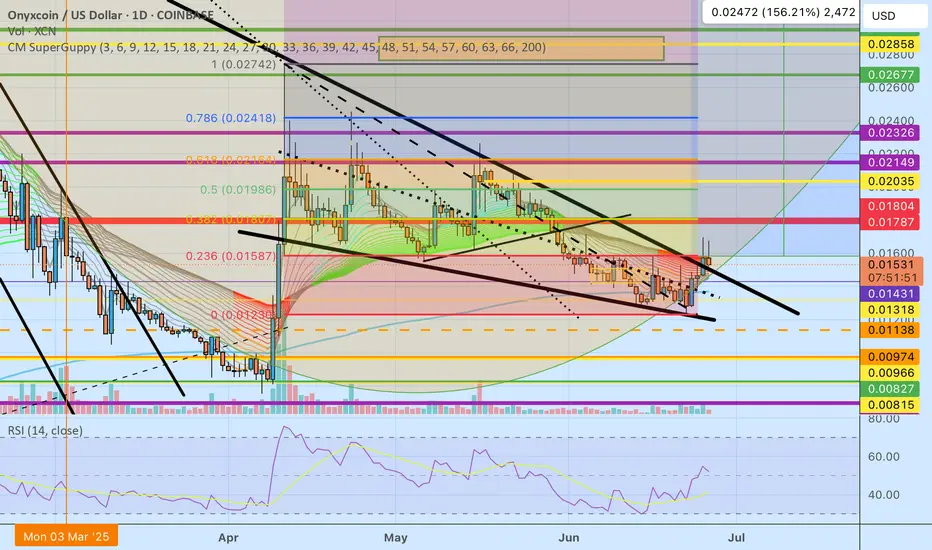
Strong Bullish Divergence. Closed at 8.17 (03-06-2025)
Strong Bullish Divergence.
But 8.45 is an Important Resistance
that needs to sustain on Weekly basis
at least.
Crossing & sustaining 10 would lead it
towards 14 - 15.
On the flip side, 6.50 - 7.0 may act
as a Strong Support level.
