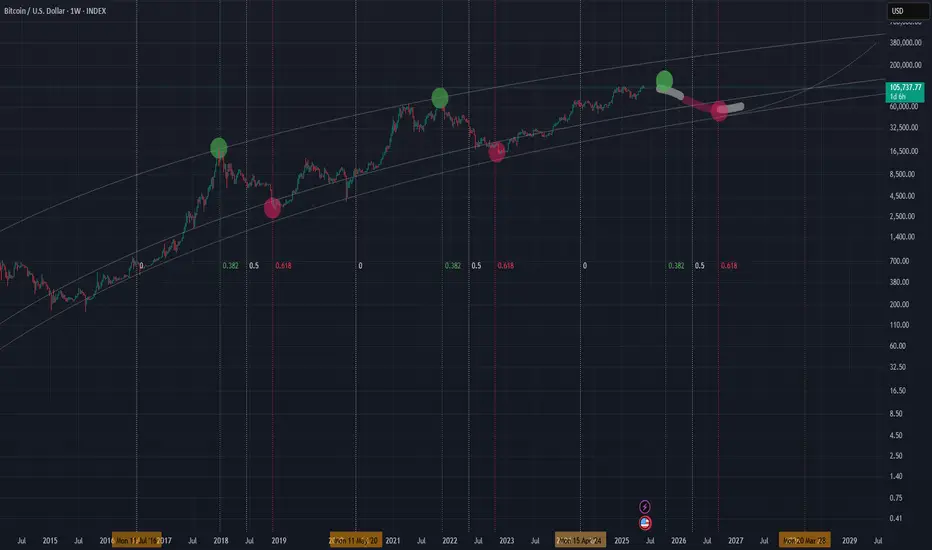
Trend Base Fib Time suggesting getting out before October 2025!I have been warning you that time is running and a few months left before things start cooling off. This tool is trend base fib time , measured from one halving till the next one. I assumed halving in 2028 at some point in march so this result in a target of October to be the month matching with the 0.382 when peaks use to be found. The 0.618 would be the one for catching the bottoms around Sep 2026. Secure some gains and buy back at next bear market lows close to 40k. Cheers
Bullishpattern
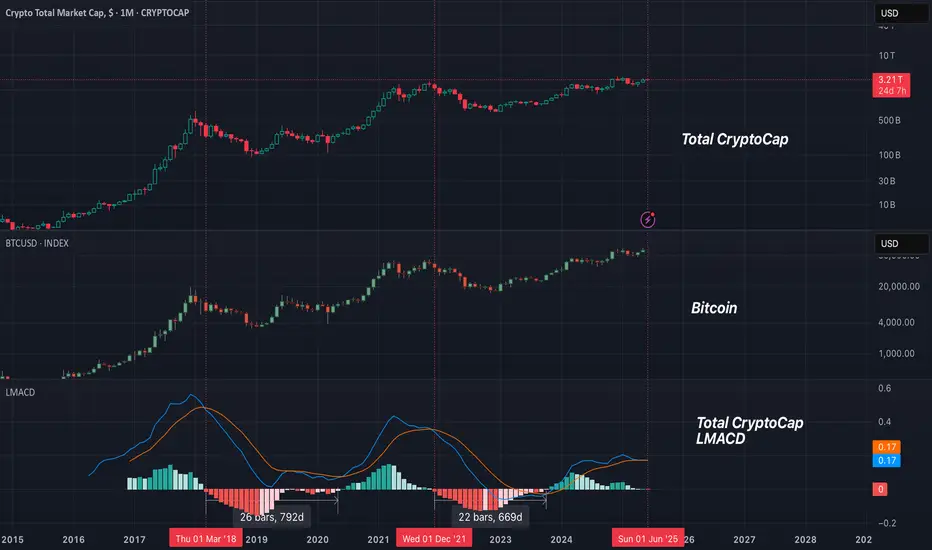
RSI suggesting a bear market comingThis is BTC and it's RSI. Bellow you can see LMACD applied on the RSI indicator to see the trend more clearly. We might be on the stage that we can see higher prices like in 2021, but the bear trend is already printed. Sell some now and buy back at 40k next year. Cheers

Crypto bull market might be ending pretty soonI am warning you that we might seeing the last days of the bull market. SO FAR histogram is printing the first red candle(we need to verify once June ends). Look what happened with btc once LMACD crossed above 0. Winter is coming.
Bullish Divergence
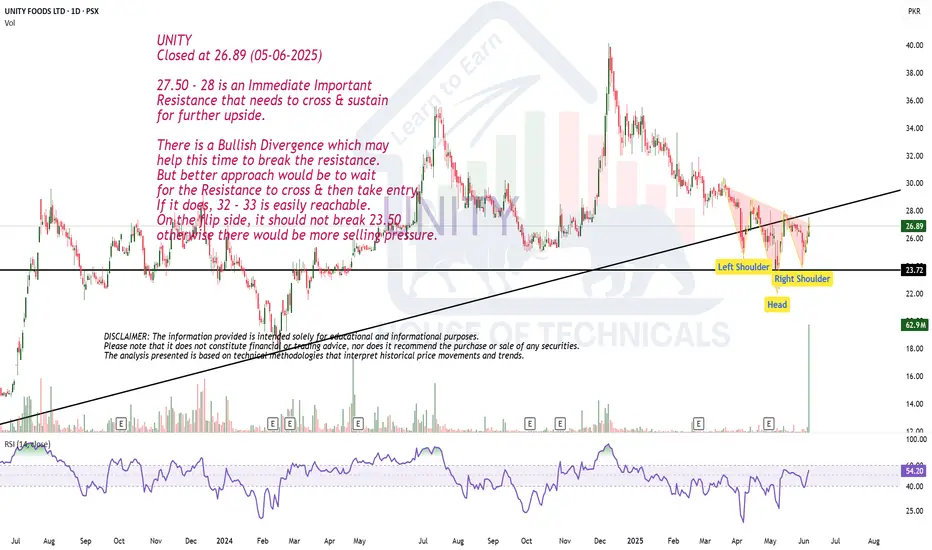
Closed at 26.89 (05-06-2025)
27.50 - 28 is an Immediate Important
Resistance that needs to cross & sustain
for further upside.
There is a Bullish Divergence which may
help this time to break the resistance.
But better approach would be to wait
for the Resistance to cross & then take entry.
If it does, 32 - 33 is easily reachable.
On the flip side, it should not break 23.50
otherwise there would be more selling pressure.
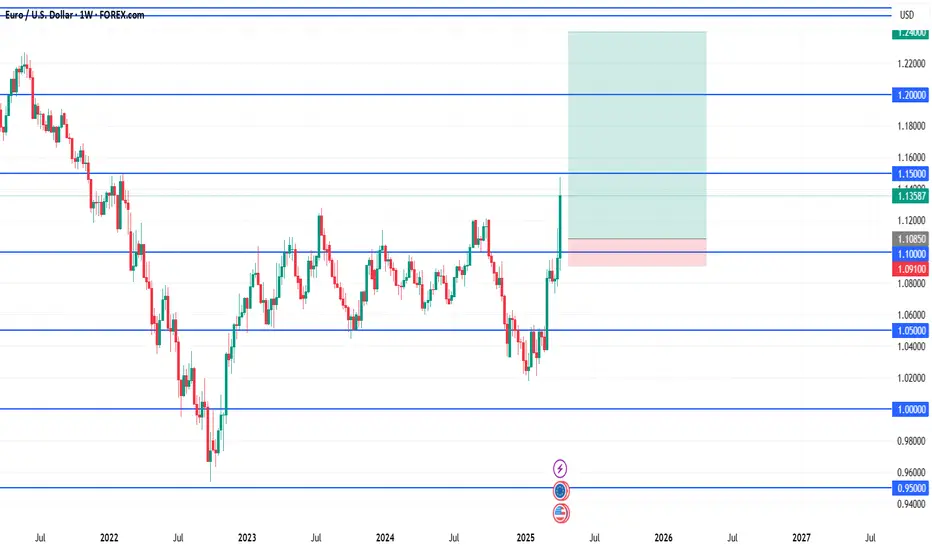
EUR/USD Long📍 Entry (Buy Limit):
1.1085
This is just above the 1.1000 psychological level but below previous minor structure at 1.1100.
Captures a shallow retest without risking being front-run by liquidity sweeps.
🛑 Stop Loss (SL):
1.0910
Below consolidation zone and wicks around 1.10
Provides enough space beneath the major breakout level while staying tight for R:R
🎯 Take Profit Targets:
TP1: 1.1500 (Previous weekly resistance, already tested but not broken)
TP2: 1.2000 (Next clean monthly structure level)
TP3 (macro): 1.2400 (Upper range of long-term channel, highly reactive zone)
⚖️ Risk/Reward:
Risk: ~175 pips
Reward:
• TP1: ~415 pips
• TP2: ~915 pips
• TP3: ~1,315 pips
R:R = 2.4 to 1, 5.2 to 1, 7.5 to 1
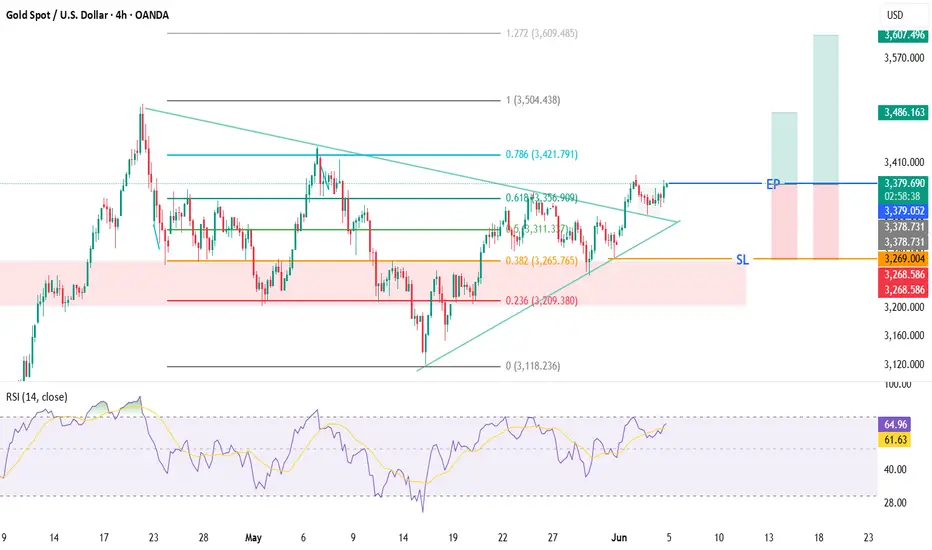
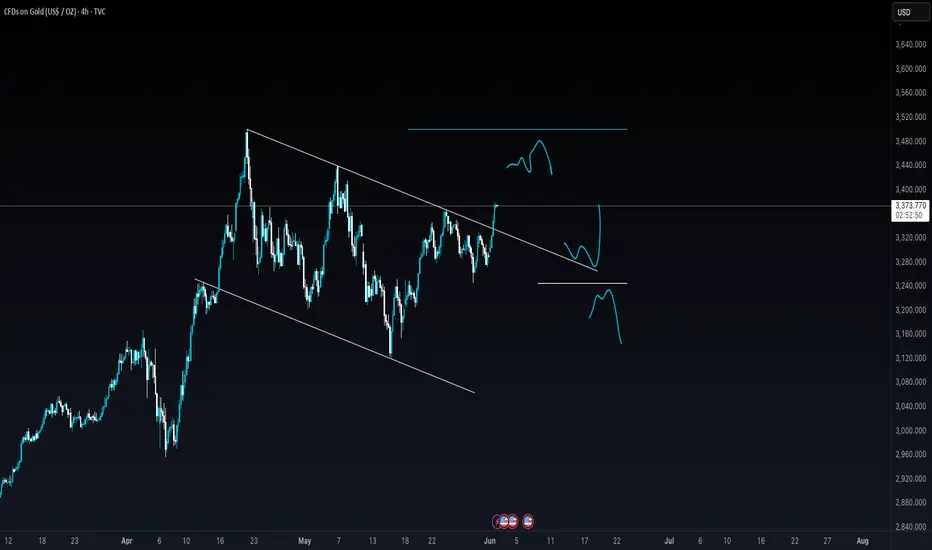
XAUUSD🟡 XAUUSD Bullish Trade Plan – 4H Timeframe
📊 Market Structure: Higher Highs & Higher Lows (HH-HL) following Dow Theory
📐 Trendline Breakout confirmed by strong bullish candle
🕓 Timeframe: 4H
🟢 Entry Price (EP): 3379.052
🔴 Stop Loss (SL): 3269
🎯 Take Profit 1 (TP1): 3486.163 – 🟰 Risk:Reward 1:1
🥇 Take Profit 2 (TP2): 3607 – 🟰 Risk:Reward 1:2
📌 Open Two Trades:
🔸 Trade 1: Target TP1 to secure quick 1:1 profits
🔸 Trade 2: Target TP2 for extended 1:2 gains
🔄 Once TP1 is hit, shift SL of Trade 2 to Entry 🔁
📈 Continue trailing SL upward if momentum persists beyond TP2
⚡ Clean structure, trend alignment, and solid risk control – strong long setup! 🚀
Acorn's Smart Money S&P SignalJune 3, 2025 - After another successful S&P signal in May, we have another Bullish signal for the first part of June. If correct, the bullish S&P indicator suggests the S&P will close above 5861.43 on June 19.

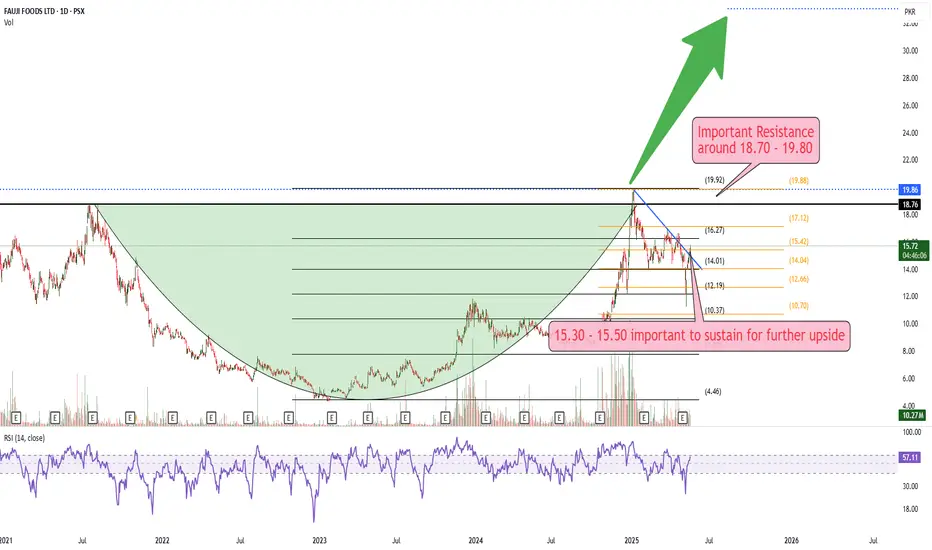
Nice Setup15.30 - 15.50 important to sustain for further upside
Important Resistance is around 18 - 18.70
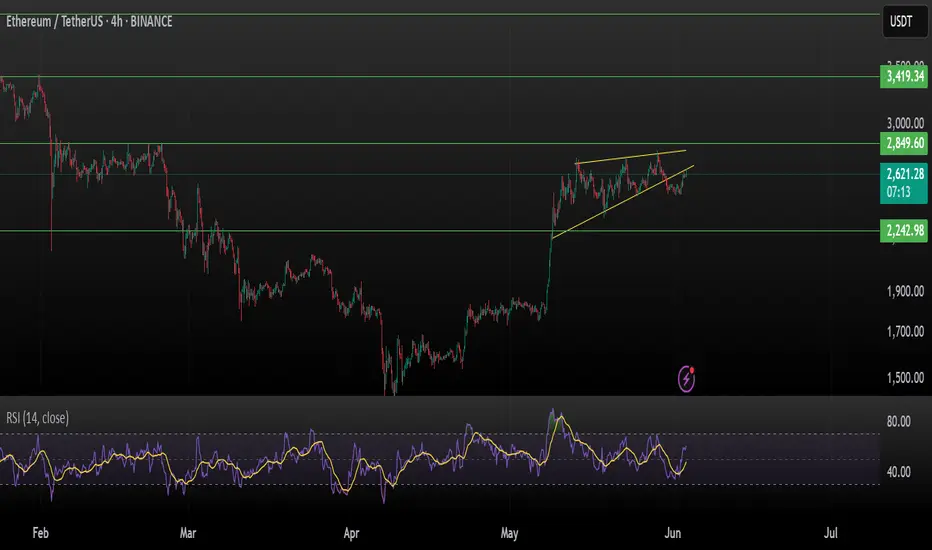
ETH/USDT – Breakout Brewing?Ethereum is currently consolidating within a bullish ascending triangle on the 4H chart. The price is coiling just below the key resistance, so a breakout could ignite the next leg up.
RSI hovering near 50 shows room for momentum buildup.
Setup Analysis:
Structure: Bullish ascending triangle
Momentum: Healthy consolidation after strong rally
RSI: Mid-range, potential to climb
Key Levels:
Resistance: $2,849
Support: $2,430 | $2,243
Breakout Target: ~$3,200 and possibly $3,420 if momentum sustains
Entry (Breakout Play):
Above $2,850 on strong volume
Target Zones:
$3,200, $3,420
Longer-term: $4,050
Stop-loss:
Below $2,430 (pattern invalidated)
Watch closely — breakout confirmation could present a solid bullish opportunity.
This is not financial advice, please do your research before investing, as we are not responsible for any of your losses or profits.
Please like, share, and comment on this idea if you liked it.
#Ethereum #ETH #CryptoTrading #TechnicalAnalysis #Altcoins #Breakout #ETHUSDT #BullishSetup
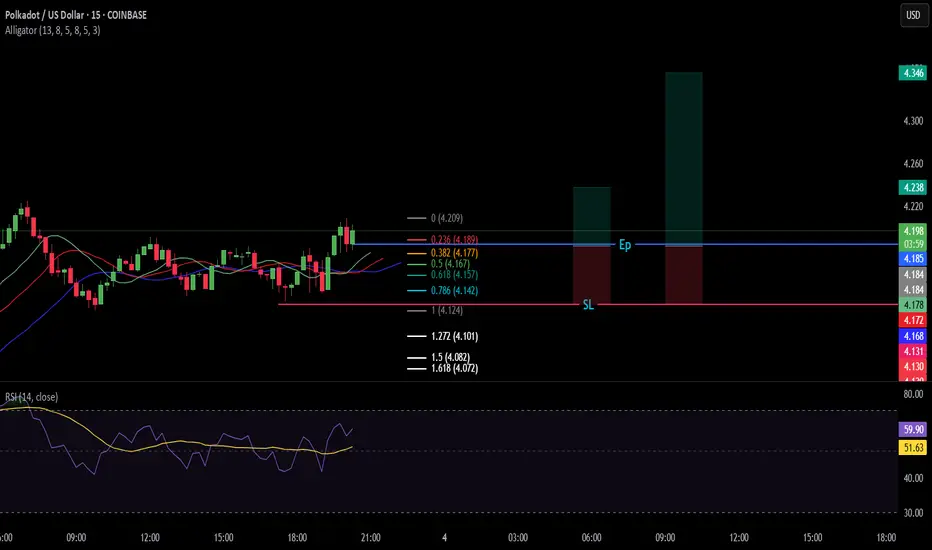
DOTUSDAlligator Strategy Buy Call
Risk Rewar TP 1 1:1 and T2 1:3
Open Two trades one for TP1 other for TP2.
For TP 2 make sure to move your SL to Entry point once price crosses TP1. So that you can ride Tp2 with zero loss.
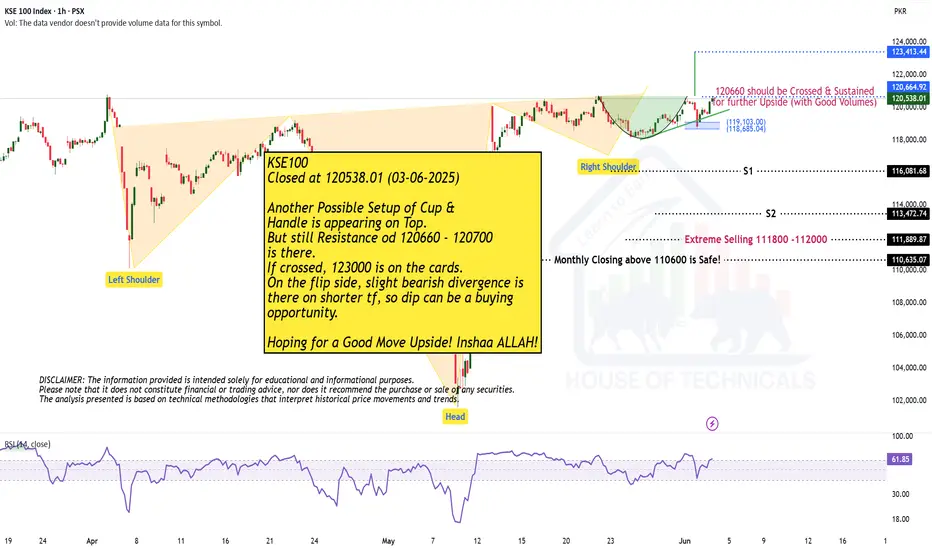
Another Possible Setup of Cup & Handle
Closed at 120538.01 (03-06-2025)
Another Possible Setup of Cup &
Handle is appearing on Top.
But still Resistance od 120660 - 120700
is there.
If crossed, 123000 is on the cards.
On the flip side, slight bearish divergence is
there on shorter tf, so dip can be a buying
opportunity.
Hoping for a Good Move Upside! Inshaa ALLAH!
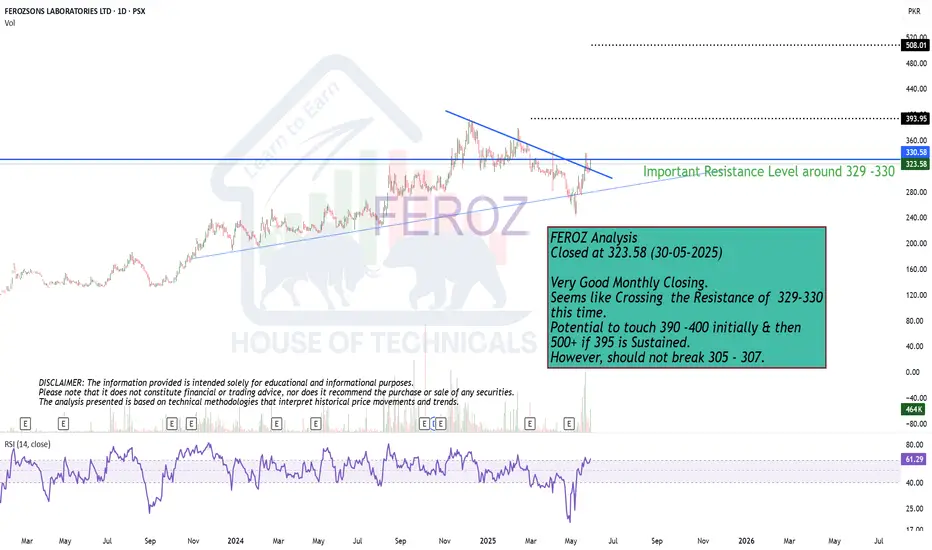
Very Good Monthly Closing.
Closed at 323.58 (30-05-2025)
Very Good Monthly Closing.
Seems like Crossing the Resistance of 329-330
this time.
Potential to touch 390 -400 initially & then
500+ if 395 is Sustained.
However, should not break 305 - 307.
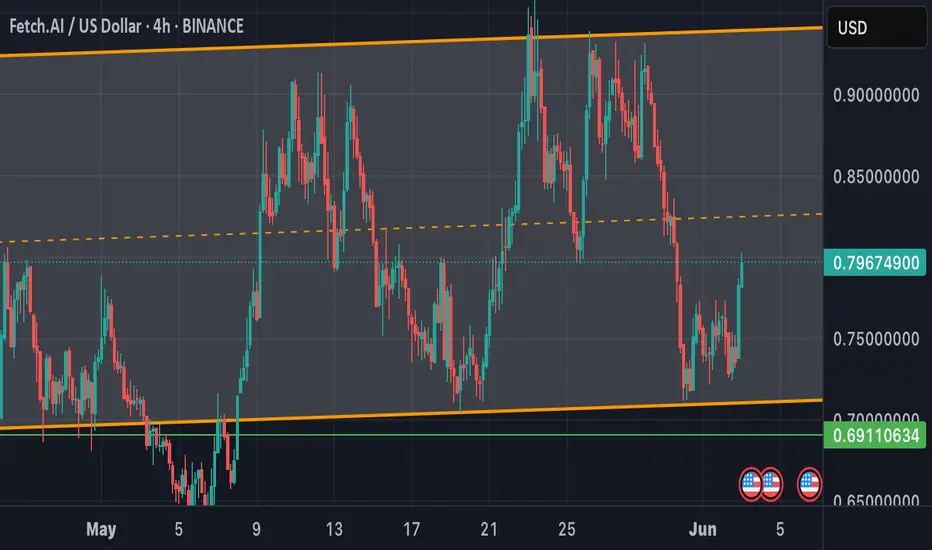
FETAI SURGING TO 2$ canadian by summer. Perfectly bouncing in the support resistance bull climb dating back to when the coin first came about BUY NOW
Hello Symmetrical triangleThe appearance of this symmetrical triangle marks the end of the decline in this cycle, in which the price is stabilizing in order to continue its upward movement. 109 is the next level.

Gold breakout? My opinionGold in short time frame was in bearish trend which it broke out of, however price action is still bearish. Generally trendlines are powerful enough to change price section. Turning points are marked on the chart, I will look for trades in these areas.
Hindcopper's Channel Breakout DueHindustan Copper Ltd. has recently garnered attention due to its strong financial performance and positive market sentiment.
Stock has broken out above key resistance around ₹240–₹245 with volume support.
Trend: Bullish
Indicators:
RSI ~67 (strong momentum)
MACD positive crossover
Above 50- & 200-DMA
Target Levels (Upside Potential)
Target Level Reason
270 Minor resistance zone (prior supply area)
292–295 Near-term swing high (Feb 2024 levels)
320+ Medium-term breakout target if momentum sustains
Stoploss Levels
Stoploss Type Level
Reason
Tight Stoploss 240 Previous breakout zone
Moderate SL 225 Near 50-day moving average
Positional SL 216 Breakdown confirmation below trend support
Buy on dips strategy around 245 -250 levels

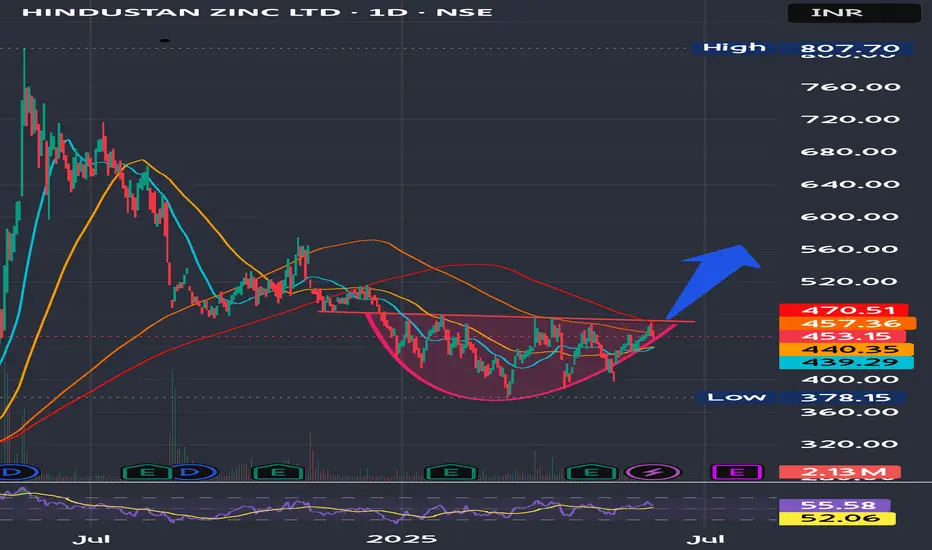
Hindustan Zinc Ltd at near breakout Hindustan Zinc Ltd. (Hindzinc) is one of the world's largest integrated producers of zinc, lead, and silver.
It is near a crucial resistance level and making higher lows indicating a breakout upwards soon.
Trading Levels-
Tgt Price-564
SL-448.5
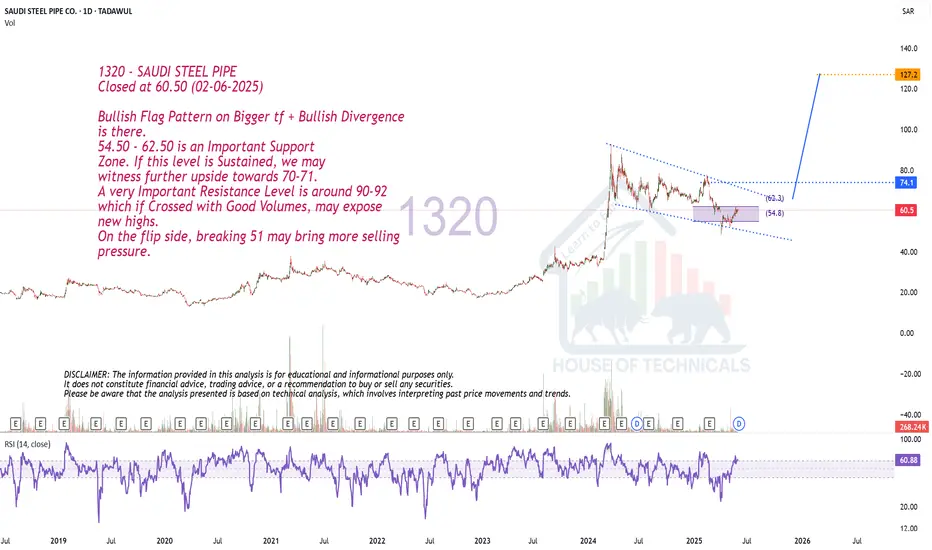
Bullish Flag Pattern on Bigger tf + Bullish Divergence
Closed at 60.50 (02-06-2025)
Bullish Flag Pattern on Bigger tf + Bullish Divergence
is there.
54.50 - 62.50 is an Important Support
Zone. If this level is Sustained, we may
witness further upside towards 70-71.
A very Important Resistance Level is around 90-92
which if Crossed with Good Volumes, may expose
new highs.
On the flip side, breaking 51 may bring more selling
pressure.
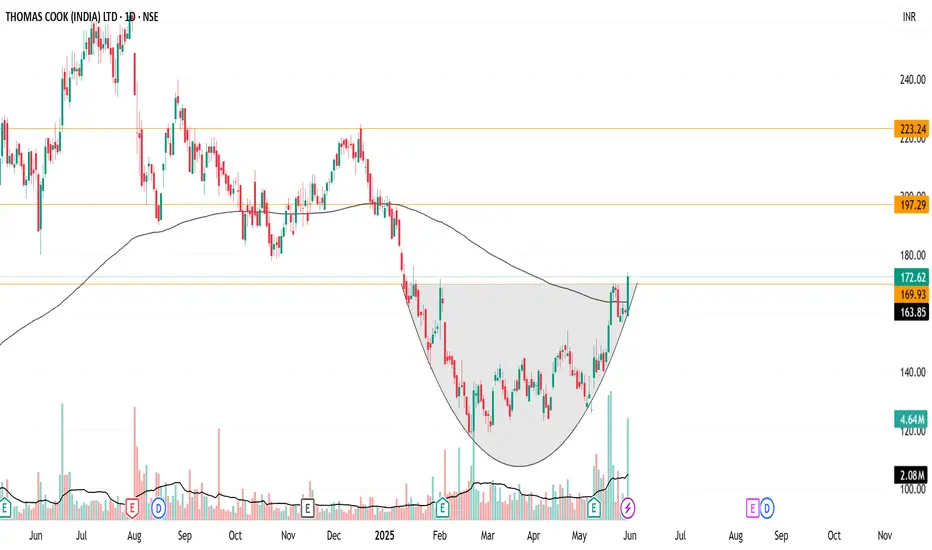
Cup and Handle Breakout in THOMAS COOK (INDIA) LTDTHOMAS COOK (INDIA) LTD is showing a classic Cup and Handle breakout pattern on the daily chart.
🔍 Chart Highlight
Breakout from the Cup's rim around ₹169.93 level.
Strong bullish candle with +7.61% gain, backed by higher volume.
Price sustained above the 200 EMA (₹163.85).
Next potential resistance: ₹197.29, a previous swing high.
Levels to Watch:
Support Zone: ₹163.85 – ₹169.93 (200 EMA + breakout retest zone)
Resistance Zone: ₹197.29 (next swing high)
If the price retests and holds above ₹169.93, it could offer a good risk-reward opportunity with ₹197+ as the near-term target. Keep an eye on volume and any pullback toward the breakout zone.
⚠️ Disclaimer:
This idea is for educational purposes only and not financial advice. Please do your own research or consult your financial advisor before making any trading decisions. Markets carry risk — trade wisely!
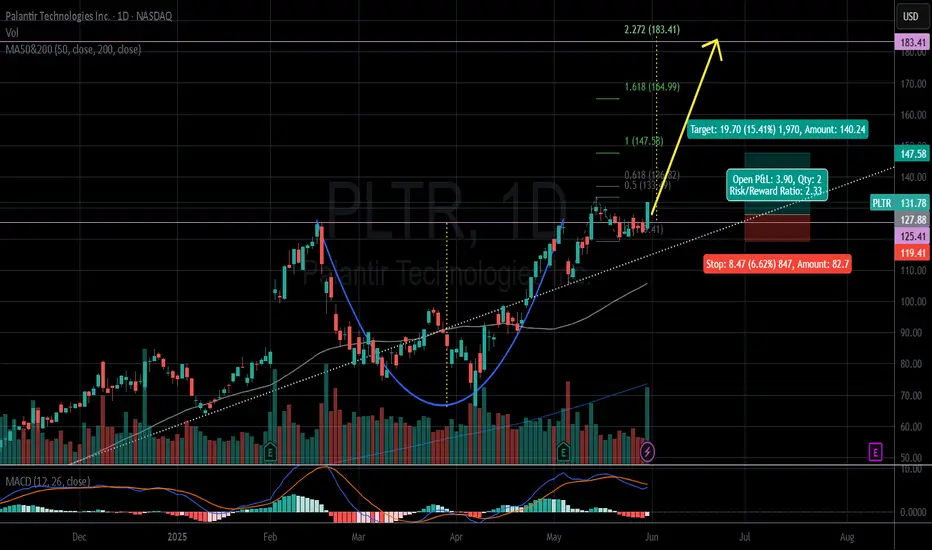
PLTR still bullish - Cup n Handle patternPLTR in Cup and handle pattern, broke out.
The price closed on Friday is $131.78 (05.30.2025).
Desired entry price $127.88.
Target $147.58/ 164.99/ 183.41.
Stop loss $119.41.
IMO.
AAVE ANALYSIS🔮 #AAVE Analysis 💰💰
📊 #AAVE is making perfect and huge rounding bottom pattern in daily time frame, indicating a potential bullish move. If #AAVE retests little bit and breakout the pattern with high volume then we will get a bullish move📈
🔖 Current Price: $248
⏳ Target Price: $348
⁉️ What to do?
- We have marked crucial levels in the chart . We can trade according to the chart and make some profits. 🚀💸
#AAVE #Cryptocurrency #Pump #DYOR

NVDA: Ascending triangle break, bull flag on S/R retestHey traders! I'm back and once again, I've spent almost the whole evening (lol) trying to figure out the odd, strange price action we've seen from NASDAQ:NVDA over the past few weeks, and especially today!
As we all know (I assume), Nvidia failed to disappoint on earnings once again, and we saw a HUGE gap up overnight, as far as up to the $143 mark. However, we soon began to see a dip. That's fair, as traders will likely sell and take profit.
However, the dip became a larger dip, and Nvidia finished the day basically at 3.2%. But it seems that the pullback may been pretty healthy.
Because as you can see from the chart, Nvidia has been forming an ascending triangle ever since the 14th May. That was after the sweet run it had prior to that. It has tested the £136-137 area as a major resistance line ever since until finally, a strong earnings report sent Nvidia above the line.
After the gap up, throughout the day, the stock went into a controlled, composed downward channel which what we like to call, a bull flag. This is taking into consideration market hours, not extended hours. This bull flag is bullish in its own way, but it is also a sign of a retest of the $136-137 resistance zone. This is officially a support zone now.
A successful retest from this support zone will cause a bounce, especially from the support trendline, and likely send the stock towards $140+, possibly extending its reach to $150 if broader market strength (Nasdaq) continues.
On the contrary, a dip below the support line and a crash below the red support trendline, would likely send the stock lower to $133 as next support.
As long as Nvidia maintains $136-137, the bulls are in control.
Note: Not financial advice. Please do your DD.

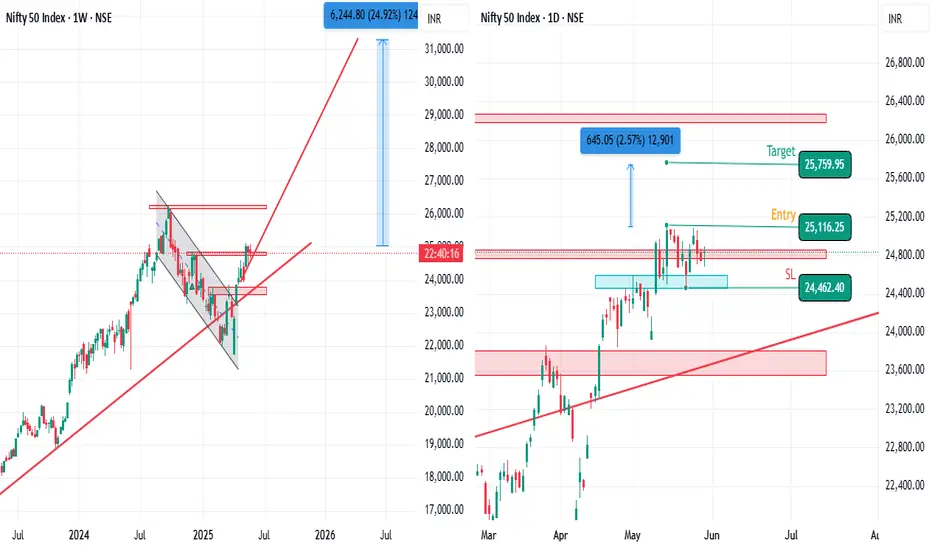
DB patternhi traders,
Here is an opportunity to grab 500 to 600 pts in Nifty.
A DB pattern in daily timeframe has formed, if the neckline breaks buy nifty.
Neckline level : 25116.25
Target : 25759.95
SL : 24462.40